nation: China

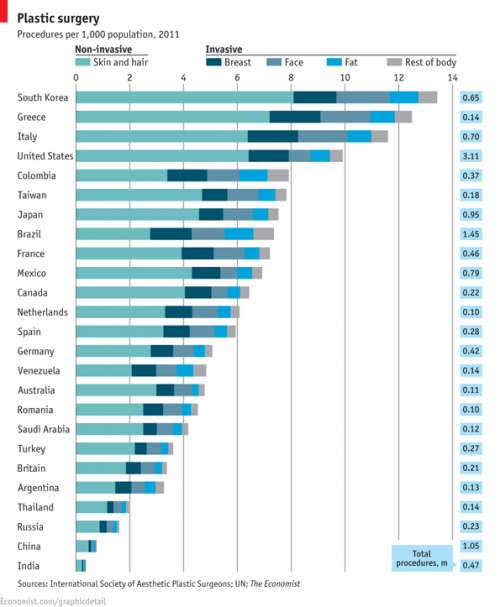
The  International Society of Aesthetic Plastic Surgeons has released new data on the incidence of invasive and non-invasive cosmetic procedures.  The U.S. leads in sheer numbers of procedures but, accounting for population, we fall into 4th place.  South Korea leads for the number of procedures per person, followed by Greece and Italy.

1

By far the most common kinds of surgical cosmetic procedures are lipoplasty and breast augmentation.  Along with fat, breasts seem to be a particular concern: breast lifts and breast reductions for both men and women are also in the top ten.  Abdominoplasty, nose jobs, eyelid surgeries, and facelifts are as well.

2

The incidence of these surgeries is strongly related to everything from the gender binary to global power dynamics.  In 2008 we reported that male breast reductions were the most common cosmetic surgery for 13-19 year olds (boys and girls combined). You would be shocked at what counts as excess breast tissue and how little the before and after photos look.  Boys and men getting breast reductions, alongside women getting augmentations, is obviously about our desire for men and women to be different, not naturally-occurring difference.  See The Story of My Man-Boobs for more.

Likewise, we’ve posted about surgeries that create an epithelial fold, a fold of skin in the eyelid more common in people with White than Asian ethnic backgrounds.  This surgery is a trend among Asians and Asian-Americans, as colonization has left us with an association between Whiteness, attractiveness, and power.

The Economist summarizes some other trends:

Breast augmentation, the second biggest surgical procedure, is most commonly performed in America and Brazil. Buttock implants are also a Brazilian specialty, as is vaginal rejuvenation. Asia is keen on nose jobs: China, Japan and South Korea are among the top five nations for rhinoplasty.

More on where and how many procedures are being performed, but nothing on why, at the ISAPS report.

Image at The Economist; via Global Sociology.

Lisa Wade, PhD is an Associate Professor at Tulane University. She is the author of American Hookup, a book about college sexual culture; a textbook about gender; and a forthcoming introductory text: Terrible Magnificent Sociology. You can follow her on Twitter and Instagram.

Cross-posted at Neuroskeptic.

“Personality differences” between people from different countries may just be a reflection of cultural differences in the use of “extreme” language to describe people.

That’s according to a very important paper just out from an international team led by Estonia’s René Mõttus.

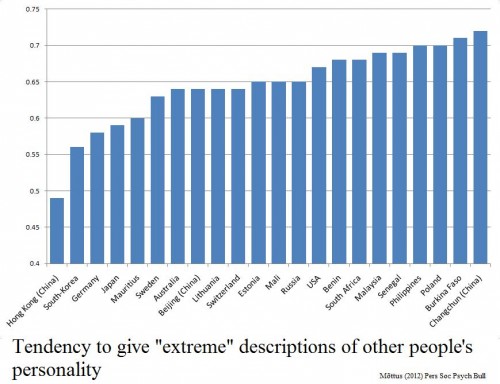
There’s a write up of the study here. In a nutshell, they took 3,000 people from 22 places and asked them to rate the personality of 30 fictional people based on brief descriptions (which were the same, but translated into the local language). Ratings were on a 1 to 5 scale.

It turned out that some populations handed out more of the extreme 1 or 5 responses. Hong Kong, South Korea and Germany tended to give middle of the road 2, 3 and 4 ratings, while Poland, Burkina Faso and people from Changchun in China were much more fond of 1s and 5s.

The characters they were rating were the same in all cases, remember.

Crucially, when the participants rated themselves on the same personality traits, they tended to follow the same pattern. Koreans rated themselves to have more moderate personality traits, compared to Burkinabés who described themselves in stronger tones.

Whether this is a cultural difference or a linguistic one is perhaps debatable; it might be a sign that it is not easy to translate English-language personality words into certain languages without changing how ‘strong’ they sound. However, either way, it’s a serious problem for psychologists interested in cross-cultural studies.

I’ve long suspected that something like this might lie behind the very large differences in reported rates of mental illness across countries. Studies have found that about 3 times as many people in the USA report symptoms of mental illness compared to people in Spain, yet the suicide rate is almost the same, which is odd because mental illness is strongly associated with suicide.

One explanation would be that some cultures are more likely to report ‘higher than normal’ levels of distress, anxiety — a bit like how some make more extreme judgements of personality.

So it would be very interesting to check this by comparing the results of this paper to the international mental illness studies. Unfortunately, the countries sampled don’t overlap enough to do this yet (as far as I can see).

Source: Mõttus R, et al (2012). The Effect of Response Style on Self-Reported Conscientiousness Across 20 Countries. Personality and Social Psychology Bulletin PMID: 22745332

————————

Neuroskeptic blogs anonymously here.  You can also follow him on Twitter.

Cross-posted at Reports from the Economic Front.

The Pew Research Center recently published a report titled “Pervasive Gloom About the World Economy.” The following two charts come from Chapter 4 which is called “The Causalities: Faith in Hard Work and Capitalism.”

The first suggests that the belief that hard work pays off remains strong in only a few countries: Pakistan (81%), the U.S. (77%), Tunisia (73%), Brazil (69%), India (67%) and Mexico (65%). The low scores in China, Germany, and Japan are worth noting. This is not to say that people everywhere are not working hard, just that many no longer believe there is a strong connection between their effort and outcome.

The second chart highlights the fact that growing numbers of people are losing faith in free market capitalism.  Despite mainstream claims that “there is no alternative,” a high percentage of people in many countries do not believe that the free market system makes people better off.

GlobeScan polled more than 12,000 adults across 23 countries about their attitudes towards economic inequality and, as the chart below reveals, the results were remarkably similar to those highlighted above.  In fact, as GlobeScan noted, “In 12 countries over 50% of people said they did not believe that the rich deserved their wealth.

It certainly seems that large numbers of people in many different countries are open to new ways of organizing economic activity.

Martin Hart-Landsberg is a professor of economics at Lewis and Clark College. You can follow him at Reports from the Economic Front.

Cross-posted at Montclair SocioBlog.

Air pollution is what economists call an “externality.”  It is not an intrinsic part of the economic bargaining between producers and consumers.  The usual market forces — buyers and sellers pursuing their own individual interests — won’t help.  The market may bring us more goods at lower prices, for example, but it can harm the air that everyone, in or out of that market, has to breathe. To create or protect a public good, the free market has to be a little less free.  That’s where government steps in.  Or not.

Case in point: My son and his girlfriend arrived in Beijing ten days ago.  The got-here-safely e-mail ended with this:

…was blown away by the pollution! I know people talk about it all the time, but it really is crazy.

And it is.  Here’s a photo I grabbed from the Internet:

Flickr creative commons by nasus89.

At about the same time, I came upon a this link to photos of my home town Pittsburgh in 1940.  Here are two of them:
Today in downtown Pittsburgh, the streetcars and overhead trolleys are gone.  So are the fedoras.  And so is the smoke.

The air became cleaner in the years following the end of the War.  It didn’t become clean all by itself, and it didn’t become clean because of free-market forces.  It got clean because of government — legislation and regulation, including an individual mandate.

The smoke was caused by the burning of coal, and while the steel mills accounted for some of the smoke, much of the it came from coal-burning furnaces in Pittsburghers’ houses.  If the city was to have cleaner air, the government would have to force people change the way they heated their homes.  And that is exactly what the law did. To create a public good — clean air — the law required individuals to purchase something — either non-polluting fuel (oil, gas, or smokeless coal) or smokeless equipment.*

Initially, not everyone favored smoke control, but as Pittsburgh became cleaner and lost its “Smoky City” label, approval of the regulations increased, and there was a fairly rapid transition to gas heating.  By the 1950s, nobody longed for the unregulated air of 1940.  Smoke control was a great success.**  Of course, it may have helped that Pittsburgh did not have a major opposition party railing against this government takeover of home heating or claiming that smoke control was a jobs-killing assault on freedom.

————————

* Enforcement focused not on individuals but distributors.  Truckers were forbidden from delivering the wrong kind of coal.

** For a fuller account of smoke control in Pittsburgh, see Joel A. Tarr and Bill C. Lamperes, Changing Fuel Use Behavior and Energy Transitions: The Pittsburgh Smoke Control Movement, 1940-1950: A Case Study in Historical Analogy. Journal of Social History , Vol. 14, No. 4, Special Issue on Applied History (Summer, 1981), pp. 561-588.

Jay Livingston is the chair of the Sociology Department at Montclair State University. You can follow him at Montclair SocioBlog or on Twitter.

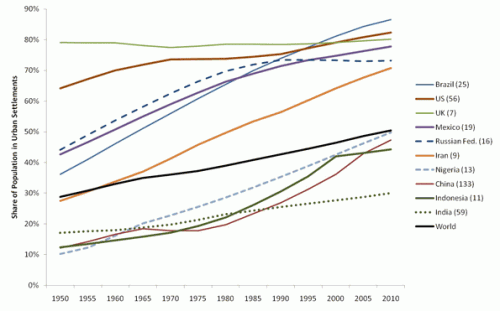
Urban Demographics posted some graphs from the UN’s State of the World’s Cities 2010/2011 report on global urbanization trends. A snapshot of urbanization in 11 countries:

You can see a few other notable trends here that illustrate various national trajectories, as Phil McDermott at Cities Matter points out. For instance, notice that while Russia underwent rapid urbanization between 1950 and 1980, it has leveled off since then. Similarly, Indonesia’s urbanization slowed significantly in the late ’90s and has continued at a much slower pace since then. We also see quite different patterns between the world’s two most populous nations: While China’s urbanization rate sped up in the early ’90s (after urbanization actually dipped in the ’70s), India has experienced fairly slow urbanization.

Credit Suisse released a report on urbanization and emerging markets, if you’re interested in the impacts of urbanization on a wide array of economic development indicators, from electricity and steel consumption to projections of future housing needs to incomes and standards of living.

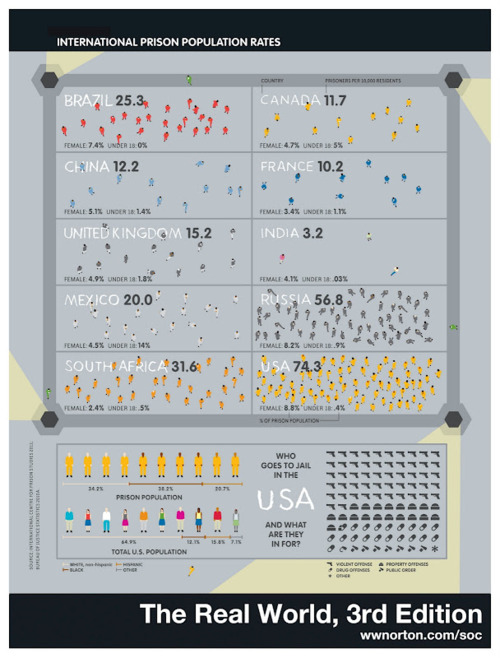
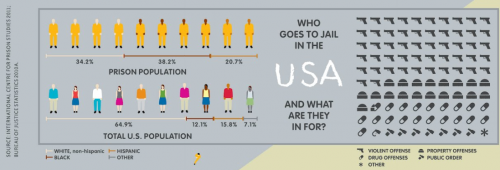
Norton Sociology recently posted an image that illustrate differences in rates of imprisonment in a number of countries. Imprisonment rates are influenced by a number of factors — what is made illegal, how intense law enforcement efforts are, preference for prison time over other options, etc. The U.S. does not compare favorably, with 74.3 per 100,000 10,000 of our population behind bars (click here for a version you can zoom in on, and sorry for the earlier typo!):

Here’s a close-up of the breakdown of the U.S. prison population:

Via Urban Demographics.

Cross-posted at Jezebel.

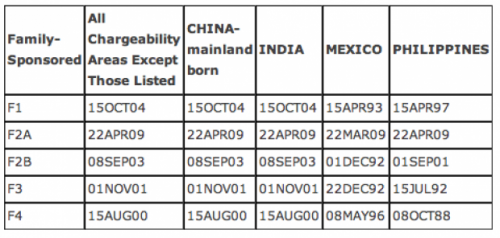
Yesterday I posted about U.S. immigration trends, updated through 2010. Following up on that, Dolores R. found another immigration-related post by KPCC…this time, a look at the wait time to get a family-sponsored immigration visa. With the removal of strict, racialized quotas in 1965, the U.S. turned to a policy based on a set of priorities for deciding who would be granted a visa; among the various categories was a preference for those who had sponsoring relatives already living in the U.S., with different visas and priorities based on family relationship:

  • F1 = unmarried adult children of U.S. citizens
  • F2A = spouses and children (under age 21) of permanent residents
  • F2B = unmarried adult children of permanent residents
  • F3 = married adult children of U.S. citizens
  • F4 = siblings of adult U.S. citizens

According to the U.S. State Department, the annual minimum family-reunification visa target is 226,000 (note that this excludes spouses, parents, and minor children of U.S. citizens, who are highest priority for immigration and are exempt from immigration caps). The Immigration and Naturalization Act requires that family-sponsorsed (as well as employer-sponsored) visas be granted in the order that eligible potential immigrants applied. Unsurprisingly, many years there are more eligible applicants than there are available visas, leading to a backlog of individuals who qualify to immigrate but are waiting for a visa to become available. In particular, China, Mexico, India, and the Philippines are “oversubscribed,” meaning there is a significant backlog.

How long? The table below shows the cut-0ff date for visa applicants in each category as of January 2012. That is, the dates given here are the date by which a person had to apply to finally have a visa available this month; the 2nd column shows for all areas excluding the four countries singled out because of their particularly long wait times:

The least oversubscribed visa category is the F2A, where those now receiving visas will have waited a bit under 3 years. But look at some of the other dates listed. For F1, F2B, and F3 visas from Mexico, the people now at the head of the line have been waiting nearly two decades, having applied in 1992 or early 1993. F4 applicants from the Philippines have been waiting almost a quarter century, since 1988.

This is part of the reason why undocumented immigration continues, and arguments about fairness and waiting their turn in line may not be particularly compelling to individuals who want to reunite with family members in the U.S. Waiting a year, or two, or five, may seem reasonable. If you learn there’s a 20-year wait, the cost/benefit analysis of whether to wait for the visa to come through or to find other means may shift significantly, regardless of how otherwise law-abiding a person might be.

For the last week of December, we’re re-posting some of our favorite posts from 2011.

————————

The US economy faces a number of challenges—among them a lack of job creation and an ever-growing trade deficit. Many policy-makers believe that encouraging business innovation is the best response to these particular challenges. Sounds plausible but experience suggests otherwise.

The best example of why simply encouraging business innovation is not the answer for our employment and trade problems is Apple and its iPhone.

The iPhone was introduced in 2007 and has been incredible successful.  U.S. sales soared from 3 million units in 2007 to over 11 million in 2009.  Global sales topped 25 million in 2009.

While the iPhone is designed and marketed by Apple, almost all the phone’s components are produced by foreign companies operating outside the United States.  These components are then shipped to China where Foxconn, a Taiwanese company, oversees their assembly and their export to the United States and other countries.  As a result, the iPhone generates few jobs in the United States.

Two economists, in an Asian Development Bank working paper, examined the iPhone 3G production process in some detail.  The table below, taken from their study, highlights the main suppliers and the costs of the components they produce for a single phone.  Most of the components are supplied by Japanese, South Korean and German firms, although there are also some U.S. suppliers (although who knows where they actually produce their compnents).

The total component cost of an iPhone in 2009 was $172.46.    Workers in China assemble the iPhone, but because their wages are low the assembly cost per phone (labeled manufacturing costs in the table below) is quite small, only $6.50 a phone.  The total production cost per phone is $178.96.

costs.jpg

Because the iPhone is assembled in China all sales in the U.S. mean an increase in Chinese exports (even though the phone is largely composed of inputs produced outside of China) and an increase in U.S. imports.  In 2009, China exported more than $2 billion worth of iPhones to the United States.  Thus, the iPhone, because of the Apple’s production strategy, also adds to the U.S. trade deficit.

Apple is not alone in embracing China as its production base.  China is now the world’s largest exporter of manufactured goods. And, as the chart below shows, the share of Chinese exports that are labled high technology is growing.  This trend has encouraged many analysts to claim that the U.S. is now locked in fierce economic competition with China.

hitech.jpg

However, as we see next, more than 80% of China’s high technology exports are actually produced by foreign companies operating in China.  Moreover, these foreign companies have significantly increased their control over this production.  In 2002 foreign owned firms that were 100% foreign owned (which means that they had no Chinese partner) accounted for only 55% of Chinese high technology exports.  In 2009 they accounted for 68%.

foreign-owned.jpg

Why do so many transnational corporations choose to locate production in China?  The answer is obvious: profits. Apple again serves as a good example.  The table below, taken from the Asian Development Bank working paper cited above, shows Apple’s profit-margin on the iPhone.  In 2009 it was a whopping big 64%.

profits.jpg

Struck by the size of Apple’s profit-margin, the authors of the Asian Development working paper considered whether the iPhone could reasonably be made in the United States.  As they note:

The role of the PRC in the production chain of iPhones is primarily the assembly of all parts and components into the final product for re-shipment abroad. The skills and equipment required for the assembly are very basic and there is no doubt that American workers and firms are capable of assembling iPhones in the US. If all iPhones were assembled in the US, the US$1.9 billion trade deficit in iPhone trade with PRC would not exist. Moreover, 11.4 million units of iPhone sold in the non-US market in 2009 would add US$5.7 billion to US exports.

For the sake of discussion, they assumed that assembly line wages in the U.S. are ten times higher than in China.   Given that Chinese production workers earn roughly $1 an hour, that is not an unreasonable assumption.  The higher wages would mean that the total assembly cost per phone would rsie to $65 and the total manufacturing cost would approach $238.  If Apple continued to sell the iPhone for $500, the company would still earn a very respectable 50% profit margin.

Moreover, as the authors point out:

In this hypothetical scenario, iPhones, the high-tech product invented by the U.S. company, would contribute to U.S. exports and the reduction of the U.S. trade deficit, not only with the PRC, but also with the rest of world. More importantly, Apple created jobs for U.S. low skilled workers; those who could not be the software engineers needed by Apple. Giving up a small portion of profits and sharing them with low skilled U.S. workers by Apple would be a more effective way [than depreciation of the exchange rate] to reduce the U.S. trade deficit and create jobs in the United States.

Of course, shifting production to the United States would mean that Apple would earn less money and there is little reason to believe that the company is prepared to sacrifice its profits for the good of the country.  If we want to tackle our employment and trade problems were are going to have to do more than promote more attractive conditions for business.