energy


We previously posted Annie Leonard’s breakthrough video, The Story of Stuff, and a follow up, The Story of Bottled Water. Kraig H. sent along another by Leonard on how cap and trade will not stop climate change:

Lisa Wade, PhD is an Associate Professor at Tulane University. She is the author of American Hookup, a book about college sexual culture; a textbook about gender; and a forthcoming introductory text: Terrible Magnificent Sociology. You can follow her on Twitter and Instagram.

[Note: A couple of readers have sent in info that calls into question the graphic below — not the relative sizes and such, but the specific numbers cited for the size of various spills (making them look larger than other reports). This may be a reflection of how the organization defines “spilled” oil (they say “lost to the environment”), and I provide their definition below. Thanks to T for providing a list of generally accepted estimates of major spills. Given that the organization providing the data is an association of oil tanker owners, it seems unlikely that they would be intentionally exaggerating the sizes of spills for political purposes or something. So while the graphic’s illustration of the relative size of these spills is still accurate in a general sense, unless I can track down a clear explanation for the cited numbers, I wouldn’t rely on them. Sorry for the confusion, and I’ll continue updating if I can figure out what’s going on.]

———-

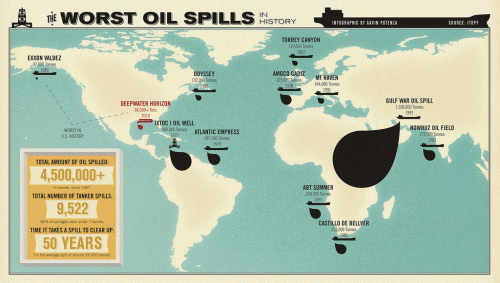
Allie B. sent in a graphic comparing the BP leak to major tanker oil spills (and I forgot to add the numbers reported are in tonnes, which is about 2,240 pounds each):

The info is based on data from The International Tanker Owners Pollution Federation Limited, an industry group that provides a lot of data on spills from oil tankers (so that doesn’t include leaks or spills from pipelines, wells, and so on). From the website:

It should be noted that the figures for the amount of oil spilt in an incident include all oil lost to the environment, including that which burnt or remained in a sunken vessel. There is considerable annual variation in both the incidence of oil spills and the amounts of oil lost. Consequently, the figures in the following tables, and any averages derived from them should be viewed with caution.

UPDATE: Commenter T points out that some of the numbers here (especially the Gulf War spill) don’t match up with more widely-reported data and seem to exaggerate the size of some of the spills. The relative sizes still hold up in general, but be cautious with the actual reported sizes of the spills. It may be that their way of defining spills (all oil “lost to the environment”) includes significantly more oil than what is traditionally counted as being part of a spill. I’m trying to track down exactly what’s going on here.

Given how much media coverage BP leak is getting, it’s a bit shocking to see it in comparison to the tanker spills represented here. That isn’t to say that somehow by comparison the BP leak isn’t that bad; rather, it made me aware of how little I usually hear about the environmental impacts of the global petroleum industry as long as they don’t happen along the U.S. coastline.

For instance, a recent NYT article discusses the impacts of oil leaks and spills in Nigeria:

The Niger Delta…has endured the equivalent of the Exxon Valdez spill every year for 50 years by some estimates. The oil pours out nearly every week, and some swamps are long since lifeless…leaving residents here astonished at the nonstop attention paid to the gusher half a world away in the Gulf of Mexico. It was only a few weeks ago, they say, that a burst pipe belonging to Royal Dutch Shell in the mangroves was finally shut after flowing for two months…

I think the illustration brings into perspective how our perceptions of environmental disasters are shaped (not surprisingly, I know) by the amount of media coverage it gets and whether it occurs in a place we’re familiar with. Some pollution gets national and international media attention (at least for a while), and some is largely ignored outside the local area directly affected. The BP leak is by no means the largest oil-related ecological disaster in history — not even close yet, and hopefully it won’t get there — but media coverage and clean-up efforts aren’t distributed equally. And, again, I’m not saying that somehow this means we shouldn’t be too concerned about the Gulf leak. But it does make clear that we’re not equally concerned about, say, all people whose livelihoods are devastated by petroleum leaks/spills in waterways.

And just out of curiosity about the link between U.S. oil consumption and Nigerian oil production, I went to the webpage of the U.S. Energy Information Administration to see how much oil the U.S. imports from Nigeria. It’s currently our 4th-largest source of crude imports, and our daily Nigerian imports are up quite a bit over a year ago (about 1.1 million barrels in April ’10 compared to 673,000 a day in April ’09):

And I’m a bit embarrassed to admit that I had no idea Canada is currently our biggest source of imported crude oil (and total petroleum imports as well).

Gwen Sharp is an associate professor of sociology at Nevada State College. You can follow her on Twitter at @gwensharpnv.

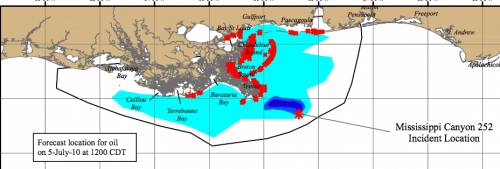
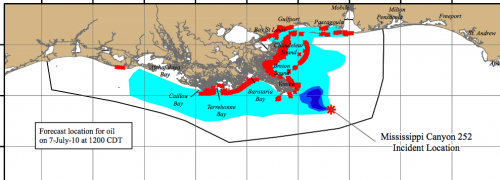
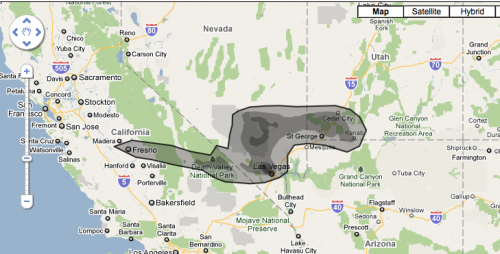
The website If It Was My Home (and yes, they know about the grammar error) allows you to get a better grasp on the size of the area affected by the BP oil leak.  They use National Oceanic and Atmospheric Administration’s daily updates on where the oil will reach in the next 24 hours and allow you to use Google Maps to position it anywhere you want. It’s easier for me, at least, to get an idea of the dimensions of the area we’re talking about when I can imagine it on an area I’m familiar with than seeing it on a map of the ocean.

Here’s the oil leak area centered over Las Vegas, where I live:

The darker the shade of gray, the denser the oil. Here is the current NOAA surface oil projection for the next 24 hours; red indicates places oil may hit shores:

Today’s 72-hour projection, which shows the range extending qute a bit to the west, and more affected shoreline:

Thanks to Kate W. for the link!

Related posts: using the oil spill to advertise cheap flights, should we clean up oil-soaked wildlife?, the Gulf oil industry, BP buys Google search terms, BP gives Florida money for advertising tourism, protesting BP, and the power of images of environmental disasters.

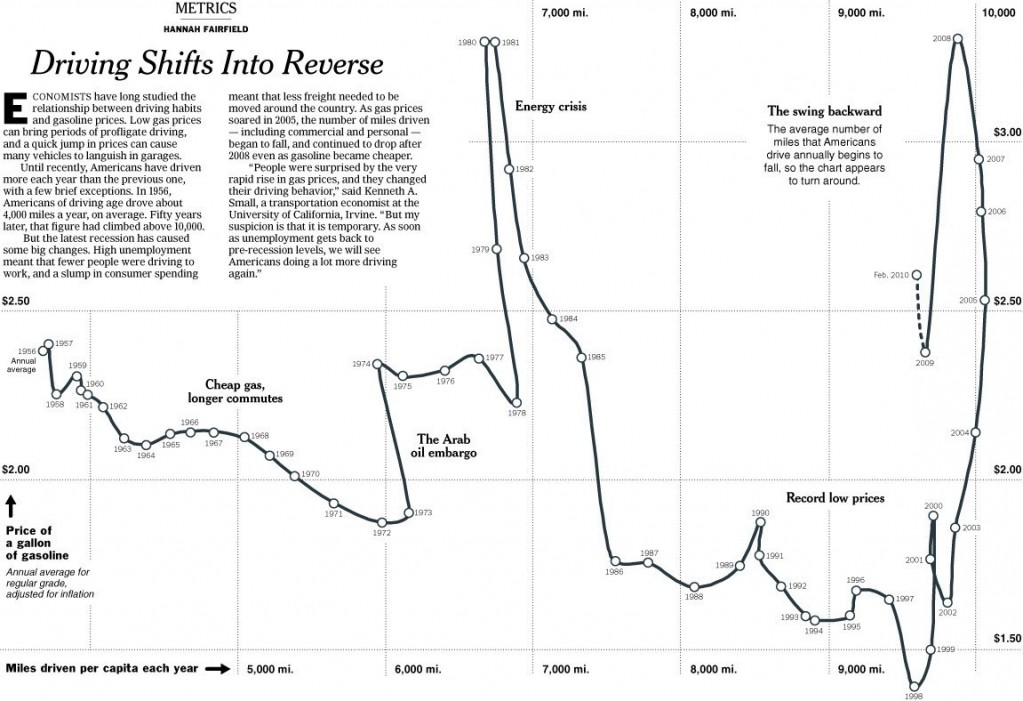
To me this New York Times graphic showing the relationship between gas prices and the average number of miles driven powerfully suggests that gas prices actually have little to do with how much driving Americans do.  The vertical axis is gas prices and the horizontal axis is the number of miles driven.  The line inside the figure is time.

Basically the illustration shows that the number of miles per year Americans drive has been climbing since 1956.  Despite short-term gas price fluctuations, something is driving us to drive more and more every year.

When gas prices do shoot up — such as during the oil embargo, the energy crisis, and the most recent peak — Americans show a  modest drop in driving, but it’s not a very large one and we recover rather quickly.  During the oil embargo, Americans shaved 210 miles a year off of their driving.  During the energy crisis, only 156.  The recent reduction in the number of miles driven per year is attributed by the New York Times writer to the fact that so many people are unemployed and, therefore, no longer need to drive to work.

Driving, then, shows only a modest response to high prices.  Perhaps the jumps in prices during these peaks — 43 and 106 cents per gallon respectively —  weren’t really worth slowing down for?  Or perhaps driving is so culturally meaningful that Americans are willing to pay to stay in their cars regardless?  Or maybe driving, and driving farther, has become increasingly important over time such that people can’t reasonably reduce the amount of driving they do?

It seems to me that the problem is at least partly infrastructural.  I wonder how average miles driven responds, or would respond, to enhancing and investing in public transportation?  If we started building denser neighborhoods and got rid of suburbs?

Flowing Data.

Lisa Wade, PhD is an Associate Professor at Tulane University. She is the author of American Hookup, a book about college sexual culture; a textbook about gender; and a forthcoming introductory text: Terrible Magnificent Sociology. You can follow her on Twitter and Instagram.
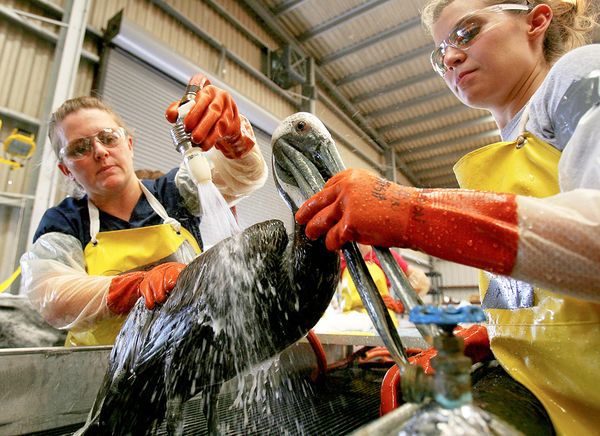
The image above, of a bird rescued from the gulf and cleaned of oil, may ease the ache in our hearts, but research suggests that euthanizing the birds would be more humane.

Environmental biologist and expert on oil clean-up, Silvia Gaus, explained that:

Catching and cleaning oil-soaked birds oftentimes leads to fatal amounts of stress for the animals… Furthermore, forcing the birds to ingest coal solutions — or Pepto Bismol, as animal-rescue workers are doing along the Gulf Coast — in an attempt to prevent the poisonous effects of the oil is ineffective… The birds will eventually perish anyway from kidney and liver damage (paraphrased at Speigel).

Further, birds who are relocated are often so disoriented that they die anyway, not able to re-establish survival routines in their new environment.

Gaus claims that 99% of the rescued and cleaned birds will die, usually within about seven days, and it will be a more painful death that takes longer than if they’d just been left alone.  As a consequence, many recommend quick and painless euthanization.  A National Geographic article complicates the story, reporting that survival rates depend on characteristics of the spill, but still reports that scientists largely have little hope that many birds rescued from the Gulf will survive.  A better strategy for saving birds, they say, is trying to keep them out of the oil in the first place.

If cleaning birds is unlikely to save them, and euthanizing them ultimately more humane, why are we cleaning birds?

The obvious answer is that it is good for BP’s public relations.  We feel better when we see the shiny oil-free feathers; those images make us feel like there is hope for the animals caught in the spill.  It makes it look as if BP is really doing something good.  In this case, why would BP care if the de-oiling worked?  They benefit whether the birds die (a slower, more painful) death or not.  It costs about $700 to clean an oiled pelican, but that may be money well spent.

There may be an even more nefarious reason.  There are fines and penalties for killing wildlife that can be levied against corporations.  The Migratory Bird Treaty Act of 1918, for example, specifies that corporations can be fined up to $500,000 if responsible for the death of a brown pelican.  Perhaps if the bird dies after release, without direct evidence that its death was caused by oil ingestion (without an expensive autopsy), then BP will not be vulnerable to those fines.  Further, the total number of dead birds attributed to their spill be lower; those numbers, instead, will be in the column marked “saved.”

UPDATE: Jay Holcomb at the International Bird Rescue Research Center disagrees with Gaus and other pessimistic scientists.  (Thanks to Paul for the link.)  It may also be that techniques for cleaning the birds have improved over time.  So the 1% number is probably wrong, or at least needs to be qualified.  Still, I think BP’s interests still apply, but it’s overstating it to say that de-oiling is bad for birds.  Thanks to everyone in the comments who added contrasting information!

Lisa Wade, PhD is an Associate Professor at Tulane University. She is the author of American Hookup, a book about college sexual culture; a textbook about gender; and a forthcoming introductory text: Terrible Magnificent Sociology. You can follow her on Twitter and Instagram.

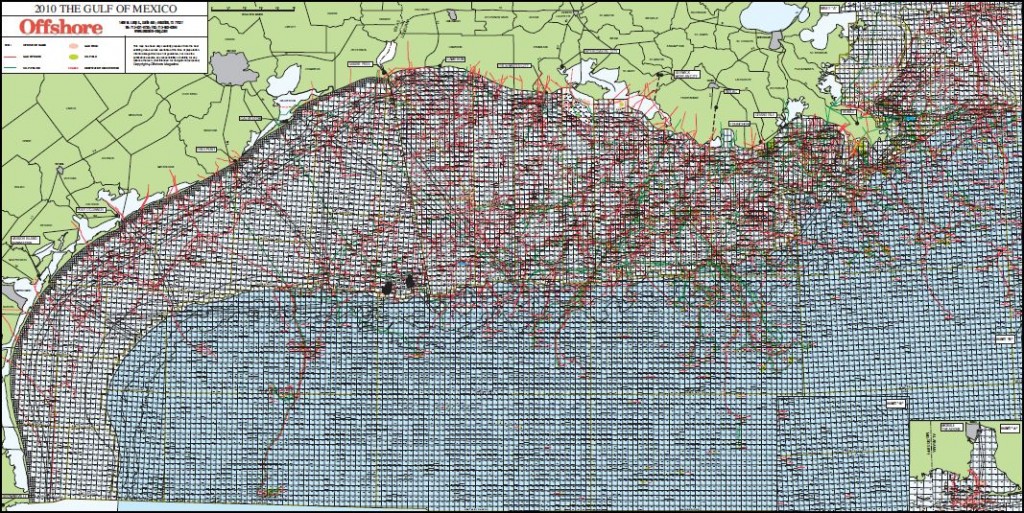
While most people look at the Gulf of Mexico and see seafood and beaches, oil executives see the Gulf differently.  They see a giant grid containing thousands of squares of possibility, each potentially yielding billions of dollars.

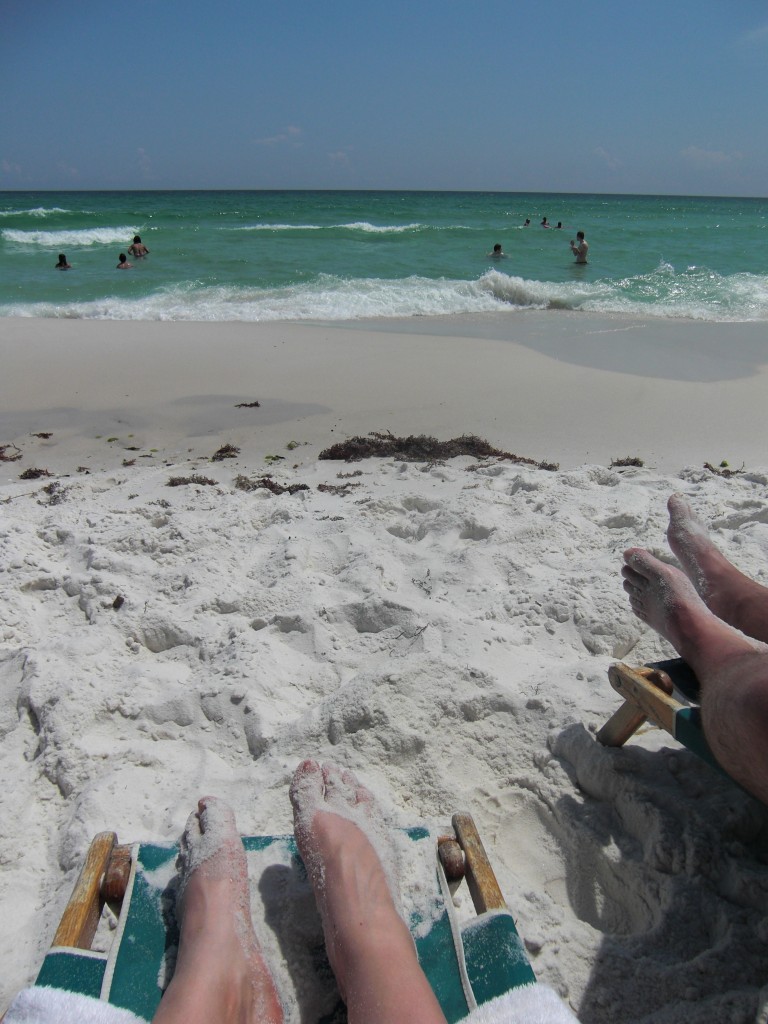
You see this:

(photo credit: Dmitriy Pritykin)

They see this, a grid of the entire gulf representing regions available for lease (click to enlarge):

(source)

This is a close up off the Louisiana coast (green lines and regions are oil pipelines and fields, the pink are the same for gas):

(source)

There are 6,652 leased squares, amounting to 22 percent of the lease-able Gulf (click to enlarge) and approximately 4,000 oil production platforms in the Gulf:

(source)

I offer this only as an illustration of the degree to which the Gulf has been commodified.  The Gulf is big, big, big business:

(source)

Lisa Wade, PhD is an Associate Professor at Tulane University. She is the author of American Hookup, a book about college sexual culture; a textbook about gender; and a forthcoming introductory text: Terrible Magnificent Sociology. You can follow her on Twitter and Instagram.
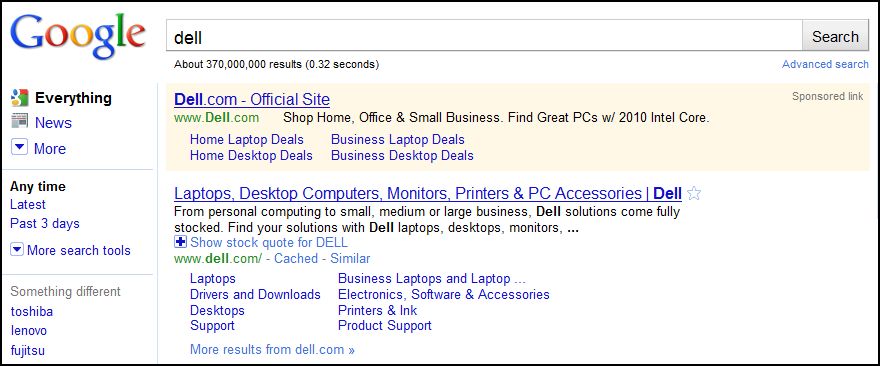
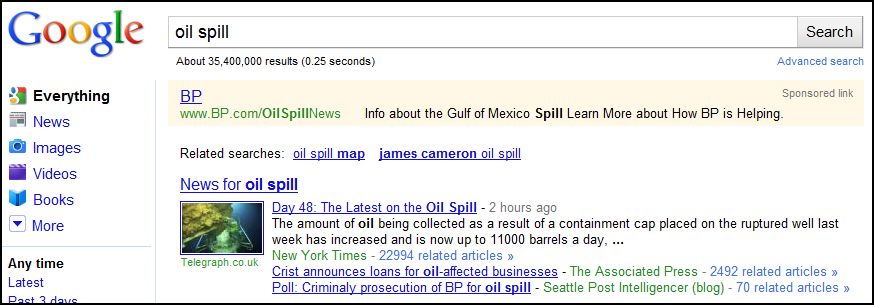
Google searches are (as far as I know) purely a function of their algorithm.*  A company, for example, is not supposed to be able to pay Google to increase its rank in the results.  Google does, however, sell something on its search results page.  If a company buys a search term, when a person searches for that term, Google will place a “sponsored link” at the top of its results page that is discreetly identified as advertising.  See the upper right corner of the very gently shaded link that appears at the top of search results for the word “dell.”  This is advertising purchased by Dell computers:

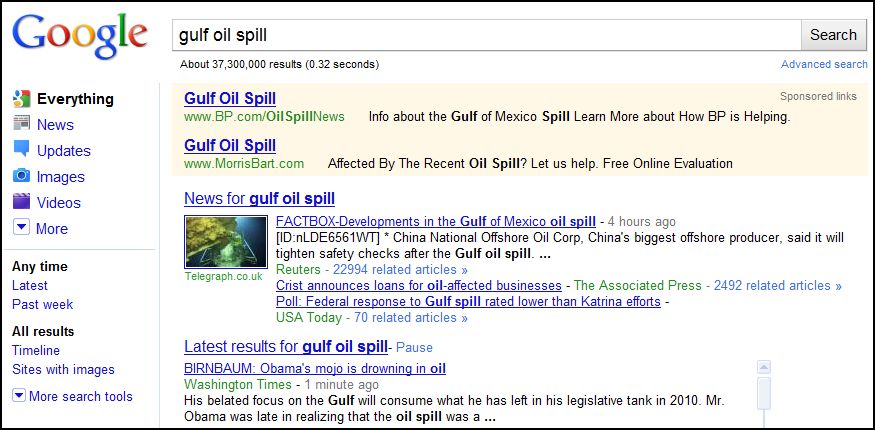
Keith Marsalek at nola.com alerted me to the fact that British Petroleum (BP) has bought a bunch of search terms and phrases such that, when one searches for information about the oil spill, the first thing that comes up is BP’s public relations website (selection below).  They are hoping that internet users, whether they recognize that BP has bought the top slot or not, will read their version of events and, perhaps, only their version of events.

Read nola.com’s oil spill page instead.

UPDATE: To clarify, I’m not suggesting that this is surprising or that BP is uniquely evil in doing this.  I’m simply pointing out that money buys the power to shape the distribution of information.  Many of you have commented that “sponsored links” are ads and just skip right over them.  But others might not.  The link and the shading is very subtle.  Even if a person sees the phrase “sponsored link,” they might interpret it to mean that Google thinks it’s a good link, one they sponsored.  Not everyone is a sophisticated consumer of the internet.  And, even if they know it’s an ad, not everyone is as suspicious of ads, nor of companies, as some.  So I think buying the ad will, in fact, make it so that more people will be exposed to BP’s version than otherwise.  And that’s all I was trying to say.  It’s just a simple example of the relationship between power and knowledge.

* I know there is plenty of controversy over there algorithm as well.  Feel free to discuss that in the comments.

—————————

Lisa Wade is a professor of sociology at Occidental College. You can follow her on Twitter and Facebook.

Photographs have played a major role in framing the environmental movement, and groups have used images to draw public attention and concern to specific issues. A famous example is the “Earthrise” image taken in 1968 from Apollo 8, the first time an image of this sort was taken by an actual person, rather than a satellite. The seeming fragility of the planet, clearly shown as an interconnected and isolated entity, has been largely credited with increasing concerns about and awareness of environmental issues:

Life magazine included it in a list of “100 photographs that changed the world.”

On June 22, 1969, the Cuyahoga River in Ohio caught on fire. News spread, and the story — the shock many Americans experienced when they heard that rivers were catching on fire — increased concerns about water pollution, eventually leading to the 1972 Clean Water Act. Dramatic photos of the Cuyahoga burning appeared.

There was one small detail with the images that often went unnoticed: as far as anyone can tell, no one took any photos of the river burning in 1969. If you look online now, you’ll find lots of images from a fire in 1952, but none from 1969. At the time, rivers catching on fire in the former industrial centers around the Great Lakes weren’t really shocking; it happened pretty frequently and had been for decades. The 1969 fire was, if anything, unexceptional. It only lasted half an hour and didn’t do much damage.

Of course, context and timing are everything. The story about the 1969 fire emerged at a time when concerns about environmental pollution and safety were increasing, so an event that might have been completely ignored outside the local area, as they had been in the past, instead became a flashpoint in the environmental movement, and images of rivers on fire now seem shocking to us. I think most Americans would see a river catching on fire as inherently problematic, an automatic sign of a major environmental problem, rather than an unavoidable and unremarkable outcome of economic progress.

Given the force of images in these instances (and others), I can’t help but wonder what the effects will be of photos of the current oil spill in the Gulf of Mexico, particularly as it approaches the coasts. Dmitriy T.M. sent in a set of images. The oil spill, and the images we’ll continue to get of it, come soon after President Obama announced his support for offshore drilling in a number of areas, including the Atlantic coast and the Gulf of Mexico. The plan, already controversial, is likely to meet even more resistance now, particularly from residents in communities that are not dependent on oil drilling for their livelihoods and fear the effects of an oil spill. Public concern is likely to increase even further when the oil hits coastal areas and we begin to see images of oil-covered wildlife, beaches, and so on, much as we did after the Exxon Valdez spill.

These images are already striking, but the power of an image is highly connected to the social/historical context in which is arises (much as photos of rivers on fire didn’t cause a huge national stir until they became emblematic of the need for environmental regulations). I can’t help but think that the last photo I posted above will have more resonance than it might have otherwise because of the way it will intersect with memories of Hurricane Katrina bearing down on New Orleans — I suspect that a story that would be attention-getting regardless will be even more so now that it will connect to ideas of New Orleans as a beleaguered city, endangered by a string of natural and human-caused disasters.

——————————-

See also our post on how photographs of the fetus changed how we think about pregnancy and abortion and, for an interesting controversy regarding photography, see our post on Shelby Lee Adam’s images of Appalacians.

Gwen Sharp is an associate professor of sociology at Nevada State College. You can follow her on Twitter at @gwensharpnv.