health/medicine: drugs

Cross-posted at Family Inequality.

Poverty is usually described as a status, as there are people below and above the poverty line. We need to do more to capture and represent the experience of poverty.

There are ways this can be done even in a single survey question, such as this one: ”During the past 12 months, was there any time when you needed prescription medicine but didn’t get it because you couldn’t afford it?” Below are the percentages answering affirmatively, by official poverty-line status.

Percentage of Adults Aged 18-64 Who Did Not Get Needed Prescription Drugs Because of Cost, by Poverty Status (National Health Interview Survey, 1999-2010)
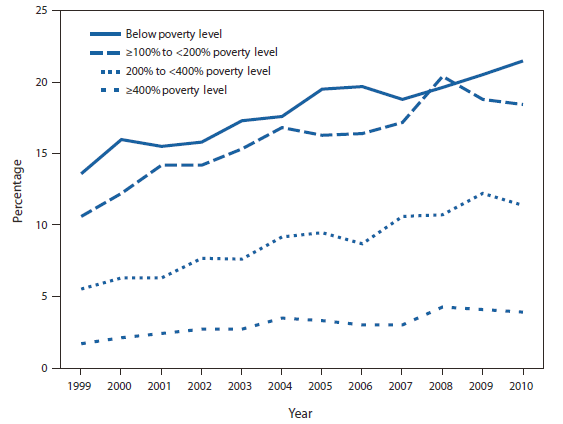
This is not the same as not having any of the prescription drugs you need. What it indicates is economic insecurity rather than deprivation per se, a more nuanced measure than simply being above or below (some percentage of) the poverty line.

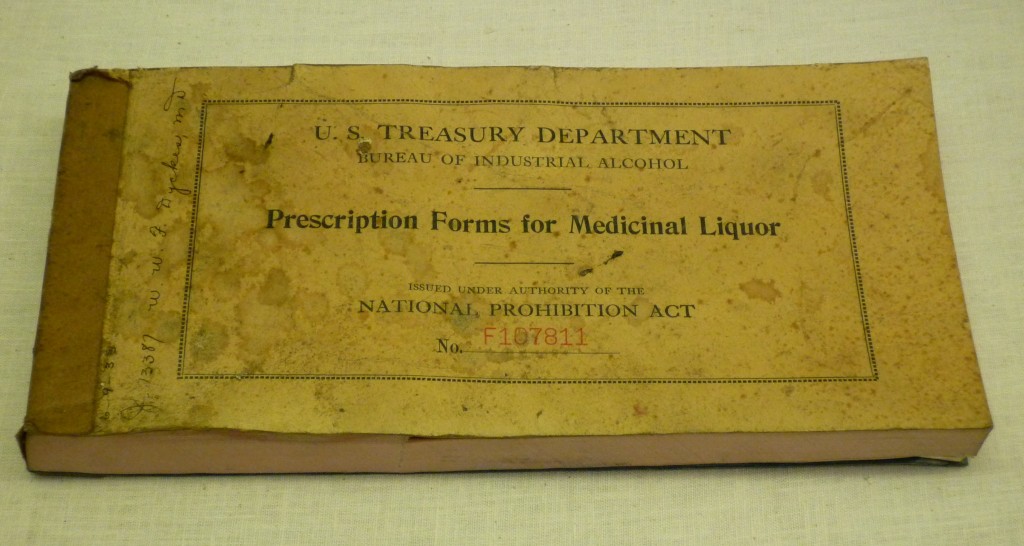
In 1919 the U.S. federal government passed the 18th Amendment, prohibiting the “manufacture, sale, or transportation of intoxicating liquors.”  Alcohol was banned. Well, kind of.  Two groups were still allowed to buy and disseminate alcohol: clergy and physicians (source).

Clergy were still allowed to purchase wine for sacrament (reportedly leading to many a falsely-devotional newly-certified minister, priest, or rabbi illegally selling bucket loads of liquor to the rest of us). And physicians were allowed to prescribe liquor for medicinal purposes. Alcohol, it was believed, was energizing and it was used to treat anemia, tuberculosis, typhoid, pneumonia, and high blood pressure. Pharmacies did a booming business in those years, as you might imagine.

According to the Rose Melnick Medical Museum:

This new law required physicians to obtain a special permit from the prohibition commissioner in order to write prescriptions for liquor.The patient could then legally buy liquor from the pharmacy or the physician. However, the law also regulated how much liquor could be prescribed to each patient.

Patients of all ages used alcohol. A common adult dose was about 1 ounce every 2-3 hours. Child doses ranged from 1/2 to 2 teaspoons every three hours.

Physicians prescribed their “medicine” with prescription pads doled out by the commissioner:

Unfortunately for some, you couldn’t prescribe beer.

Even after Prohibition was lifted in 1933, pharmacies sold plenty of liquor.  In many places women were banned from bars and saloons, so while men visited the bartender, women visited the doctor.  Visit our post on The Stormin’ of the Sazerac to see a great vintage picture of a group of women enjoying the famous cocktail on the first day they were allowed to drink at The Roosevelt Bar, New Orleans.

Lisa Wade, PhD is an Associate Professor at Tulane University. She is the author of American Hookup, a book about college sexual culture; a textbook about gender; and a forthcoming introductory text: Terrible Magnificent Sociology. You can follow her on Twitter and Instagram.

In the late 1800s, one suffering from impotence, addiction to morphine, or belly aches might be prescribed John Pemberton’s French Wine of Coca.   The wine concoction contained caffeine and 8 1/2 milligrams of cocaine (equivalent to snorting about 1/2 line).

(source)

(source)

Prohibition’s arrival in Atlanta in 1886 led Pemberton to re-write his recipe to exclude the alcohol.  Pemberton advertised it as the “great national temperance beverage.”  In 1903, when cocaine was outlawed, Pemberton had to rework his recipe again.  Coca Cola, as we know it, was born.

See The Digital Deli Online for more.

Lisa Wade, PhD is an Associate Professor at Tulane University. She is the author of American Hookup, a book about college sexual culture; a textbook about gender; and a forthcoming introductory text: Terrible Magnificent Sociology. You can follow her on Twitter and Instagram.

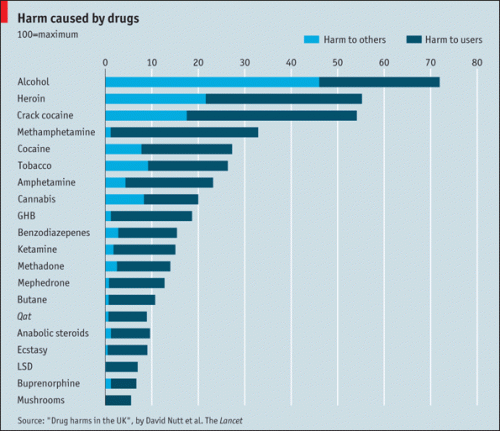
Katelyn G. sent in a link to a story at The Economist about a new study that attempted to measure the harmful effects, to both the user and to the U.K. more broadly, of a number of legal and illegal drugs. The methodology:

Members of the Independent Scientific Committee on Drugs, including two invited specialists, met in a 1-day interactive workshop to score 20 drugs on 16 criteria: nine related to the harms that a drug produces in the individual and seven to the harms to others. Drugs were scored out of 100 points, and the criteria were weighted to indicate their relative importance.

Harm to others included factors such as health care costs, family disruptions, social services, and the cost of criminal justice programs to regulate drugs.

The results? Alcohol outranked all illegal substances they considered by a significant margin, particularly in terms of the harm caused to others:

Will this lead to major changes in drug policy in the U.K.? Unlikely. Here’s a tidbit from an NPR story:

…last year in Britain, the government increased its penalties for the possession of marijuana. One of its senior advisers, David Nutt — the lead author on the Lancet study — was fired after he criticized the British decision.

“What governments decide is illegal is not always based on science,” said van den Brink. He said considerations about revenue and taxation, like those garnered from the alcohol and tobacco industries, may influence decisions about which substances to regulate or outlaw.

Today Californians vote as to whether to legalize marijuana.  Chris Uggen at Public Criminology explains:

This measure (1) legalizes various marijuana-related activities, (2) allows local governments to regulate these activities, (3) permits local governments to impose and collect marijuana-related fees and taxes, and (4) authorizes various criminal and civil penalties.

There is a chance that the measure will pass; Gallup polls of U.S. opinion show that support for legalization has grown over time:

What will happen if California becomes the first state to legalize marijuana is the stuff of speculation or, more generously, modeling.  Uggen points to the work of scholars employed at the RAND Drug Policy Research Center (Beau Kilmer, Jonathan P. Caulkins, Rosalie Liccardo Pacula, Robert J. MacCoun, and Peter H. Reuter).  According to their models:

(1) the pretax retail price of marijuana will substantially decline, likely by more than 80 percent. The price the consumers face will depend heavily on taxes, the structure of the regulatory regime, and how taxes and regulations are enforced;

(2) consumption will increase, but it is unclear how much, because we know neither the shape of the demand curve nor the level of tax evasion (which reduces revenues and prices that consumers face);

(3) tax revenues could be dramatically lower or higher than the $1.4 billion estimate provided by the California Board of Equalization (BOE); for example, uncertainty about the federal response to California legalization can swing estimates in either direction;

(4) previous studies find that the annual costs of enforcing marijuana laws in California range from around $200 million to nearly $1.9 billion; our estimates show that the costs are probably less than $300 million; and

(5) there is considerable uncertainty about the impact of legalizing marijuana in California on public budgets and consumption, with even minor changes in assumptions leading to major differences in outcomes.

In other words, it’s really hard to tell what the consequences of legalizing marijuana will be!  Uggen urges caution.

Lisa Wade, PhD is an Associate Professor at Tulane University. She is the author of American Hookup, a book about college sexual culture; a textbook about gender; and a forthcoming introductory text: Terrible Magnificent Sociology. You can follow her on Twitter and Instagram.

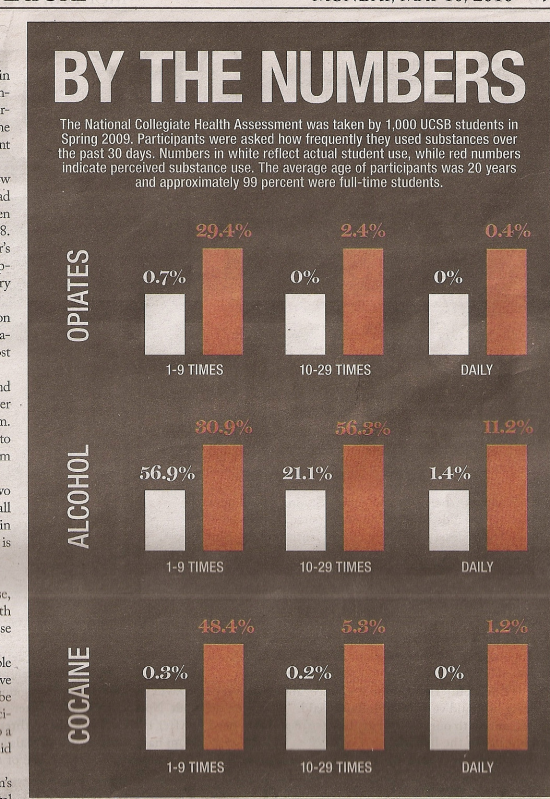
The phrase “pluralistic ignorance” refers to a situation where a large proportion of a population misunderstands reality.  They may all agree, but they are, nonetheless, mistaken.  This data on University of California-Santa Barbara students from the National Collegiate Health Assessment is a great illustration of this idea; it’s also a great illustration, however, of a terrible, terrible illustration.

Let’s get past the bad graphic first.  The white bars (which represent the percent of people reporting that they themselves used opiates, alcohol, or cocaine) are all the same height, despite the fact, for example, that 56.9% of students reported using alcohol 1-9 times in the last month, but only 0.3% reported using cocaine.  So the bars do not actually represent the percentages they are supposed to.  The red bars (which represent the percent of people that respondents think are using drugs and alcohol) suffer from the same problem.  In one case, the white bar should be even higher than the red bar.

But, if we can get past the poor graphic, then the information is really interesting.  In all but one case, the number of people reporting drug and alcohol use is smaller than the perceptions of how many people are using these substances.  For example, looking at the middle column, (almost) no one reports using opiates or cocaine 10-29 times last month, but students perceive  that 2.4% and 5.3% of the population (respectively) are; similarly, 21.1% of students report drinking alcohol 10-29 times last month, but they perceive that over half the population is drinking that frequently.

This pattern is consistently true in all cases except for the percentage of people who drank alcohol 1-9 times in the last month.  The majority of respondents who drink reported that they did so at that rate, but they perceive that others are drinking far more than they are.  The overall impact of the illustration, then, is correct.  On the whole, students perceive more drug and alcohol use than they report.

It’s possible that people are underreporting and their perceptions are more true than the self-reports.  If their self-reports are more true, however, than we have a case of pluralistic ignorance.  In this case, students agree that the rate of drug and alcohol use is higher than it actually is.  They may, then, feel pressure to drink and do drugs more frequently to fit in, even as doing so results in just the opposite.

Eager Eyes, via Flowing Data.

—————————

Lisa Wade is a professor of sociology at Occidental College. You can follow her on Twitter and Facebook.

This 4-minute 20-second video, by Colorlines, uses true stories to illustrate the impact of a 1996 law that authorizes the (sometimes retroactive) deportation of non-citizens convicted of any crime, including misdemeanors and traffic violations.  In 2008, the video reports, the U.S. government deported almost 360,000 people on these grounds.

Via Racewire.

Lisa Wade, PhD is an Associate Professor at Tulane University. She is the author of American Hookup, a book about college sexual culture; a textbook about gender; and a forthcoming introductory text: Terrible Magnificent Sociology. You can follow her on Twitter and Instagram.

Katrin sent along links to visual portrayals of how much money goes, or could go, to various causes.  While sometimes it’s hard to comprehend what a billion, or 300 billion, dollars amounts to, these images give us perspective on just where our priorities lie.  The segments below are clipped from the visuals for the U.K. and the U.S. at Information is Beautiful.

The British example nicely illustrates how little social services like education, police, and welfare cost in the big scheme of things.

It also reveals how easy it would be to wave all of the African countries’ debt to Western countries. Just £128 spread out over the West.  Shoot, that’s the money for just a couple of corporate bailouts.

The U.S. example reveals how costly (just) the Iraq war has been.  All of our spending pales in comparison to that expenditure., with the exception of what we have spent bailing out the U.S. economy.

It also reveals that the U.S.’s regular defense budget is almot enough to feed and educate every child on earth for five years, and/or about the same as the revenues of Walmart and Nintendo combined.

If we diverted the money spent on porn, we could save the Amazon… almost five times over.  For that matter, if we gave our yoga money to the Amazon, that would just about do it.

Bill Gates could have paid for the Beijing Olympics and had money left over.

Dmitriy T.M. sent in an interactive breakdown of the US Budget for 2011.  In the figures below, the sizes of the squares represent the proportion of the budget, but the colors refer to changes from 2010 (dark and light pink = less funding, dark and light green = more).  These figures will give you an idea, but the graphic is interactive and there’s lots more to learn at the site.

See also our posts on how many starving children could be fed by celebrity’s engagement rings and where U.S. tax dollars go.

Lisa Wade, PhD is an Associate Professor at Tulane University. She is the author of American Hookup, a book about college sexual culture; a textbook about gender; and a forthcoming introductory text: Terrible Magnificent Sociology. You can follow her on Twitter and Instagram.