crime/law

Wired has posted a set of photos by Richard Ross highlighting the  harsh reality of life in juvenile detention centers  — locations where about 60,000 kids reside each night throughout the U.S. According to the article,

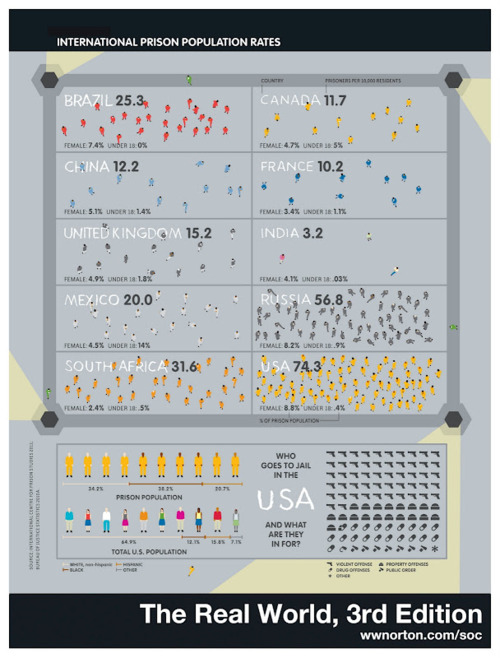
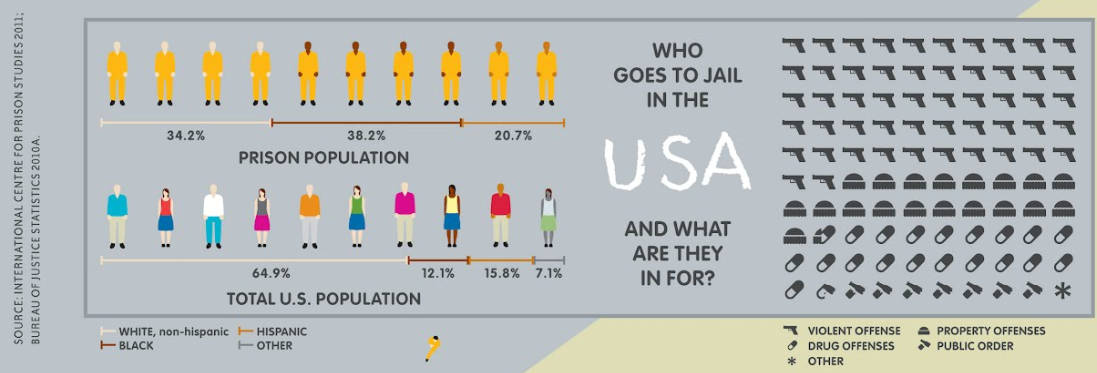
The U.S. locks up children at more than six times the rate of all other developed nations. The over 60,000 average daily juvenile lockups, a figure estimated by the Annie E. Casey Foundation (AECF), are also disproportionately young people of color. With an average cost of $80,000 per year to lock up a child, the U.S. spends more than $5 billion annually on youth detention.


The images are at Wired, and you can read more about the project, Juvenile-in-Justice, including a schedule of shows, at Ross’s website. His photos also appear in the Annie E. Casey Foundation report No Place for Kids.

You might also want to check out our previous posts on treatment of prisoners during Hurricane Katrina and overcrowding in California prisons.

And thanks to Karl for the tip about the article!

Gwen Sharp is an associate professor of sociology at Nevada State College. You can follow her on Twitter at @gwensharpnv.

Norton Sociology recently posted an image that illustrate differences in rates of imprisonment in a number of countries. Imprisonment rates are influenced by a number of factors — what is made illegal, how intense law enforcement efforts are, preference for prison time over other options, etc. The U.S. does not compare favorably, with 74.3 per 100,000 10,000 of our population behind bars (click here for a version you can zoom in on, and sorry for the earlier typo!):

Here’s a close-up of the breakdown of the U.S. prison population:

Via Urban Demographics.

A little over a month ago I posted a map of the legal status of same-sex marriage throughout the U.S. It was soon made obsolete by the legalization of same-sex marriage in the state of Washington. In addition, several readers pointed out that the map hid important differences within categories.

Ned Flaherty, Project Manager of Marriage Equality USA, sent in a link to an updated and more comprehensive map at their site. Green states have fully legalized same-sex marriage; yellow states recognize domestic partnerships or civil unions; and pink states do not allow either. The lettered codes provide more information on exactly what the status is in each state:

Click on the map or go to their website to look at the much larger version; they also have a round-up of pending or possible legislation and court cases in various states.

Cross-posted at Family Inequality.

The Carsey Institute’s Kristin Smith has written a brief on the plight of home care workers — the home health aides and personal care aides that play a growing role in our patchwork network of care work.

The news now is that these workers are not covered by the Fair Labor Standards Act — which offers the protection of minimum wage and overtime pay — but the U.S. Labor Department has proposed to bring them under its aegis.

According to the Department of Labor:

Many of these workers are the primary breadwinners for their families. Of the roughly 2 million workers who will be affected by this rule, more than 92 percent are women, nearly 50 percent are minorities, and nearly 40 percent rely on public benefits such as Medicaid and food stamps. According to the Bureau of Labor Statistics, home health care aides earn about $21,000 a year and many lack health insurance.

Smith’s analysis uses 2011 federal data. She shows that home care workers are more likely to work overtime, and more likely to work part time, than direct care workers in hospitals and nursing homes:

And they are more likely to be working part time for involuntary reasons:

Finally, their median wages — and the wages of those in the bottom quartile of the occupation — are lower than those of hospital and nursing home workers:

As Nancy Folbre as explained, the economics are bad here. Besides the bad hours, bad pay, bad working conditions, lack of unions and lack of state protections, there are some structural problems. Paid home health care is competing with unpaid family care. That means the decision about whether to pay for professional care weighs against the value of a (usually female) family member’s unpaid work. That drives down the cost of home health care — which means more than a million women get lower wages, and women’s work is devalued. And so on. Breaking that cycle requires either a wage increase (sadly, that includes bringing them under the minimum wage law) or government subsidies.*

——————————

*One attempt to beat these economic odds and support long-term care, the Community Living Assistance Services and Supports Act (CLASS Act), was supposed to be a premium-based long-term care support program, and it was passed as part of Obamacare. However, with the rule that it be self-funding, and solvent, while paying a cash benefit for life to eligible beneficiaries, theadministration said it couldn’t be done after all. Actually paying for care isn’t cheap.

Philip N. Cohen is a professor of sociology at the University of Maryland, College Park, and writes the blog Family Inequality. You can follow him on Twitter or Facebook.

London filmmaker Michael Story sent in a short video he made about the mismatch between crime as presented in TV reports and the reality of crime in the UK. TV reports, Michael argues, misrepresent how common crime is, where it occurs, and who is most likely to be involved in violent crime; in so doing, they reinforce stereotypes about race, ethnicity, class, and criminality:

London’s 66,000 guns – by Michael Story from chichard41 on Vimeo.

The New York Times recently ran an  interesting story on prison cemeteries in Texas.  For about $2,000, the state buries about 100 inmates a year. They die of lethal injection, old age, or illness, but they’re all dressed in dark pants, a white shirt, and tie, and are buried with a prayer from the prison chaplain.

When inmates die in custody, their bodies are sometimes unclaimed.  This may be because they have no family at all, or their family members don’t wish to claim the body.   Other times the inmate is cared for by family members who simply can’t afford to bury the person themselves.  So, occasionally the family members will decline to claim the body, but show up on the day of the burial to pay their respects.

Lisa Wade, PhD is an Associate Professor at Tulane University. She is the author of American Hookup, a book about college sexual culture; a textbook about gender; and a forthcoming introductory text: Terrible Magnificent Sociology. You can follow her on Twitter and Instagram.

Cross-posted at Montclair SocioBlog.

It can take a while to find the right word.  But a mot juste may be crucial for framing a political issue. If you like the idea of men being able to marry men, and women women, what should you call the new laws that would allow that?

The trouble with “gay marriage” and even “same-sex marriage” is that these terms suggest – especially to conservatives – some kind of special treatment for the minority.  It’s as though gays are getting a marriage law just for them.

At last, the gay marriage forces seem to have come up with a term that invokes not special treatment but a widely-held American value that’s for everyone – equality.  A bill in  New Jersey has been in the news this week, mostly because Gov. Christie says he will veto it.  The bill is a “marriage equality” law.

The governor is in a bit of a squeeze.  As a Republican with ambitions beyond New Jersey’s borders, he can’t very well be for gay marriage.  But if his opponents can frame the matter their way, he now has to come out against equality.  Which is why the governor continues to refer to the issue as “same-sex marriage.”*

It’s like “abortion rights” or even “women’s rights.” A phrase like that might rally women to your cause, but if you want broader support, you need a flag that every American can salute.  I’m not familiar with the history of abortion rights so I don’t know how it happened, but those who want to keep abortion legal have managed to frame the issue as one of freedom to choose.   They have been so successful that the media routinely refer to their side as “pro-choice.”   To oppose them is to oppose both freedom and individual choice, principles which occupy a high place in the pantheon of American values.

It’s not clear that the “marriage equality” movement has been similarly successful, at least not yet.  I did a quick Lexis-Nexis search sampling the last week of the months January and July going back to 2007.  I looked for three terms: “same-sex marriage,” “gay marriage,” and “marriage equality.”

The general trend for all three is upwards as more legislatures consider bills, with big jumps when a vote becomes big news – that blip in July 2011 is the New York State vote.  But the graph can’t quite show how “marriage equality” has risen from obscurity.  That first data point, July 2007, is a 4.  Four mentions of “marriage equality” while the other terms had 25 and 50 times that many.  As of last week, “gay” and “same sex” still outnumber “equality,” but the score is not nearly so lopsided.

Here is a graph of the ratio of “equality” to each of the other two terms.  From nearly 1 : 20 (one “marriage equality” for every 20 “gay marriages”) the ratio has increased to 1 : 3 and even higher when the discussion gets active.

If the movement is successful, that upward trend should continue.  When you hear Fox News referring to “marriage equality laws,” you’ll know it’s game over.

———————————

* Christie is usually politically adept, but he’s stumbling on this one.  He referred to a gay legislator as “numb nuts” (literally, that might not necessarily be a liability for a politician caught in a squeeze).   Christie also said that he’s vetoing the bill so that the matter can be put on the ballot as a referendum – you know, like what should have happened with civil rights in the South.  

I think people would have been happy to have a referendum on civil rights rather than fighting and dying in the streets in the South.

Several critics, including Numb Nuts, responded that, yes, Southern whites would have been happy to have civil rights left up to the majority.  African Americans not so much.  (If you’re looking for an illustration of Tocqueville’s “tyranny of the majority,” the post-Reconstruction South might be a good place to start.)  The analogy is obvious – race : 1962 :: sexual orientation : 2012 – even if it was not the message the governor intended.

The New York Times recently reported the results of a study of racial disparities in bankruptcy filings. When filing personal bankruptcy, most people have two options: Chapter 7 and Chapter 13. With Chapter 7, you have to turn over all non-exempt assets, which will be used to pay off as much of your debts as possible; you’re then free from any further obligation regarding the debts included in the case. Under Chapter 13, on the other hand, you have to continue to try to pay your debts for 3-5 years. There are reasons a person might sometimes prefer Chapter 13 (especially if they have particularly valuable assets they do not want to turn over), but generally it’s more expensive to file for and, obviously, provides less financial relief from debts. According to Braucher et al. (2012), the authors of the study, overall about 30% of personal bankruptcies are filed under Chapter 13.

But in their study, Braucher et al. found that African Americans were significantly more likely to file for Chapter 13, and more likely than they would expect when controlling for things that might make Chapter 13 more attractive. As this NYT chart shows, over half of African Americans file under Chapter 13, compared to just over a quarter for Whites and even less for other groups:

Rates of Chapter 13 filings vary quite a bit across different judicial districts, but African Americans consistently filed Chapter 13 at a higher rate than other groups, regardless of what the overall rate was:

Braucher et al. suggest that attorneys play a key role here. They sent surveys to 596 randomly-selected attorneys who represent individuals filing for bankruptcy, providing information about a married couple considering bankruptcy; 262 of the attorneys responded. When the potential filers gave the names Reggie and Latisha, attorneys were more likely to recommend Chapter 13 than when they gave the names Todd and Allison, suggesting that attorneys may play a role in tracking clients toward different bankruptcy options based on race.

The result is that African Americans are, overall, more likely to use the version of personal bankruptcy that costs them more and requires them to continue struggling to pay their debts for several more years, reducing the immediate relief most people assume bankruptcy provides.

Source: Braucher, Jean, Dov Cohen, and Robert Lawless. 2012. Race, Attorney Influence, and Bankruptcy Chapter Choice. Forthcoming in the Journal of Empirical Legal Studies. Available free online here.

Gwen Sharp is an associate professor of sociology at Nevada State College. You can follow her on Twitter at @gwensharpnv.