class

Cross-posted at Organizations, Occupations and Work.

Last week the Wall Street Journal printed an article describing how CEOs around the world spend their time.  The article drew on data from a larger study, the Executive Time Use Project , and relied on reports of time use by CEO’s personal assistants.  The article indicates that assistants only tracked activities that lasted over 10 minutes in a single week selected by researchers.  That assistants, rather than the CEOs themselves, were keeping track of time use leads me to believe the reports are relatively accurate.  After all, the assistant probably does most of the scheduling of a CEOs day and CEOs are likely too busy to track data time or to agree to record their time use.

Here’s the break-down of the typical 55-hour work week for CEOs:

The hype about the findings is about the finding regarding time spent in meetings — 18 hours per week (see “Where’s the Boss? Trapped in a Meeting”).  I’m more interested in the task that occupies the greatest amount of a CEO’s time in a typical week—the 20 hours of “miscellaneous” activities.  The fine print indicates that the “miscellaneous” activities include time spent travelling, in personal activity including exercise or lunch with a spouse, or in short activities like quick, unscheduled phone calls.

The project website advertises that knowing how CEOs spend their time can tell a lot about management style and differences in cultures and performances.  Maybe it can, and here arearticles that tackle these issues.  I think it tells us something slightly different and far more basic than this: what constitutes “work” depends on who does it.  Would a study of low wage workers calculate as part of the work week “exercise”?  Do we count travel time to and from a job as “work” among mid-level managers?  The BLS American Time Use Surveys (Table 5, see footnote 2) do not include travel related to work in measures of work time. Why did the authors include as part of a CEO workday things like personal time and activities unrelated to work?

Without this personal time, a CEO’s average work week—35 hours—looks closer or shorter than other workers.   For example, among employed people who worked on an average weekday in 2010, the average weekly hours spent working at all jobs (excluding travel related to work), for workers with a H.S. diploma was 40.05 hours, for women who worked full-time, the average was 40.80 hours, for all full-time workers, the average weekly work hours was 41.95 hours (to calculate these weekly averages from the BLS, I assumed people worked 5 days a week which is typical for full-time workers, but may overestimate the work hours of those with a H.S. diploma).

Perhaps it is time to re-evaluate how we measure “work” or at least pay close attention to the ways we do so differently for workers at different levels of the hierarchy.  Now I’m headed to the gym for some exercise.  Should I all that “work”?  I’ll leave it to you to decide.

—————————

Julie Kmec is an associate professor of sociology at Washington State University.  She has conducted research on organizations and work, in particular on issues of gender and race inequality at work, the glass ceiling, employment discrimination, and sex segregation.  She is part of a working group at the Clayman Institute for Gender Research at Stanford University investigating ways to redefine work.

The Paris School of Economics has posted a database, compiled by Facundo Alvaredo, Tony Atkinson, Thomas Piketty, and Emmanuel Saez, of the distribution of top incomes in a number of nations, with more on the way. Using income tax records, they provide a quick glance at concentration of income among the wealthy over decades (and in some cases, data extends back over a century). As the authors point out, there are limitations to using tax info to measure inequality, so it’s important to be aware of the limitations of this data series. Most obviously, individuals may take steps to hide their income to evade taxes, and the very wealthy may be particularly able to do so through the use of tax havens, etc. Also, tax policies change, so what counts as “income” at one point might not at another. The authors also had to contend with differences in the taxation unit (households vs. individuals) in different countries to provide some level of comparability.

The database allows you to select a country, a time period, and a variable (top 5% income share, etc.), and get a table showing the results for all years in which data were available. Here, for instance, is part of the table for the share of income earned by the top 1% in Singapore:

Of course, this includes only data on income. In many countries, including the U.S., wealth (value of all assets) is significantly more concentrated than income.

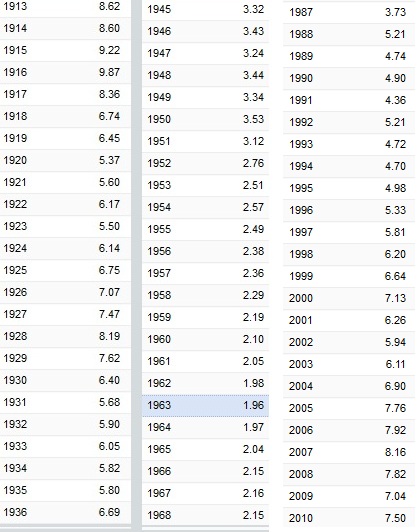
Looking at the dataset, you can see patterns over time. For instance, here’s part of the data from the U.S. (notice there are time gaps between the end of each column and the beginning of the next–I was just grabbing some illustrative screencaps), showing how the percent of income earned by the top 0.1% decreased significantly starting in the 1940s, but began creeping up again by the late 1980s and has grown since then:

The site also allows you to create graphs. They provide a comparison of the share of income earned by the top 1% in 2005 in the U.S., Japan, Australia, and France, but you can look at data for individual nations:

It’s worth playing around a bit, but keeping in mind the caveats about what these data do and don’t tell us. Thanks to Shamus Khan for the tip!

Cross-posted at Family Inequality.

The Carsey Institute’s Kristin Smith has written a brief on the plight of home care workers — the home health aides and personal care aides that play a growing role in our patchwork network of care work.

The news now is that these workers are not covered by the Fair Labor Standards Act — which offers the protection of minimum wage and overtime pay — but the U.S. Labor Department has proposed to bring them under its aegis.

According to the Department of Labor:

Many of these workers are the primary breadwinners for their families. Of the roughly 2 million workers who will be affected by this rule, more than 92 percent are women, nearly 50 percent are minorities, and nearly 40 percent rely on public benefits such as Medicaid and food stamps. According to the Bureau of Labor Statistics, home health care aides earn about $21,000 a year and many lack health insurance.

Smith’s analysis uses 2011 federal data. She shows that home care workers are more likely to work overtime, and more likely to work part time, than direct care workers in hospitals and nursing homes:

And they are more likely to be working part time for involuntary reasons:

Finally, their median wages — and the wages of those in the bottom quartile of the occupation — are lower than those of hospital and nursing home workers:

As Nancy Folbre as explained, the economics are bad here. Besides the bad hours, bad pay, bad working conditions, lack of unions and lack of state protections, there are some structural problems. Paid home health care is competing with unpaid family care. That means the decision about whether to pay for professional care weighs against the value of a (usually female) family member’s unpaid work. That drives down the cost of home health care — which means more than a million women get lower wages, and women’s work is devalued. And so on. Breaking that cycle requires either a wage increase (sadly, that includes bringing them under the minimum wage law) or government subsidies.*

——————————

*One attempt to beat these economic odds and support long-term care, the Community Living Assistance Services and Supports Act (CLASS Act), was supposed to be a premium-based long-term care support program, and it was passed as part of Obamacare. However, with the rule that it be self-funding, and solvent, while paying a cash benefit for life to eligible beneficiaries, theadministration said it couldn’t be done after all. Actually paying for care isn’t cheap.

Philip N. Cohen is a professor of sociology at the University of Maryland, College Park, and writes the blog Family Inequality. You can follow him on Twitter or Facebook.

Originally posted at In Transit and Racialicious.

I’m still trying to work my way through my discomfort and analyze exactly where my discomfort of this Sociological Images post is coming from, so if this critique seems a bit scattered, it’s because my thoughts about it, at the moment, are that way.

First: I agree with where the post is coming from, in that the disenfranchised rarely ever have a voice of their own in mainstream Western culture, are always portrayed as the Other, which is defined as everything that said mainstream Western culture isn’t (at best as something that props it up and provides an aesthetically pleasing contrast, at worst as something that must be exterminated). And this leads to remarkably similar cycles of dehumanization and disenfranchisement. As so many minority thinkers/activists have noted, manufactured binaries between the privileged West and everyone else, even seemingly positive ones, ultimately end up reinforcing destructive hierarchies.

Where I disagree with the poster is the framing, which I feel makes the post, in some ways, as reductive as what it’s critiquing. Because there are different contexts in which the above cycle/process of exotification occurs, and those contexts matter and shouldn’t be handwaved, even (and I would say especially) if you’re taking the pov of the white outsider and attempting to deconstruct it. Social justice discourse loses its meaning when it becomes divorced from one of power relations.

In this specific example, while making its comparison of India as a magical negro, the post fails to both note and appreciate the following bits of context:

That both the main white actress and the main desi actor in the film are British, with Dev Patel adopting an Indian accent and playing the part of a “native”. That all the featured Indian characters are coded as middle/upper class (the dress, able to speak fluent English, etc) and light skinned. That in many ways this is how India is actively marketed by its tourism sector (and also its government. Did a project once which involved collecting promo material from the Indian consul — I think in Chicago? — and it was quite hilariously illuminating), because they’ve judged that this type of pandering will bring in the tourist dollars.

And this exotification of India in the West has been happening since before the time of Columbus, and reducing said things to a “phenomenon in which a white character in a tv show or movie finds enlightenment…” seems rather glib. (Just because it appears in tvtropes does not mean TV created it!) And that’s not even getting into how most isms seem to inevitably become just like the racism that blacks (had) face(d) in the US.

I also thought it was telling how none of the links elaborating on the “magical negro” trope went to one of the many black writers who’ve done the major work of deconstructing and dissecting it, much less linking to desi writers talking about colonialism and othering.

So what my disagreement boils down to, I think, is this: that this is a discussion about the Othering/exotification of India in mainstream Western culture that succeeds in further marginalizing/disenfranchising desis and other minorities. It doesn’t consider that we might be among the audience for this post (much less making room in the conversation for us, much less acknowledging all the times we’ve already discussed this), and in the way it takes something that rose out of certain contexts, misidentifies said contexts while applying it to different ones with no mention of the consequences of the differences, makes it, again, similar to what it’s aiming to critique.

And it brings home the point that, for all its social justice aims, this is a blog for a specific group of white people, by a specific group of white people, with all the marginalizations that entails.

Another note: it is interesting to read the comments, to see all the places East/West binaries crop up. For example, this comment (which thankfully was critiqued):

So, this is probably why you’ll never find a movie about a Westerner in Latvia trying to find himself- “finding oneself” usually requires immersing oneself in a setting completely different from the everyday humdrum norm.

I do find India humdrum normy, actually. And infrastructure specifically designed to ape the west is increasingly common in cities, and you can always find people in the touristy parts who speak English and cater to Western tastes in a thousand and one ways. (Actually, you won’t need to find them, if you are white they will find you and you will not be able to escape them!) Latvia, I am assuming not so much?

I feel as if the manufactured differences that so many Westerners create for India, while completely missing the deeper and more significant ones, are part of the same binary that Fanon was talking about when he said: “The settler is all that is good and of value. The native is the negation of the settler’s value”. And a lot of the appeal of India, the reason for it not being “everyday humdrum normy”, is that it still gives middle class white Westerners who go there chances to personally experience the colonial British sahib lifestyle.

————————-

Colorblue blogs at In Transit.

UPDATE:  Since posting this, I’ve discovered that the numbers do not accurately reflect the ratio of CEO vs. worker pay.  Writes PolitiFact:

We don’t doubt the chart’s underlying point that the ratio of CEO pay to worker pay is high in the United States, and is likely higher in our free-wheeling economy than it is in the historically more egalitarian nations of Europe.

But in its claim that the U.S. ratio is 475 to 1, the chart conveys a sense of certitude and statistical precision that simply isn’t warranted — and which is contradicted by the facts. The latest number for the U.S. is 185 to 1 in one study and 325 to 1 in another [though in previous years, those ratios have reached as high as 525 to 1] — and those numbers were not generated by groups that might have an ideological interest in downplaying the gaps between rich and poor. We rate the claim on the U.S. ratio False.

I apologize for not vetting this more carefully.

H/T KeepYourHopesUpHigh via GlobalSociologyBlog.

Lisa Wade, PhD is an Associate Professor at Tulane University. She is the author of American Hookup, a book about college sexual culture; a textbook about gender; and a forthcoming introductory text: Terrible Magnificent Sociology. You can follow her on Twitter and Instagram.

London filmmaker Michael Story sent in a short video he made about the mismatch between crime as presented in TV reports and the reality of crime in the UK. TV reports, Michael argues, misrepresent how common crime is, where it occurs, and who is most likely to be involved in violent crime; in so doing, they reinforce stereotypes about race, ethnicity, class, and criminality:

London’s 66,000 guns – by Michael Story from chichard41 on Vimeo.

Cross-posted at Family Inequality.

In 1994, Sara McLanahan and Gary Sandefur published, Growing Up With A Single Parent: What Hurts, What Helps. The growth of children living with only their mothers was — then as now — a matter of concern not only for children’s well-being, but for intergenerational mobility. One of their empirical conclusions was this:

For children living with a single parent and no stepparent, income is the single most important factor in accounting for their lower well-being as compared with children living with both parents. It accounts for as much as half of their disadvantage. Low parental involvement, supervision, and aspirations and greater residential mobility account for the rest.

The biggest problem, in other words, is economic. The other factors —  involvement, supervision, aspirations, mobility — are related to social class and the time poverty that economically-poor parents experience.

Examples

Here are some bivariate illustrations — that is, head-to-head comparisons of the difference between children of poor and non-poor versus single and married parents.

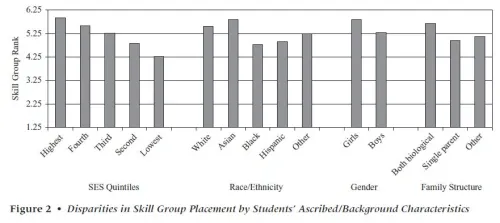
These are the “skill group” rankings by teachers of children by socioeconomic status (or SES, a composite of parents’ education, occupational prestige and income) versus race/ethnicity, gender and family structure. SES shows the widest spread in reading teachers’ group placement of first graders.

Source: Condron (2007)

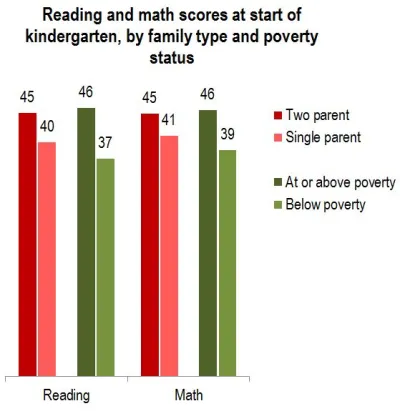
Similarly, the poor/nonpoor difference is greater than the two-parent/single-parent difference in kindergarten entry scores:

Source: Early Childhood Longitudinal Study (2009)

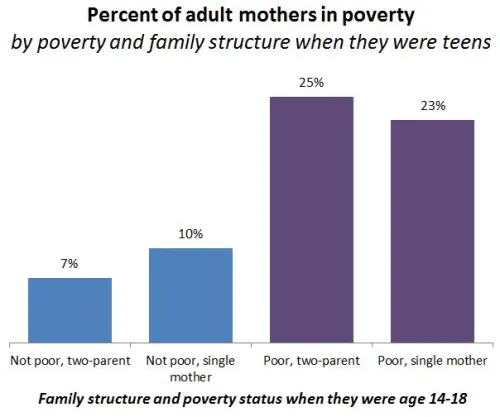
Those are just two examples from early-childhood assessments. More importantly, here is the breakdown seen in a longitudinal study of children growing up. When women grow up to be mothers, their poverty level in childhood is more important than their family structure for predicting whether they will be in poverty themselves. The poverty difference is large, the family structure difference is not:

Source: Musik & Mare (2006)

This study included a more sophisticated set of multivariate analyses than this simple graph, but the author’s conclusion fits it:

Net of the correlation between poverty and family structure within a generation, the intergenerational transmission of poverty is significantly stronger than the intergenerational transmission of family structure, and neither childhood poverty nor family structure affects the other in adulthood.

That is, childhood poverty matters more.

Fewer single parents, or less poverty?

But if single parenthood and poverty are so closely related, some people say, we should spend hundreds of millions of dollars promoting marriage to help children avoid poverty (and other problems). That’s what the government has done, with money from the welfare budget. Even if it worked, which it apparently doesn’t, it’s only one approach. What about reducing poverty? And, more specifically, reducing the relative likelihood of poverty in single-parent families versus those with married parents. That is, address the poverty gap between the two groups, rather than the size of the two groups. This has the added advantage of not singling out one group — single mothers — for social stigmatization (of the kind I mentioned here). And, because it defines the problem as economic rather than moral, may make it easier to build public support for helping the poor.

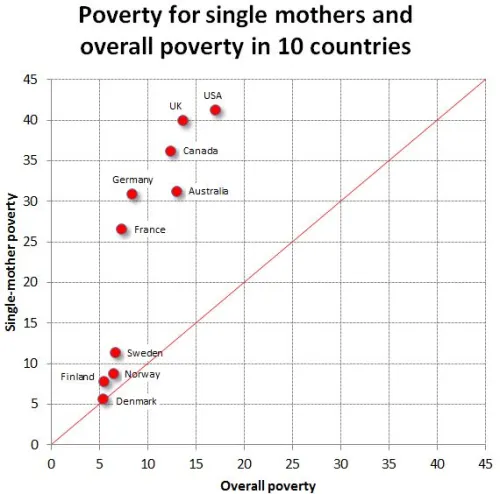
Consider a recent paper by David Brady and Rebekah Burroway, which will be published in Demography. They analyzed the relative poverty of single mothers versus the total population — that is, what percentage had incomes below half the median (per person, after accounting for taxes and government transfers). Such a relative poverty measure is really a measure of inequality, but specifically inequality at the low end. (Regardless of how rich the rich are, it’s theoretically possible to have no one below half the median income). Here is my graph showing that result, with only the countries that have reliable sample sizes in the survey:

The Nordic countries have the lowest overall poverty rates. But in absolute terms their advantage is much bigger for single mothers. (The red line shows equal poverty rates for single mothers and the total population.) The US and UK have the largest difference in poverty rates between single mothers and overall poverty. That is, we have the largest poverty penalty for single motherhood. If the relative poverty rates for single mothers were lower in the US, we might spend more time and money addressing poverty and less trying to change family structures.

In his book, Great American City, sociologist Robert Sampson argues that, while the effects of macro factors like poverty and political neglect on individual lives are well-documented, other local mechanisms matter too.  It’s important, then, to think about the constitution of neighborhoods.

Along these lines, he argues, even if a community is economically- and socially-marginalized, an existing neighborhood organizations can make a big difference.  He takes natural disasters as a case study.  A neighborhood organization can spread the news of an impending disaster, establish leadership, and organize assistance before, during, and after a crisis.  In this way, Sampson brings together micro, meso, and macro forces shaping the impact of disaster.

Lisa Wade, PhD is an Associate Professor at Tulane University. She is the author of American Hookup, a book about college sexual culture; a textbook about gender; and a forthcoming introductory text: Terrible Magnificent Sociology. You can follow her on Twitter and Instagram.