Search results for feed

Cross-posted at Reports from the Economic Front.

With the election over, the news is now focused, somewhat hysterically, on the threat of the fiscal cliff.

The fiscal cliff refers to the fact that at the end of this calendar year several temporary tax cuts are scheduled to expire (including those that lowered rates on income and capital gains as well as payroll taxes) and early in the next year spending cuts are scheduled for military and non-military federal programs.  See here for details on the taxes and programs.

Most analysts agree that if tax rates rise and federal spending is cut the result will be a significant contraction in aggregate demand, pushing the U.S. economy into recession in 2013.

The U.S. economy is already losing steam.  GDP growth in the second half of 2009, which marked the start of the recovery, averaged 2.7% on an annualized basis.  GDP growth in 2010 was a lower 2.4%.  GDP growth in 2011 averaged a still lower 2.0%.  And growth in the first half of this year declined again, to an annualized rate of 1.8%.

With banks unwilling to loan, businesses unwilling to invest or hire, and government spending already on the decline, there can be little doubt that a further fiscal tightening will indeed mean recession.

So, assuming we don’t want to go over the fiscal cliff, what are our choices?

Both Republicans and Democrats face this moment in agreement that our national deficits and debt are out of control and must be reduced regardless of the consequences for overall economic activity.  What they disagree on is how best to achieve the reduction.  Most Republicans argue that we should renew the existing tax cuts and protect the military budget.  Deficit reduction should come from slashing the non-military discretionary portion of the budget, which, as Ethan Pollack explains, includes:

…safety net programs like housing vouchers and nutrition assistance for women and infants; most of the funding for the enforcement of consumer protection, environmental protection, and financial regulation; and practically all of the federal government’s civilian public investments, such as infrastructure, education, training, and research and development.

The table below shows the various programs/budgets that make up the non-security discretionary budget and their relative size.  The chart that follows shows how spending on this part of the budget is already under attack by both Democrats and Republicans.

Unfortunately, the Democrat’s response to the fiscal cliff is only marginally better than that of the Republicans.  President Obama also wants to shrink the deficit and national debt, but in “a more balanced way.”  He wants both tax increases and spending cuts.  He is on record seeking $4 trillion in deficit reduction over a ten year period, with a ratio of $2.50 in spending cuts for every $1 in new revenue.

The additional revenue in his plan will come from allowing tax cuts for the wealthy to expire, raising the tax rate on the top income tax bracket, and limiting the value of tax deductions.  While an important improvement, President Obama is also committed to significant cuts in non-military discretionary spending.  Although his cuts would not be as great as those advocated by the Republicans, reducing spending on most of the targeted programs makes little social or economic sense given current economic conditions.

So, how do we scale the fiscal cliff in a responsible way?

We need to start with the understanding that we do not face a serious national deficit or debt problem.  As Jamie Galbraith notes:

…is there a looming crisis of debt or deficits, such that sacrifices in general are necessary? No, there is not. Not in the short run — as almost everyone agrees. But also: not in the long run. What we have are computer projections, based on arbitrary — and in fact capricious — assumptions. But even the computer projections no longer show much of a crisis. CBO has adjusted its interest rate forecast, and even under its “alternative fiscal scenario” the debt/GDP ratio now stabilizes after a few years.

Actually, as the chart below shows, the deficit is already rapidly falling.  In fact, the decline in government spending over the last few years is likely one of the reasons why our economic growth is slowing so dramatically.

As Jed Graham points out:

From fiscal 2009 to fiscal 2012, the deficit shrank 3.1 percentage points, from 10.1% to 7.0% of GDP.  That’s just a bit faster than the 3.0 percentage point deficit improvement from 1995 to ’98, but at that point, the economy had everything going for it.

Other occasions when the federal deficit contracted by much more than 1 percentage point a year have coincided with recession. Some examples include 1937, 1960 and 1969.

In short, we do not face a serious problem of growing government deficits.  Rather the problem is one of too fast a reduction in the deficit in light of our slowing economy.

As to the challenge of the fiscal cliff — here we have to recognize, as Josh Bivens and Andrew Fieldhouse explain, that:

…the budget impact and the economic impact are not necessarily the same. Some policies that are expensive in budgetary terms have only modest economic impacts (for example, the 2001 and 2003 tax cuts aimed at high-income households are costly but do not have much economic impact). Conversely, other policies with small budgetary costs have big economic impacts (for example, extended unemployment insurance benefits).

In other words, we should indeed allow the temporary tax rate deductions for the wealthy to expire, on both income and capital gains taxes.  These deductions cost us dearly on the budget side without adding much on the economic side.  As shown here and here, the evidence is strong that the only thing produced by lowering taxes on the wealthy is greater income inequality.

Letting existing tax rates rise for individuals making over $200,000 and families making over $250,000 a year, raising the top income tax bracket for both couples and singles that make more than $388,350, and limiting tax deductions will generate close to $1.5 trillion dollars over ten years as highlighted below in a Wall Street Journal graphic .

However, in contrast to President Obama’s proposal, we should also support the planned $500 billion in cuts to the military budget.  We don’t need the new weapons and studies are clear that spending on the military (as well as tax cuts) is a poor way to generate jobs.  For example, the table below shows the employment effects of spending $1 billion on the military versus spending the same amount on education, health care, clean energy, or tax cuts.

defense.jpg

And, we should also oppose any cuts in our non-security discretionary budget. Instead, we should take at least half the savings from the higher tax revenues and military spending cuts — that would be a minimum of $1 trillion — and spend it on programs designed to boost our physical and social infrastructure.  Here I have in mind retrofitting buildings, improving our mass transit systems, increasing our development and use of safe and renewable energy sources like wind and solar, and expanding and strengthening our social services, including education, health care, libraries, and the like.

Our goal should be a strong and accountable public sector, good jobs for all, and healthy communities, not debt reduction.  The above policy begins to move us in the right direction.

—————————

Martin Hart-Landsberg is a professor of Economics and Director of the Political Economy Program at Lewis and Clark College.  You can follow him at Reports from the Economic Front.

…voting rights still excluded certain groups?

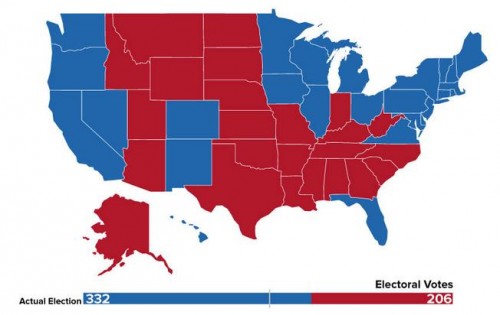
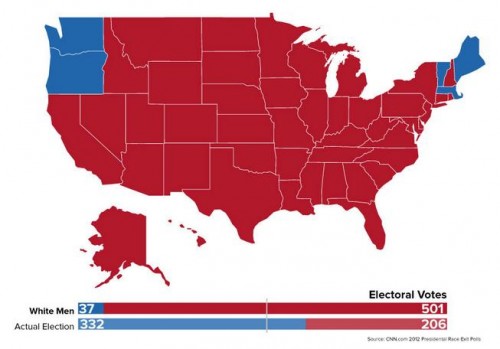
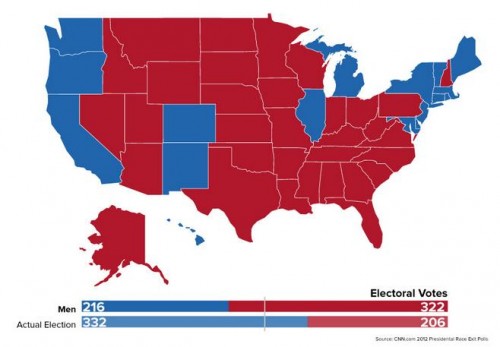
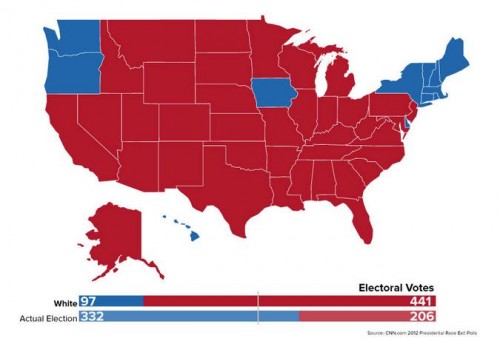
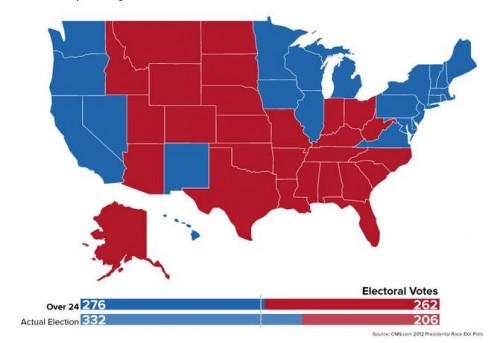
Buzzfeed has put together a great collection of U.S. maps showing what last Tuesday’s election would have looked like if women, non-whites, and 18- to 23-year-olds had never been given the vote.

Actual results:

Results with just white men:

Results with only men, all races:

Results with only white people, men and women:

Results excluding people 18- to 23-years-old:

The results are stunning and are a hint of just how consequential the ongoing voter suppression and disenfranchisement can be.

Lisa Wade, PhD is an Associate Professor at Tulane University. She is the author of American Hookup, a book about college sexual culture; a textbook about gender; and a forthcoming introductory text: Terrible Magnificent Sociology. You can follow her on Twitter and Instagram.

Fish farming, the raising of fish in captivity, is often seen as a more sustainable way to feed the increasingly global hunger for seafood.  At least, the story goes, it doesn’t contribute to the over-fishing of our oceans.

Right?

The answer turns out to be: not necessarily.  Carnivorous species of farmed fish still need to be fed, so there is  an entire secondary industry: fishing for fish food.  Just about anything that can be caught will do; the mix of sea animals is simply ground up and made into pellets.  So, the fisherman typically catch absolutely everything that they can, sterilizing a small piece of the ocean.  They don’t distinguish between large and small fish (the large they can sell as human food, the small they sell as fish food) or adults and juveniles. By taking the larger fish, they’re taking out populations before they have a chance to reproduce.  You can see how this is a system with a devastating expiration date.

This 9-minute clip from Grinding Nemo covers the environmental impact of this practice, as well as the inhumane working conditions of some of the men hired to work in this industry:

Via Sociology in Focus.

Lisa Wade, PhD is an Associate Professor at Tulane University. She is the author of American Hookup, a book about college sexual culture; a textbook about gender; and a forthcoming introductory text: Terrible Magnificent Sociology. You can follow her on Twitter and Instagram.

For whatever reason, there has been a real slump in the number of people typing “obama gun” (will he take our guns away?), “obama muslim” (the idea used to run at about 20%), “obama socialist” (the republic “hangs in the balance“), and “obama citizen” (thank you, Snopes) into the Google search box since the 2008 election.

Here’s the Google trend (and the search link):

We don’t know how much these fears, versus other concerns, will affect votes against him this year, although there have been some good efforts to track the effects of anti-Black racism on his vote tally.

Naturally, not everyone who Googles these things believes the underlying stories or myths. But it seems likely they either believe them, are considering them, heard someone repeat them, or are arguing with someone who believes them, etc. So I’m guessing – just guessing – that these trends track those beliefs.

But maybe four years of Obama as an actual president has softened up the hard-line hatred in some quarters. What do you think?

Philip N. Cohen is a professor of sociology at the University of Maryland, College Park, and writes the blog Family Inequality. You can follow him on Twitter or Facebook.

Cross-posted at Caroline Heldman’s Blog.

During a debate this past Tuesday, Indiana Republican senate nominee, Richard Mourdock, made the case against the rape exception for abortions: “I’ve struggled with it myself for a long time, but I came to realize that life is that gift from God, and even when life begins in that horrible situation of rape, that it is something that God intended to happen.”

So according to Mourdock, God intends for rape to happen, and the outcome of rape is a gift from God.

What puzzles me is how Mourdock’s rape enthusiast comments fit with Missouri Republican senate candidate Todd Akin’s recent comments that “legitimate rape” (read“forcible rape”) rarely leads to pregnancy because, ”If it’s a legitimate rape, the female body has ways to try to shut that whole thing down.”

Mourdock and Akin’s beliefs, when considered together, produce a bizarre philosophy. I would like to know: Why would God create female bodies that reject God’s “gifts”? And if women don’t get pregnant from “forcible rape,” does that mean that God doesn’t intend ”forcible rapes”? Put another way, does God only intend certain types of rape, you know, the ones that come with “the gift”?

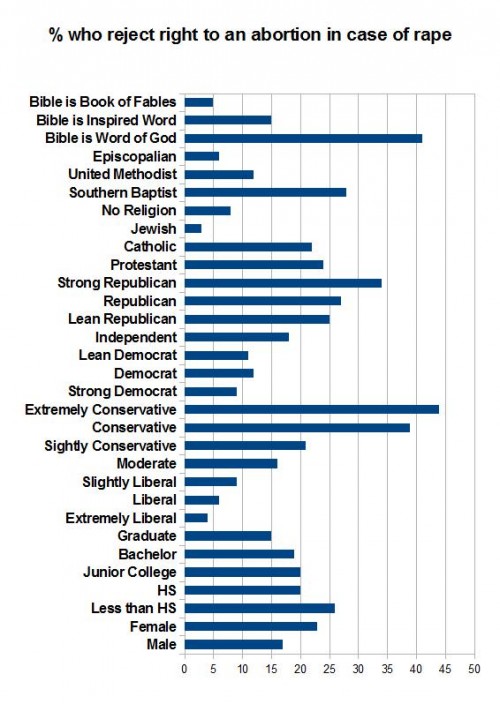
One-in-five Americans agree with Mourdock and Akin’s abortion stance. Razib Khan’sanalysis of the General Social Survey shows that 20% of Americans think abortion should be illegal in cases of rape. Republicans with lower levels of education who identify as extremely conservative and believe the Bible is the word of God are more likely than other Americans to hold this belief.

For Mourdock, Akin, and more than 50 million other Americans, God truly does work in mysterious ways.

Caroline Heldman is a professor of politics at Occidental College. You can follow her at her blog and on Twitter and Facebook.

Well, first, they’re not baby carrots.  The two-inch carrots marketed as juveniles are actually pieces of regular sized carrots that are cut off and shaved into a “baby carrot” shape.  So, there’s no reason to expect the babies to be fresher, more tender, or sweeter. (Sorry, baby carrot lovers.)

But revealing how baby carrots are made is only Part I of the answer to the question of where they come from.  Who had the idea to make “baby carrots” and for what reason?

It turns out the idea came from a grower named Mike Yurosek.  According to Douglas McGray at Fast Company, it was grocery stores that pushed Yurosek to invent the baby carrot.  McGray writes:

…Yurosek had become frustrated with all the waste in the carrot business. Supermarkets expected carrots to be a particular size, shape, and color. Anything else had to be sold for juice or processing or animal feed, or just thrown away. Yurosek wondered what would happen if he peeled the skin off the gnarly carrots, cut them into pieces, and sold them in bags.

He whipped up two prototypes: the baby carrot with which we’re all familiar and “bunny balls,” 1-inch round carrot bites.  Somehow the latter didn’t catch on.  The rest is history.

Thanks to Annie C. for sending in the link!

Lisa Wade, PhD is an Associate Professor at Tulane University. She is the author of American Hookup, a book about college sexual culture; a textbook about gender; and a forthcoming introductory text: Terrible Magnificent Sociology. You can follow her on Twitter and Instagram.

Cross-posted at Family Inequality.

People don’t know how much they’re eating.

A recent experiment found that people eat more when the container is larger, even when the portion size is not. They gave Belgian college students a container of M&Ms and parked them in front of a TV, with some cover story. The students were randomly assigned to three groups, medium-portion/small-container, medium-portion/large-container, and large-portion/large-container. These were the results: The ones who got the large container ate more, whether it was full or not (the difference between the two wasn’t significant).

These kinds of experiments continuously suggest that distractions, distortions and other apparently irrelevant information and events routinely have large effects on people’s eating practices (here’s an extensive review). One infamous study showed that even people served 14-day-stale popcorn at the movies ate 34% more when it was served in a large container. In an earlier popcorn study, researchers found that people given large containers not only ate more, but were less able to report how much they ate. They concluded:

When a food is eaten from a large container, it appears easy to lose track of how much one eats. Even if the food were to taste relatively unfavorable, eating it from a large container may cause one to overeat because they lose track of how much they have consumed.

About that Yogurt Tub…

All this occurred to me when I visited one of our many local Frozenyo franchise outlets. It’s a self-serve frozen yogurt place where you pay one price by weight no matter what you put in your bucket. The trick that impressed me is the bucket — there is only one size, and it’s very large. But you can’t judge how big it is because there’s nothing to compare it with — no sizes or prices on the wall, no mini cup for kids — just one stack of identical buckets. So the person who posted this picture on Yelp probably thought she had a reasonable size serving, since the thing is barely half full:

There are three possible ways to judge your self-served serving size. You can go by the tub (“I filled it half way”), you can go by the person next to you (“sheesh!”), or you can look at the cartoon penguins on the wall:

How much is the penguin eating? I took home one of the buckets, and measured the volume of water it holds: 18 ounces. In comparison, a standard kid-sized serving bowl, the kind some people use to give their kids ice cream at home, holds 12 ounces:

An innocent child used to half a bowl of ice cream — in the bowl on the left — might be pretty steamed if you served her this:

According to the serving size information on the back wall of Frozenyo, I think that’s about 1.5 servings, or 150 calories of the nonfat variety, before toppings. The penguin’s overflowing bowl is 5.0 servings. With no toppings that’s 500 calories. If you pile it with M&Ms, sprinkles, hot fudge, Captain Crunch, coconut topping and fresh kiwis, who knows. It’s not really that many calories to consume — the same number as a single slice of banana bread at Starbucks.

But the point is you don’t know how much you’re eating. One Yelp reviewer cautioned that you can get a stomach ache after eating at Frozenyo, because “your eyes are bigger than your stomach.” I think it’s because the dump-truck sized delivery vehicle you eat it out of is bigger than your stomach.

But most reviewers love it for the individual control over serving size and toppings, and the reasonable price ($.39 per ounce by weight, or $5-$6 for a typical load).* I think it’s a winning business model, with low labor costs, because all you need is one person to pour the mix into the machines and another to weigh the tubs and swipe credit cards. According to the company’s ambitious map, there are still 46 states with “territory available.”

If I were them, I would increase the bucket size by 5% per year. I doubt anyone would notice.

* Paging George Ritzer: it’s the irrationality of rationality.

Cross-posted at Family Inequality.

You can’t get 18 pages into Hanna Rosin’s blockbuster myth-making machine The End of Men, before you get to this (on page 19):

One of the great crime stories of the last twenty years is the dramatic decline of sexual assault. Rates are so low in parts of the country — for white women especially — that criminologists can’t plot the numbers on a chart. “Women in much of America might as well be living in Sweden,* they’re so safe,” says criminologist Mike Males.

That’s ridiculous, as I’ll show. Rape is difficult to measure, partly because of limiting state definitions, but the numbers are consistent enough from different sources to support the conclusion that reported rape in the United States has become less common in the last several decades — along with violent crime in general. This is good news. Here is the rate of reported “forcible rape” (of women) as defined by the FBI’s crime reporting system, the Uniform Crime Reports.**  See the big drop — and also that the rate of decline slowed in the 2000s compared with the 1990s:

(Source: Uniform Crime Reports, 2010)

The claim in Rosin’s book — which, like much of the book, is not sourced in the footnotes — is almost too vague to fact-check. What is “much of the country,” and what is a number “so low” that a criminologist “can’t plot” it on a chart? (I’m no criminologist, but I have even plotted negative numbers on a chart.)

Even though she makes things up and her publisher apparently doesn’t care, we must resist the urge to just ignore it. The book is getting a lot of attention, and it’s climbing bestseller lists. Just staying with the FBI database of reported rates, they do report them by state, so we can look for that “much of the country” she’s talking about. I made a map using this handy free tool.

(Source: FBI Uniform Crime Reports, 2010, Table 47)

The lowest state rate is 11.2 per 100,000 (New Jersey), the highest is 75 (Alaska). You can also get the numbers for 360 metropolitan areas. For these, the average rate of forcible rape reported was 31.5 per 100,000 population. One place, Carson City, Nevada, had a very low rate (just one reported in 2010), but no place else had a rate lower than 5.1. (you can see the full list here). I have no trouble plotting numbers that low. I could even plot numbers as low as those reported by police in Europe, where, according to the European Sourcebook of Crime and Criminal Justice Statistics, for 32 countries in 2007, the median rate was just 5 per 100,000 — which is lower than every U.S. metropolitan area for 2010 (except Carson City, Nevada).

These police reports are under-counts compared with population surveys that ask people whether they have been the victim of a crime, regardless of whether it was reported to police. According to the government’s Crime Victimization Survey (CVS), 65% of rape/sexual assault is not reported. The CVS rate of rape and sexual assault (combined) was 70 per 100,000 in 2010. That does reflect a substantial drop since 2001 (although there was also a significant increase from 2009 to 2010).

And what about the “for white women especially” part of Rosin’s claim? According to the Crime Victimization Survey (Table 9), the white victimization rate is the same as the national average: 70 per 100,000.

I hope it’s true, as Rosin says, that “what makes [this era] stand out is the new power women have to ward off men if they want to.” But it’s hard to see how that cause is served by inventing an end of rape.

—————————

*That is an unintentionally ironic reference, because Sweden actually has very high (for Europe) rate reported rape, which has been attributed to its broad definition and aggressive attempts at prosecution and data collection.

** Believe it or not, this was their definition: “the carnal knowledge of a female forcibly and against her will. Attempts or assaults to commit rape by force or threat of force are also included; however, statutory rape (without force) and other sex offenses are excluded.” That is being changed to include oral and anal penetration, as well as male victims, but data based on those changes aren’t reported yet.

Check the Hanna Rosin tag for other posts in this series.