Time‘s cover story this week is adapted from The Richer Sex, a forthcoming book by Liza Mundy. I provided a few numbers for the story (see below). The content is behind a pay wall here, but the cover gives a taste:
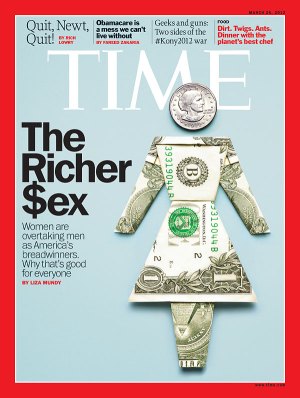
My only beef with the story is that it misidentifies the richer sex, which I’ll return to below. Otherwise, it’s an interesting piece on the (very partial) convergence in roles among married couples. Despite the current stall in progress toward equality, I’m glad to see an article with a positive take on the idea of equality (for middle class straight couples, at least) without focusing on the demise of men.
They only used two of the numbers I sent, so consider the other 9 numbers here a Family Inequality blog exclusive!
First, I showed them the trend in the gender composition of managers from 1980 to 2010. I used the 1990 occupational categories for this (from IPUMS), in the vain hope of maintaining consistency over time*:
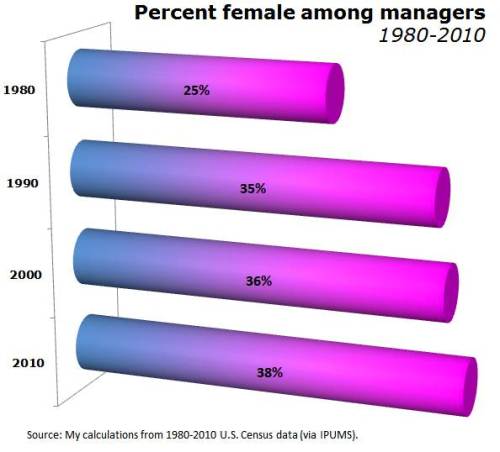
My emphasis was on the stall in progress since 1990, so I ended up in the “on the other hand” paragraph of the story.
The other piece of “other hand” I pitched to them was the segregation among managers — with women concentrated in some corners of the managerial world — which I mentioned here, and which Matt Huffman and I studied here. For 2010, that segregation, in broad strokes, looks like this:
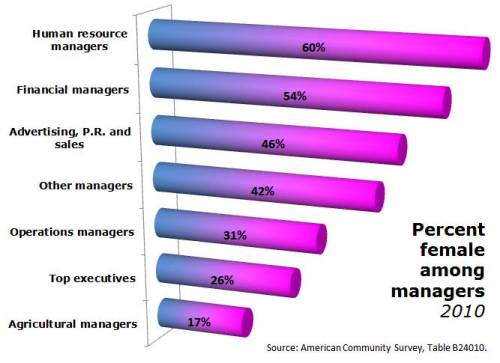
This didn’t make it into the story. There was to be only one “on the other hand” paragraph. It’s all about how women are pulling ahead of men and becoming the primary breadwinners, and what that means for gender and relationships.
Of course, women are not yet the richer sex, so the evidence in the article is about trends in that direction. The text says, for example:
Assuming present trends continue, by the next generation, more families will be supported by women than by men.
By the time the graphics department got to it, the “assuming…” part was gone, and this was the header:

The numbers that support this are the trend from 24% of wives out-earning their husbands in 1987 to 38% in 2009 (helped considerably by the mancession’s crimp on men’s jobs in 2008 and 2009). Here’s their graph:

Going from 24% to 38% in 22 years doesn’t mean we’ll pass 50% in another generation. It might be OK for rhetorical purposes to say something like, “at this rate it’ll take 300 years for the U.S. to catch Sweden’s welfare state” — but not OK to say it will happen in that time. If that were true, I could show you this graph and say, “the Earth will be a ball of human flesh expanding at the speed of light in less than 1,000 years!”

Besides projecting from the trend, the other reasonable way to make guesses about the future is to look at young people. For that Liza Mundy reuses a statistic that Time first used in 2010, showing that among those who are single, child free, under 30 and living in metro areas, women have higher earnings than men.
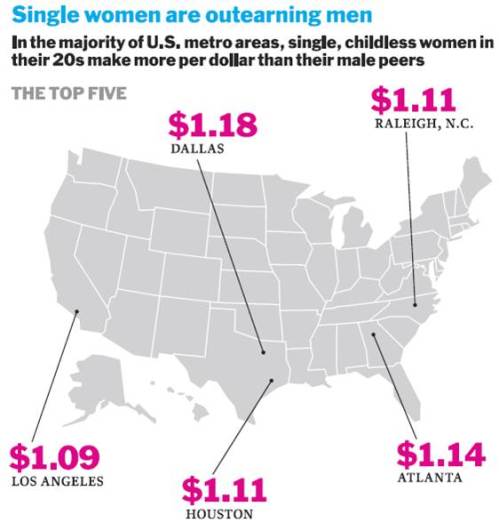
Great, you’re thinking, stay young and single, and don’t have children, and equality is yours!
I do believe our children are the future, but predicting the future from this subset is not a safe bet. The original Time piece is critiqued here and here, although the New York Times hit on this formula for gender equality in 2007 (critiqued here). The basic manipulation here is limiting the comparison to men versus women within a group where women are more likely to have completed college but not yet experienced the wage-diminishing events that now largely begin in the late 20s (marriage, children, and slower earnings growth). It’s an interesting comparison, but shouldn’t be used for projecting the future — or even characterizing the whole present.
Anyway, interesting story.
*There can be no perfectly matching set of occupational categories over long periods of time, because the type of work being done has changed. For example, there were no computer programmers or “customer service representatives” to speak of in 1980, and there are millions now.


