NPR’s Planet Money blog posted this image showing changes in major categories of federal spending over the past 50 years. Notably, though defense spending (which includes veteran benefits) is still the largest category of federal spending, it’s a much smaller proportion of the total budget than it was in the ’60s; spending on interest on our debt has also fallen quite a bit since the ’80s. On the other hand, spending on Social Security, Medicare and Medicaid (which didn’t even exist in 1962), and safety net programs (including food stamps and unemployment) have grown. The somewhat reduced “everything else” category includes everything from education to space exploration to agriculture and more:

Via The Sociological Cinema; data available at the Office of Management and Budget.

The splashy introduction of the new LEGO friends line earlier this year stirred up a lot of controversy. My goal with this set of posts is to provide some historical perspective for the valid concerns raised in this heated debate. 

————————

1989-2003: Gender Ahoy!

I discussed the introduction of LEGOs the invention of gendered minifigs, and early efforts to market separately to girls and boys in Part I of this series, covering 1932 to 1988.  The segregation of LEGO into feminine and masculine sets would escalate beginning in 1989.  That year the LEGO group introduced gender to the minifig in a big way with the new Pirates theme. The masculine figs sported copious facial hair and the lone feminine pirate had lipstick and a curved shirt that implied a busty chest.

This pioneering pirate was the first in a long line of token females in otherwise male-dominated action-centric themes. The imbalanced ratio of masculine to feminine minifigs persists today, though it has lessened over time. I have seen several different numbers for this ratio, so I decided to do my own count. I gave TLG the benefit of the doubt and counted as gender neutral any minifigs lacking definitely masculine (facial hair) or feminine (lipstick, eyelashes, cleveage) traits, even when LEGO marketing materials clearly delineate them as male or female.

The following graphs represent masculine minifigs in blue, feminine minifigs in red, and gender neutral minifigs in gray. I have also calculated the masculine to feminine ratio (m/f ratio). Ideally this should be 1, indicating that there are equal number of masculine and feminine figures. This chart shows the aggreagate across all themes for the five key years between 1989 and 1999. The m/f ratio for this data is 3.74 (which is a lot better than the initial 13.5 it starts at in 1989, but not exactly something to celebrate).

The trend to unrepresent feminine figures in the main LEGO product line is mirrored by a tendency to overrepresent them in the “girls only” lines. LEGO released four major “girls only” themes through this time period: ParadisaBelvilleScala Dolls, and Clikits.  Here’s a quick run down of the “girls only” themes:

  • Belville is the longest running “girls only” theme and also the pinkest and most gender stereotype reinforcing. The classic LEGO building experience is barely present; the sets favor gigantic pre-fabricated “walls” and floors, and the completed “houses” and “horse stables” don’t even look like their real-life counterparts. The figures are completely out of scale with minifgs, so while it is possible to use pieces from Belville in LEGOLAND and vice versa, it is unrealistic.
  • The Clikits jewelry line featured pieces that are barely compatible with regular LEGO bricks (some people might not even think to try.) The line also contained some Bratz-esque characters.

The message that these themes send to children about gender is clear — certain things are for girls only. Namely: fairy tales, equestrianism, the color pink, vanity, and being a homemaker. Boys shouldn’t want these things and the girls that don’t are lesser for it.

The chart below aggregates figures from the first three of those lines across all years they existed (since Clickits was a jewelry line, it didn’t really feature figures).  Beyond the inversely unbalanced the m/f ratio of 0.18 (roughly one masculine figure for every five feminine figures), it is also important to note that the percentage of neutral figs is incredibly low, so playing with these sets reinforces the either/or of gender roles:

Lest you think girls get all the special treatment, fear not, boys get their share of “boys only” themes. We’ve already discussed Trains and Technic which have long, proud, histories and exist in a blue and black anti-Belville realm (Technic even had Belville-sized masculine articulated figures for a while). In 1998 the ill-fated Znap bucked the trend of “boys only” themes being for advanced builders. It was simple to put together (like K’nex), but never caught on despite being viral. 1998 also saw the creation of a Technic subtheme with even more testosterone than usual: Competition. 2001 saw TLG try to bridge the gap between DUPLO and SYSTEM (for boys) with Jack Stone. 2001 was also the launch of TLG’s attempt to get in to the action figure market: Bionicle. This is arguably a gender-neutral theme, but considering that TLG forgot to include girl’s names for an online character creator for Bionicle’s successor, it’s clear that TLG does not think boys and girls can enjoy the same toys.

As a final note on this era, observe this graph of the m/f ratio on minifigs over time. Notice how it is on the decline (towards gender balance) before sharply increasing in the early 2000s? We’ll explore the reasons for that in the next installment.

Read Part III of A Historical Perspective on the LEGO Gender Gap.

—————————

David Pickett is a social media marketer by day and a LEGO animator by night.  He is fanatical about LEGO and proud to be a nerd. Read more from David at Thinking Brickly.

Lisa Wade, PhD is an Associate Professor at Tulane University. She is the author of American Hookup, a book about college sexual culture; a textbook about gender; and a forthcoming introductory text: Terrible Magnificent Sociology. You can follow her on Twitter and Instagram.

Network effect is a concept from economics that explains situations in which something becomes more valuable as more people use it. The classic example is the telephone; as more people and businesses adopted telephones, they became more useful (you could call a larger number of people you might wish to contact). More usage increased the value of the product, both for existing users and potential users. Social media work much the same way — an issue Google has faced as they try to pull enough users into Google+ to make it competitive with Facebook.

Over the weekend Matthew Hurst posted a video at Data Mining that illustrates the network effect…with dancers using an open area at the Sasquatch music festival. The video starts out a little slow; one guy starts dancing in the field, and a second guy joins him. For about a minute, it’s just the two of them. At 0:54, a third dancer appears. Through all of this, the surrounding crowd mostly ignores them, showing no inclination to participate. But at 1:12, a couple more people arrive, following immediately by more, and suddenly we’ve reached a tipping point: that open area is now a highly desirable spot to dance. People start running in from all directions, and many who had been ignoring the dancers suddenly jump up and join. It’s a great illustration of instances in which use drives more and more use:

Earlier this year a University of Wisconsin-Madison student at a fraternity house yelled racial slurs and threw a glass bottle at two Black female students.  The story is reported in the Wisconsin State Journal with the following title:

Notice that race isn’t mentioned, but alcohol is.  This makes no sense.  The March 23rd article is about an instance of racial harassment that occurred on March 16th.  The “alcohol incident” was old news; it had happened six months earlier in September.  Why is the old news the headline?

This wasn’t on purpose, was it?

It looks that way.

Reader Nils G. pointed out that the URL of the article reveals that there was a decision to change the title of the article from one that focused on race to one that focused on alcohol.  When you’re posting an article, the program automatically creates a URL using the first title you choose.  If you later change the title, the URL stays the same.  The URL of this article?:  “UW Fraternity Temporarily Suspended for Racial Incident.”

So, there was a choice to change the impact of this article from one that put race front-and-center to one about (frat) boys being (drunken frat) boys.  We can only speculate about why.

Lisa Wade, PhD is an Associate Professor at Tulane University. She is the author of American Hookup, a book about college sexual culture; a textbook about gender; and a forthcoming introductory text: Terrible Magnificent Sociology. You can follow her on Twitter and Instagram.

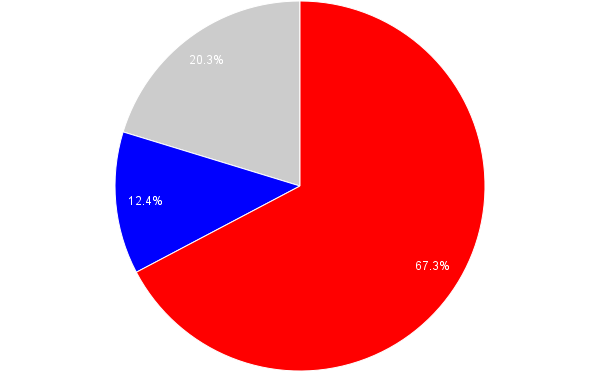
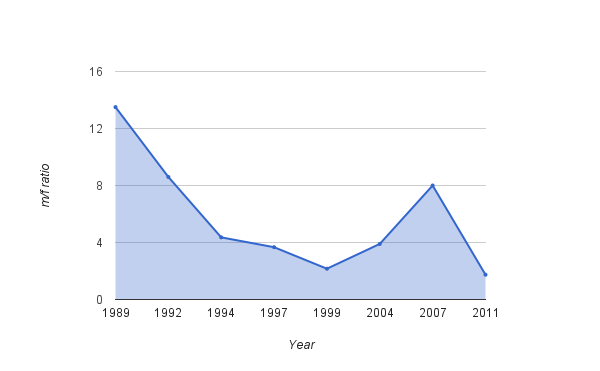
There is no one answer to the question, “How many people are lesbian, gay, bisexual or transgender?” But demographer Gary Gates, who works for the Williams Institute at UCLA’s School of Law, has compiled the results from nine surveys that attempt to measure sexual orientation — five of them from the U.S. He estimates that 3.5% of the U.S. population identify as lesbian, gay or bisexual, while 0.3% are transgender. Here is the breakdown for the different surveys:

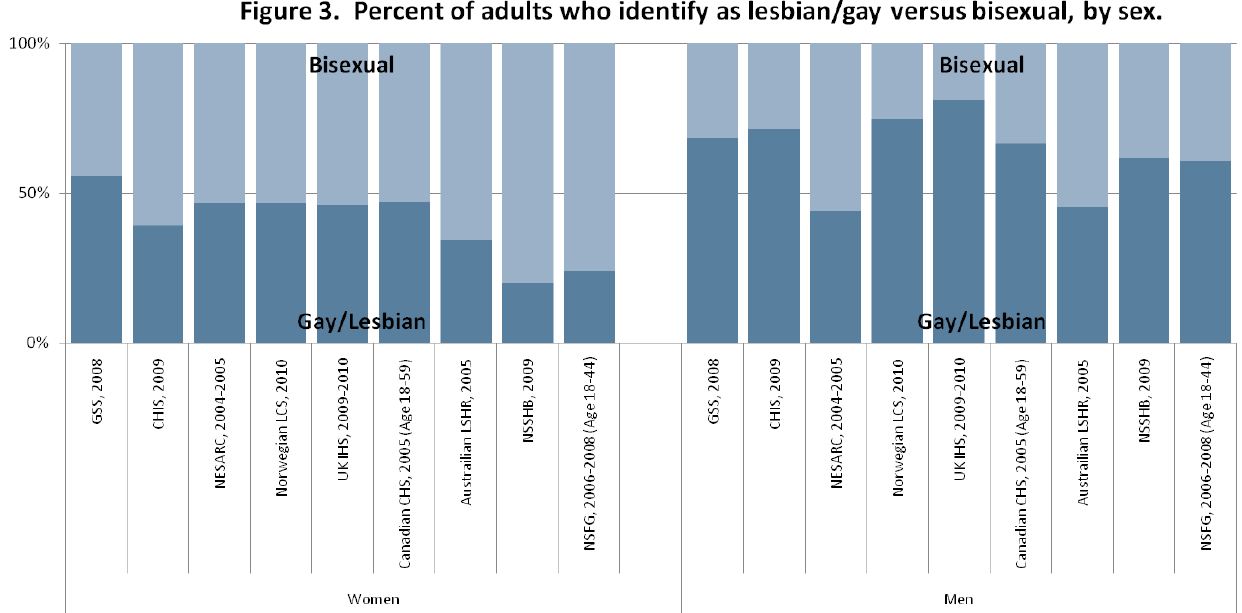
He also points out that bisexual identification is generally more common among women than among men. Among women, more than half of the lesbian/bisexual population identifies as bisexual; among men more than half identify as gay.

As is the case with race, we may rely on self-identification when it comes to sexual orientation. But criteria external to individuals’ identities may matter as well. These include the perceptions or actions of others (such as cross-burning or job discrimination), as well as qualities measurable by impersonal means (such as phenotypical traits or genes). In the case of sexual orientation more than race, these externally-measurable qualities include behavior (such as the gender of those one has sex with). The interpretation of these qualities, and their measurement, necessarily are highly contingent on social constructions.

In the case of sexual orientation, the questions are not usually asked, so the answers are not bureaucratically normalized. If the government and other data collectors were to start asking the question regularly, the results would probably settle down, as they have with race. In Michel Foucault’s terms, you might say the population is not disciplined with regard to sexual orientation as well as it is with race. (Of course, the public is unruly when it comes to measuring race as well, especially outside those outside the Black/White dichotomy, as “Asians” and “Hispanics” often offer national-origin identities when asked to describe their race.) Settling down doesn’t mean there would be no more changes, just that variability between surveys would probably decline.

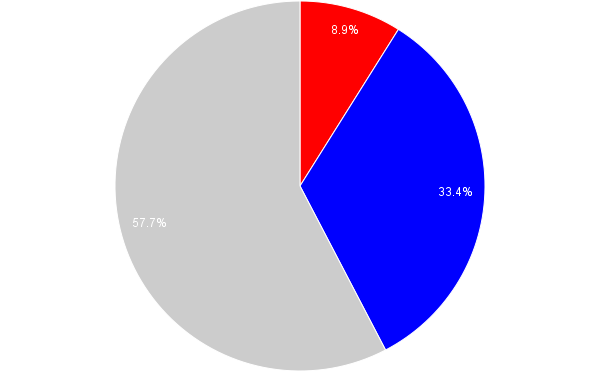
Because of this complexity, it is interesting to compare results when people are asked about their sexual behavior, and their sexual attraction. Here surveys find much higher rates of gayness. As Gates shows, for example, 11% of Americans ages 18-44 report any same-sex sexual attraction, while 8.8% report any same-sex sexual behavior.

Whether demographers, or the public, or anyone else, considers these experiences and feelings to define people as gay/lesbian or bisexual is not resolved. For example, as Gates notes in a much longer law review article that describes the methods behind his report – and the reactions to it – some media simply ignored the self-identified bisexual population, and those with same-sex attraction or behavior, declaring that the gay and lesbian population was less than 2% of Americans. Others concluded that the commonness of bisexuality implies most gays and lesbians in fact have a “choice” about their sexual orientation.

I recommend the law review article for Gates’s in-depth discussion of “the closet” issue with regard to surveys, and the problem of measuring concealed identities — which vary according to social context and sometimes change over the course of people’s lives.

I’m grateful that Gates has pursued these questions, and taken a lot of grief in the process. He concludes:

These are challenging questions with no explicitly correct answers. The good news is that strong evidence suggests that, politically at least, the stakes in this discussion are no longer rooted in an urgent need to prove the very existence of LGBT people. This progress hopefully provides the space to more critically and thoughtfully assess these issues in an environment where a sense of urgency is not paramount. Today, the size of the LGBT community is less important than understanding the daily lives and struggles of this still-stigmatized population and informing crucial policy debates with facts rather than stereotype and anecdote.

As with race, measurement of sexual orientation may be essential to legal and political responses to inequality and discrimination — even as the process helps solidify fixed identity categories we might rather do without.

Philip N. Cohen is a professor of sociology at the University of Maryland, College Park, and writes the blog Family Inequality. You can follow him on Twitter or Facebook.

Please enjoy these posts from Mother’s Days past:

Lisa Wade, PhD is an Associate Professor at Tulane University. She is the author of American Hookup, a book about college sexual culture; a textbook about gender; and a forthcoming introductory text: Terrible Magnificent Sociology. You can follow her on Twitter and Instagram.

Last week, on the heels of Obama’s announcement that he supports gay marriage, NPR interviewed the President of the Pew Research Center, Andrew Kohut, about trends in American support for the issue.  Kohut explained that American opinion has changed dramatically, and unusually, in a very short time.  In 1996, for example, 27% of people supported gay marriage (65% opposed).  This “really didn’t change very much” for a while.  In 2004, when Republicans mobilized the issue to get conservatives to the polls, 60% still opposed it.  But today, in the space of less than a decade, we have more people supporting gay marriage than opposing it.  Some polls show the majority of Americans believe that we should have the right to marry someone of the same sex.

This trend is driven, in part, by young people replacing the old, but focusing on this overshadows the fact that essentially all Americans — of every stripe — show higher support for gay marriage than they did a decade ago.  Both men and women and people of all races, political affiliations, religions, and ages are showing increased support for gay marriage.  This is a real, remarkable, and rare shift in opinion:

Opinion by age:
Opinion by religion:
Opinion by political party:
Opinion by political orientation:
Opinion by race:
Opinion by gender:
Via Montclair SocioBlog.

Lisa Wade, PhD is an Associate Professor at Tulane University. She is the author of American Hookup, a book about college sexual culture; a textbook about gender; and a forthcoming introductory text: Terrible Magnificent Sociology. You can follow her on Twitter and Instagram.

Florence Colgate recently won the title of Britain’s Most Beautiful Face.  The competition, which attracted more than 8,000 contestants, was sponsored by Lorraine Cosmetics.  The company compared each face to a mathematical algorithm representing beauty.  Florence, who is blonde and blue-eyes, came out on top:

[youtube]https://www.youtube.com/watch?v=YQjFFTezh5I[/youtube]

An example of the formula from the Daily Mail:

A woman’s face is said to be most attractive when the space between her pupils is just under half the width of her face from ear to ear. Florence scores a 44 per cent ratio. Experts also believe the relative distance between eyes and mouth should be just over a third of the measurement from hairline to chin. Florence’s ratio is 32.8 per cent.

So, it’s science, right?  Well, that plus (at least) a little bit of racism.  Carmen Lefèvre, a psychologist, was quoted explaining why Florence was so “classically” beautiful:

Florence has all the classic signs of beauty. She has large eyes, high cheekbones, full lips and a fair complexion. Symmetry appears to be a very important cue to attractiveness.

How did “fair complexion” get mixed up in there?

Not an isolated incident either.  Tom Megginson, of Work That Matters, reported on Britain’s Most Beautiful Face and added in another example of “objective” measures of beauty conflating light with pretty and dark with ugly.  This time it’s an app called Ugly Meter. You take a picture of your face and it tells you if you’re hot or not.  What Megginson noted was the overt colorism.  One attractiveness finding read:

For what it’s worth, he also scanned in some famous faces and found it to be, let’s just say, inexplicable and inconsistent:
Okay, well it might be right about Barbie. (Ha! I beat you to it, commentors!)

Ugly Meter, by the way, is offering a cash prize for the ugliest face.  So… the world is keepin’ it balanced, I guess.

Lisa Wade, PhD is an Associate Professor at Tulane University. She is the author of American Hookup, a book about college sexual culture; a textbook about gender; and a forthcoming introductory text: Terrible Magnificent Sociology. You can follow her on Twitter and Instagram.