You’ve probably heard someone in media or politics bemoan the ballooning student debt in the U.S.  In fact, debt has been rising.  It’s more than doubled in the last ten years (that’s a more than 100% increase):
This debt, though, can’t be attributed primarily to the rising cost of education, as Planet Money explains.  The average debt load for a student graduating from a public school, for example, has risen by 20%:
The average debt load for a student coming out of a private school has gone up a bit more, but still not enough to account for the leap in overall student debt.
The increase in debt, it turns out, is largely accounted for by an increase in the number of people going to college.  In 1970, 8,500 8,500,000 people enrolled in college in the Fall; in 2009, that number exceeded 20,000 20,000,000 (source).  A more than 100% increase.

So, the story isn’t quite as dire as we might think.  This may be little consolation, though, for my students who walked across the stage yesterday.  Congrats, Seniors! :)

Lisa Wade, PhD is an Associate Professor at Tulane University. She is the author of American Hookup, a book about college sexual culture; a textbook about gender; and a forthcoming introductory text: Terrible Magnificent Sociology. You can follow her on Twitter and Instagram.

Last week, the Census Bureau announced that as of July 1, 2011, for the first time the majority (50.4%) of babies under age 1 in the U.S. were not non-Hispanic Whites. Animal New York posted a video by Jay Smooth discussing the reactions to and implications of this news:

You can see the NYT article Jay Smooth parodies here, but note that the graph is mislabeled. The line labeled “White” actually only represents the data for non-Hispanic Whites, while the line labeled “Non-White” includes births to White Hispanics, so the terminology they used doesn’t accurately reflect what the graph illustrates.

We seem to have a way of regularizing the pain felt by working people—worsening living conditions become little more than background noise to business as usual. 

The situation for the unemployed is a case in point.  We have a complex, but comparatively miserly, unemployment compensation system. 

Workers are generally entitled to 26 weeks of unemployment benefits.  However, there are two programs that potentially extend the benefit period for the unemployed. The first is the Emergency Unemployment Compensation (EUC) program, which was enacted in 2008 in response to the economic crisis.  As the table below shows, the EUC offers workers in states with high rates of unemployment up to 53 additional weeks of benefits. 

weeks-of-benefits.jpg

Workers who exhaust both their regular unemployment insurance and EUC benefits can receive additional support through the second program, the permanent federal-state Extended Benefits (EB) program.  As the table above shows, that program offers a maximum of 20 extra weeks of benefits depending on state unemployment rate levels.  However, there is an additional provision to the EB program that is now coming into play with negative consequences.  

As Hanna Shaw, of the Center on Budget and Policy Priorities, explains: 

A state may offer additional weeks of UI benefits through EB if its unemployment rate reaches certain thresholds . . . and if this rate is at least 10 percent higher than it was in any of the three prior years.  But unemployment rates have remained so elevated for so long that most states no longer meet this latter criterion (referred to as the “three-year lookback”). 

Because of this lookback provision hundreds of thousands of unemployed workers are now losing benefits, not because conditions are improving but because they are not continuing to worsen. The table below highlights the 25 states that have been forced to stop providing EB benefits this year and the number of workers in each state that have been cut adrift as a result.  Look at California–more than 95,000 workers have lost their benefits so far this year despite the fact that the state unemployment rate is almost 11 percent.

5-14-12ui-table.jpg

This is no accidental outcome.  In fact, according to Shaw,

Policymakers could have addressed the “lookback” when they extended federal UI at the beginning of the year, but they didn’t.  Instead, Congress not only allowed EB payments to fade out, but it also made changes that over the course of the year will reduce the number of weeks of benefits available in the temporary Emergency Unemployment Compensation (EUC) program, which provides up to 53 additional weeks to the long-term unemployed based on the unemployment rate in their state.

How serious is the long term unemployment problem?  Check out the chart below.  As it shows, the share of the labor force that is unemployed for more than 26 weeks is higher than at any point in the last six decades.  Perhaps even more striking is the fact that 41.3 percent of the 12.5 million people who were unemployed in April 2012 had been looking for work for 27 weeks or longer.

 222-ltu-opt.jpg

In terms of the master narrative, this is just another of the necessary adjustments required to stabilize the “system;” no need for alarm.  Makes you wonder about the aims of the system, doesn’t it?


Martin Hart-Landsberg is a professor of economics at Lewis and Clark College. You can follow him at Reports from the Economic Front.

This weekend is commencement at my college, Occidental, and I thought it the perfect day to post new data on the job experiences of recent graduates.  The data, a survey of 444 people in who graduated between 2007 and 2011, comes from a report out of Rutgers.

Just over half of the sample had a full-time job; 12% were un- or underemployed and looking for full-time work.

The recession appears to have depressed earnings by about $3,000. Pre-recession grads were making, on average, $30,000, while post-recession grads took in $27,000:

A third of students (35%) reported that their first job out of college was “not at all related” or “not very closely related” to their major. Almost half saw their first job as temporary and just “to get you by” (though this would drop to 36% when asked about their current job). Only half thought that their first job required a college degree.

A significant proportion of students felt that they’d had to sacrifice something important to secure their job: 27% reported that they were working below their level of education, 24% took a job that paid less than they expected to earn, and 23% were working outside of their interests and training:

Many graduates would have done things differently. Notably a third said they would have re-thought their choice of major:

And most of them would have been more likely to have chosen a professional major (e.g., education or nursing) or one in a “STEM” field (e.g., science, technology, engineering, or math).

Recession-era grads are much more likely to be getting help from their parents, compared to pre-recession grads:

Lisa Wade, PhD is an Associate Professor at Tulane University. She is the author of American Hookup, a book about college sexual culture; a textbook about gender; and a forthcoming introductory text: Terrible Magnificent Sociology. You can follow her on Twitter and Instagram.

Every once in a while we post something for those of us who are teaching (and learning) how to write.  This is one of those times.

Get it!  Because you use “i.e.” to mean “what I mean to say is” and you use “e.g.” to mean “for example.”  Cute.

From Learn Something New Every Day.

Lisa Wade, PhD is an Associate Professor at Tulane University. She is the author of American Hookup, a book about college sexual culture; a textbook about gender; and a forthcoming introductory text: Terrible Magnificent Sociology. You can follow her on Twitter and Instagram.

A crazy character named Andrew Hales, a student at Utah Valley University, has put up a series of You Tube videos in which he — knowingly or not — does a classic Sociology 101 experiment called “norm breaching”: break a simple social rule and see how people react to you.  I’ll put my favorite first, but they’re all worth a chuckle:

Holding the door open for people that are (too) far away:

Walk (too) close to people and get in their way:

Staring at people:

Some of his transgressions are more out there than others, but these experiments show how uncomfortable others can be made by even mild norm breaking.

Lisa Wade, PhD is an Associate Professor at Tulane University. She is the author of American Hookup, a book about college sexual culture; a textbook about gender; and a forthcoming introductory text: Terrible Magnificent Sociology. You can follow her on Twitter and Instagram.

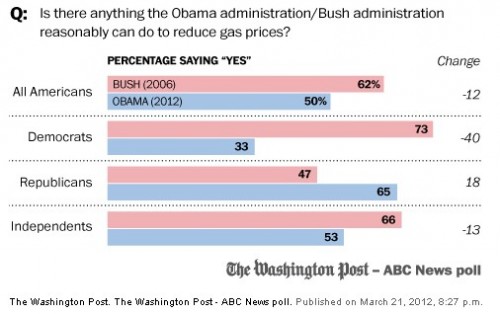
Americans were recently asked whether they believed that President Obama could do much to lower gas prices.  The answer was highly correlated with political party affiliation: 65% of Republicans said “yes,” while only33% of Democrats said the same.

In fact, the President has very little control over the price of gas.  According to the Washington Post:

Today’s oil prices are the product of years and decades of exploration, automobile design and ingrained consumer habits combined with political events in places such as Sudan and Libya, anxiety about possible conflict with Iran, and the energy aftershocks of last year’s earthquake in Japan.

An expert calls the idea that a President can substantially influence the oil market “preposterous.”

So, does this mean that Democrats are smarter about econo-geo-politics?

Nope. It just means a Democrat is in the White House.  The pollsters, WP/ABC News, asked the same question in 2006, during the Bush Administration.  That year 73% of Democrats gave President Bush some of the blame for gas prices; only 47% of Republicans did.

(Red = answered “yes” in 2006; Blue = answered “yes” in 2012)

Such switches, argues political scientist Brendan Nyhan, are typical.  NPRreports: “On a range of issues, partisans seem partial to their political loyalties over the facts. When those loyalties demand changing their views of the facts, he said, partisans seem willing to throw even consistency overboard.” Nyhan believes that the phenomenon might be related to “cognitive dissonance,” a sense of unease that comes from holding two incompatible beliefs at once.  If you like the President, in other words, it might be hard for you to also think that he could do something about gas prices, but isn’t.

Lisa Wade, PhD is an Associate Professor at Tulane University. She is the author of American Hookup, a book about college sexual culture; a textbook about gender; and a forthcoming introductory text: Terrible Magnificent Sociology. You can follow her on Twitter and Instagram.

The National Bureau of Economic Research recently released a paper by  Emin Dinlersoz and Jeremy Greenwood about unionization in the U.S.. They argue that economic shifts that changed the relative prevalence of different types of occupations partially explain decreasing union membership.

So what occupations are growing, and which are declining? Jordan Weissmann, at The Atlantic, adapted two graphs from the NBER paper that illustrate larger economic changes. Of the twenty fastest-declining occupations (in terms of % decrease), many are factory or industrial production jobs — machine operators of various types fare especially poorly (also, sorry, fellow sociologists):

The color of the graph indicates the level of unionization for each occupation; blue = less than 20%, green = 20-40%, red = over 40%. Nine of these occupations were over 40% unionized; their decline means the loss of many decently-paid jobs that provided benefits to employees without high levels of formal education.

So which occupations are growing, then? Take a look (though note this reflect % change, not overall # of employees):

Notice that top category: numerical control machine operators. Those words reflect a profound shift in manufacturing in the U.S. Numerical control machine operators program and operate computerized machinery, which requires a very different type of human operation than the classic assembly line machinery did — less input of physical labor and more technical management and troubleshooting.

Many of the other fastest-growing occupations require specialized, and often lengthy, higher education or licensing: health-diagnosing practitioners, teachers, scientists, physical therapists, and dentists, for instance. And unionization is consistently low in these types of occupations, contributing to overall declines in the prominence of unions in the U.S. over time.