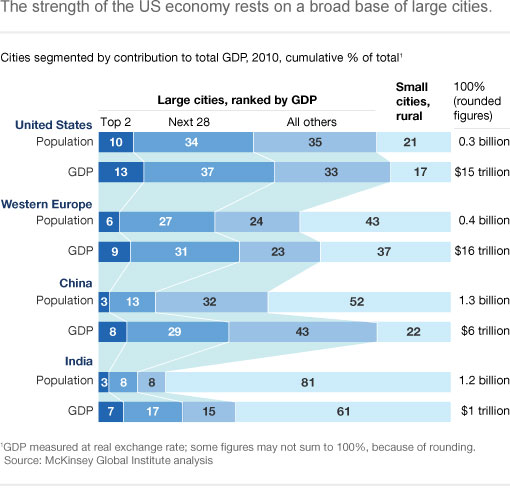
Peter Nardi, from Pitzer College, let us know that the McKinsey Global Institute recently released a report on U.S. cities and the economy. Large cities (those with 150,000+ residents), are more dominant in the U.S. than in Western Europe, China, and India. More of both the national population and economic productivity (measured by GDP) is concentrated in cities in the U.S. than in those other areas, with the exception of the concentration of GDP in large cities in China:
So overall, the vast majority of the U.S. population lives in cities, and they drive economic development and change here. But of course, the fortunes of cities within the U.S. have varied greatly. If we look at the top 30 cities (by GDP) in 1978 and 2010 (in constant 2010 dollars), we can see the decline of many older manufacturing and transportation centers in the northeast and Great Lakes areas. Milwaukee, Indianapolis, Columbus, and Buffalo fell out of the top 30 altogether, while Philly, Detroit, Pittsburgh, Cleveland, and Cincinnati experienced decreases in their contributions to the overall economy, as did three river port cities — New Orleans, Kansas City, and St. Louis. On the other hand, the Sun Belt has become much more prominent, with cities in the South and Southwest entering the top 30 or rising in the rankings (and 6 of the top 30 from California alone):

Most of the economic growth, the study finds, is due to expanding populations. Large cities aren’t becoming much more productive — cities with high overall GDP growth didn’t have higher per capita growth rates than other cities, so it isn’t that their economies are transforming in ways that make workers tremendously more productive individually. They’re growing much faster in terms of population, and that expansion pushes economic growth.

The report also found there’s no single path to successful economic growth for cities. Some with diversified local economies did very well, but others were below average; similarly, some cities that were largely dependent on just one or two economic sectors have suffered, but others did quite well. Check out the full report for a much more detailed analysis on the factors that influence the rise or decline of the economies of U.S. cities, as well as future challenges.

(Via The Atlantic.)

Raised by a racist father, Johnny Lee Clary joined the Klan in 1963 at the age of 14. By 30, he had risen through the ranks and was named the Imperial Wizard, the leader of the entire organization.  He was an outspoken advocate of white supremacy and violence against non-whites, even appearing on the Oprah Winfrey show.

In this four-minute video, he discusses his association with Reverend Wade Watts, a Black civil rights activist and member of the NAACP.  Watts expressed kindness and love towards Clary, even in the face of escalating violence (Clary ultimately set fire to his church).  Deeply affected by Watts, Clary would eventually recant his association with the KKK and join Watts in the fight against racism.

Lisa Wade, PhD is an Associate Professor at Tulane University. She is the author of American Hookup, a book about college sexual culture; a textbook about gender; and a forthcoming introductory text: Terrible Magnificent Sociology. You can follow her on Twitter and Instagram.

YetAnotherGirl sent us a link to a post at Jezebel about a sign MarketFair Mall, in New Jersey, put up (and then took down after criticism and a petition) to apologize for any inconvenience some remodeling might cause:

The sign does a couple of things. It normalizes the idea that the type of verbal harassment women often face when in public (see my post from a couple of years ago for a personal example) is, in fact, the natural outcome of how women look. Rather than feeling harassed, women should interpret such comments as the compliments they really are. Yes, yes, we can shake our heads and act annoyed, but isn’t it ultimately nice to know we look good?

The sign also reinforces a certain view of working-class masculinity, one in which working-class men are crude and lacking in basic civility, unable or unwilling to control how they express themselves, a fact that everyone else may find a bit irritating but should ultimately shrug off with a bit of a smile.

This view of working-class masculinity is reinforced in a Dutch commercial sent in by Sarah van B. The commercial is for Gamma, a chain of hardware stores in the Netherlands. In it, boys build houses out of Legos, displaying various stereotypes of rough, brutish masculinity: lack of middle-class manners (burping, nose-picking), uncontrolled bodies (belly hanging out, visible butt crack), and group harassment of women:

Sarah translates the call to the woman as “Where are those pretty little legs going?”

Such depictions normalize the harassment of women while also associating it with a general lack of sophistication, something that only the lower classes would engage in. They encourage the audience to laugh at the men who do so, finding humor in their brutish antics, but also reinforce the idea that women should just expect this type of behavior from the type of men who do manual labor.

The term glocalization — a combination of globalization and local — refers to the tendency of globalizing processes to have to adapt to local peculiarities.  McDonalds is a great example.  It’s a brand recognized around the world, but it responds to local tastes in developing its menu.  So, you can buy a McItaly burger, a Maharaja Mac in India, a McLobster in Canada, and an Ebi Filit-O with Seaweed Shaker fries in Japan (source).

I thought of the concept of glocalization when I came across a set of publicity photos for TV programs in 13 different countries, all modeled after America’s Married with Children.  Each has its own flavor (e.g., the parrot replacing the dog in Chile) and I imagine if we were able to watch them all we’d see great examples of the phenomenon.

The original:

Bulgaria:

Chile:

Croatia:

Germany:

More examples at Neatorama.

UPDATE: Dmitriy T.C. sent me this trailer for a movie called Exporting Raymond, about making a Russian version of Everybody Loves Raymond. It’s along the same theme and looks quite good:

Lisa Wade, PhD is an Associate Professor at Tulane University. She is the author of American Hookup, a book about college sexual culture; a textbook about gender; and a forthcoming introductory text: Terrible Magnificent Sociology. You can follow her on Twitter and Instagram.

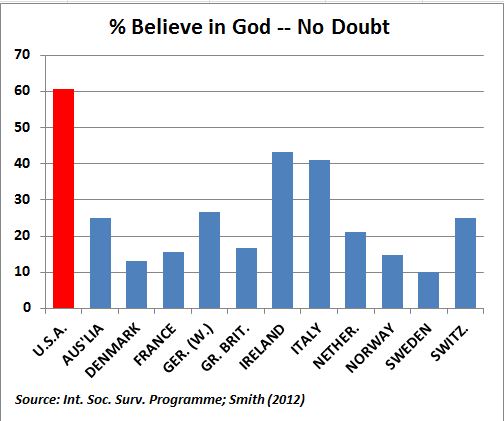
In a previous post I discussed how the U.S. became more religious in the 1950s, in part in response to its the Cold War enemies (atheist communists).  In fact, the U.S. is among the most religious countries in the world.  Using data from the International Social Survey Programme, Sociologist Tom Smith paints wildly different religious portraits of 28 nations (full text).

When asked whether they “know that God really exists and… have no doubt about it,” 61% of Americans say “yes.”  Of the 28 nations studied, only four were more likely to say “yes” to this question: Poland, Israel, Chile, and the Philippines. Here’s how we look compared to similar countries:

Here’s all 28 in rank order (borrowed from LiveScience).  Notice how wide the divergence is.  In Japan, the least religious country according to this measure, only 4% say they have no doubt God exists.  In The Philippines, 84% have no doubt.

% Have No Doubt God Exists:

  • Japan: 4.3 percent
  • East Germany: 7.8 percent
  • Sweden: 10.2
  • Czech Republic: 11.1
  • Denmark: 13.0
  • Norway: 14.8
  • France: 15.5
  • Great Britain: 16.8
  • The Netherlands: 21.2
  • Austria: 21.4
  • Latvia: 21.7
  • Hungary: 23.5
  • Slovenia: 23.6
  • Australia: 24.9
  • Switzerland: 25.0
  • New Zealand: 26.4
  • West Germany: 26.7
  • Russia: 30.5
  • Spain: 38.4
  • Slovakia: 39.2
  • Italy: 41.0
  • Ireland: 43.2
  • Northern Ireland: 45.6
  • Portugal: 50.9
  • Cyprus: 59.0
  • United States: 60.6
  • Poland: 62.0
  • Israel: 65.5
  • Chile: 79.4
  • The Philippines: 83.6

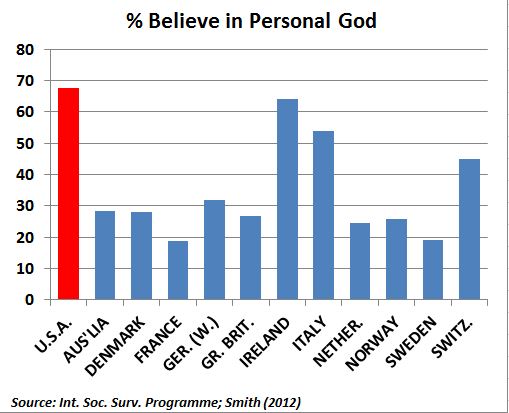
Americans are also particularly likely to believe in a “personal God,” one who is closely attentive to the lives of each and every person.

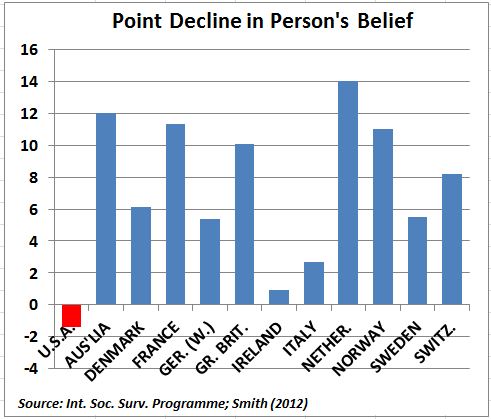
Quite interestingly, the U.S. is in the minority in that Americans tend to become increasingly religious as they age.  In most countries, people become less religious over time.  This graph (confusingly labeled), shows changes in DISbelief over the life course.  The U.S. is the only country among these in which disbelief declines:

Lifetime Change in Religiosity (from increase in disbelief to increase in belief):

  • The Netherlands: -14.0
  • Spain: -12.4
  • Australia: -12.0
  • France: -11.3
  • Norway: -11.0
  • Great Britain: -10.1
  • Switzerland: -8.2
  • Germany (East): -6.9
  • Denmark: -6.1
  • Czech Republic: -5.5
  • Sweden: -5.5
  • Germany (West): -5.4
  • New Zealand: -4.0
  • Italy: -2.7
  • Poland: -1.8
  • Japan: -1.5
  • Ireland: -0.9
  • Chile: +0.1
  • Cyprus: +0.2
  • Portugal: +0.6
  • The Philippines: +0.8
  • Hungary: +1.0
  • Northern Ireland: +1.0
  • United States: +1.4
  • Israel: +2.6
  • Slovakia: +5.6
  • Slovenia: +8.5
  • Latvia: +11.9
  • Russia: +16.0

Rates of atheism — a strong disbelief in God — also vary tremendously.  East Germany is the most atheist, with more than half of citizens claiming disbelief.  The country is a stark contrast to the atheist among them, Poland and the U.S. (only 3% atheist), Chile and Cyprus (2%), and The Phillipines (1%).

% Atheist:

  • East Germany: 52.1
  • Czech Republic: 39.9
  • France: 23.3
  • The Netherlands: 19.7
  • Sweden: 19.3
  • Latvia: 18.3
  • Great Britain: 18.0
  • Denmark: 17.9
  • Norway: 17.4
  • Australia: 15.9
  • Hungary: 15.2
  • Slovenia: 13.2
  • New Zealand: 12.6
  • Slovakia: 11.7
  • West Germany: 10.3
  • Spain: 9.7
  • Switzerland: 9.3
  • Austria: 9.2
  • Japan: 8.7
  • Russia: 6.8
  • Northern Ireland: 6.6
  • Israel: 6.0
  • Italy: 5.9
  • Portugal: 5.1
  • Ireland: 5.0
  • Poland: 3.3
  • United States: 3.0
  • Chile: 1.9
  • Cyprus: 1.9
  • The Philippines: 0.7

As a post-9/11 American watching another election cycle, I can’t help but notice how so much of our rhetoric revolves — sometimes overtly and sometimes not — around people who are the wrong religion.  Notably, Muslims.  And yet, the U.S. and many Muslim countries are alike in being strongly religious, at least in comparison to the many strongly secular countries.

This is odd because stands in contrast to recent data on American attitudes.  Within the U.S., people express much less tolerance for atheists than they do Muslims (homosexuals, African Americans, and immigrants). Weirdly, we think we have more in common with more secular nations like Great Britain than we do with countries like Pakistan or Saudi Arabia. In certain ways, the opposite might be true.

Thanks to Claude Fischer for the graphs.  Fischer, a sociologist at UC Berkeley, is the author of Made in America: A Social History of American Culture and Character.

Lisa Wade, PhD is an Associate Professor at Tulane University. She is the author of American Hookup, a book about college sexual culture; a textbook about gender; and a forthcoming introductory text: Terrible Magnificent Sociology. You can follow her on Twitter and Instagram.

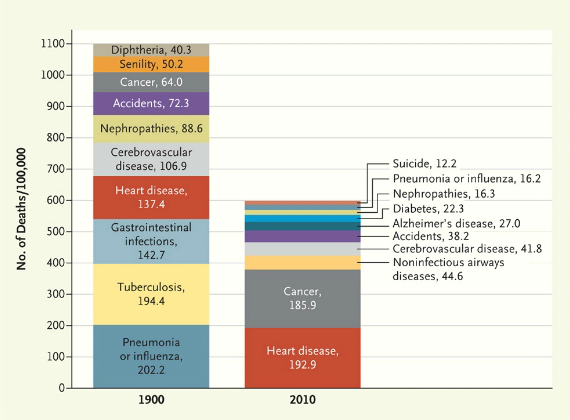
The Washington Post has provided an image from the New England Journal of Medicine that illustrates changing causes of death. Comparing the top 10 causes of death in 1900 and 2010 (using data from the Centers for Disease Control and Prevention), we see first that mortality rates have dropped significantly, with deaths from the top 10 causes combined dropping from about 1100/100,000 to about 600/100,000:

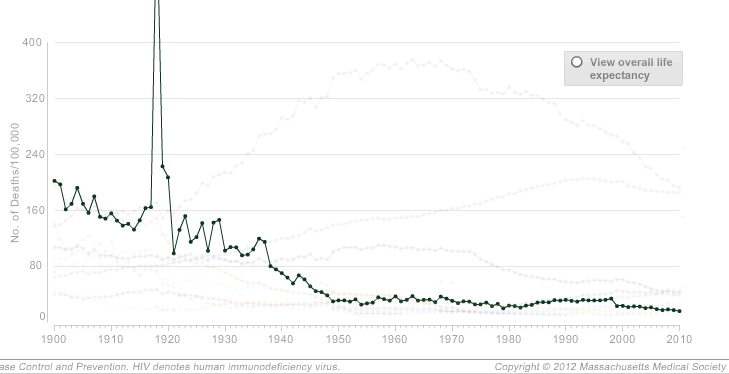
And not surprisingly, what we die from has changed, with infectious diseases decreasing and being replaced by so-called lifestyle diseases. Tuberculosis, a scourge in 1900, is no longer a major concern for most people in the U.S. Pneumonia and the flu are still around, but much less deadly than they used to be. On the other hand, heart disease has increased quite a bit, though not nearly as much as cancer.

The NEJM has an interactive graph that lets you look at overall death rates for every decade since 1900, as well as isolate one or more causes. For instance, here’s a graph of mortality rates fro pneumonia and influenza, showing the general decline over time but also the major spike in deaths caused by the 1918 influenza epidemic:

The graphs accompany an article looking at the causes of death described in the pages of NEJM since its founding in 1812; the overview highlights the social context of the medical profession. In 1812, doctors had to consider the implications of a near-miss by a cannonball, teething could apparently kill you, and doctors were concerned with a range of fevers, from bilious to putrid. By 1912, the medical community was explaining disease in terms of microbes, the population had gotten healthier, and an editorial looked forward to a glorious future:

Perhaps in 1993, when all the preventable diseases have been eradicated, when the nature and cure of cancer have been discovered, and when eugenics has superseded evolution in the elimination of the unfit, our successors will look back at these pages with an even greater measure of superiority.

As the article explains, the field of medicine is inextricably connected to larger social processes, which both influence medical practice and can be reinforced by definitions of health and disease:

Disease definitions structure the practice of health care, its reimbursement systems, and our debates about health policies and priorities. These political and economic stakes explain the fierce debates that erupt over the definition of such conditions as chronic fatigue syndrome and Gulf War syndrome. Disease is a deeply social process. Its distribution lays bare society’s structures of wealth and power, and the responses it elicits illuminate strongly held values.

I snapped this photograph of a Make a Wish Foundation advertisement at the Los Angeles International Airport.  The organization aims to grant wishes to children with life-threatening medical conditions.

Unfortunately, in this advertisement, they pigeonhole girls into the princess role.  There are five adult males in the ad with the little boy: a soccer player, a surfer, a soldier, a man in a red hat (?), and an astronaut (I’m assuming people imagine there is a man in that space suit). There is one female, and she looks to be a princess.  (Or maybe that’s supposed to be an option for the little boy in the ad? Somehow I don’t think so.)

Meanwhile, Aisha C. sent in this March of Dimes promotion, called “I’m Born To…”  It portrays children, each given a supposedly natural talent (hence, “I’m born to…”).  Each child, though, is attributed a gender stereotypical talent and future:

Lisa Wade, PhD is an Associate Professor at Tulane University. She is the author of American Hookup, a book about college sexual culture; a textbook about gender; and a forthcoming introductory text: Terrible Magnificent Sociology. You can follow her on Twitter and Instagram.

Cross-posted at Global Policy TV.

Title IX, an amendment to the Civil Rights Act of 1964, stated that “No person in the United States shall, on the basis of sex, be excluded from participation in, be denied the benefits of, or be subjected to discrimination under any education program or activity receiving Federal financial assistance…”  Passed on this day in 1972, this policy meant that schools and colleges receiving federal funding could not legally give preference to men.  Instead, they had to allocate their resources to men and women in proportion to their interest and enrollment.

The intention of the policy was to change the norms that gave preference to men in all sorts of fields, from medical schools to sports teams.  Because most schools and colleges have extensive athletics departments, sports was included among the resources that the schools were required to dole out fairly.

Accordingly, even grudging and partial compliance with the requirements of Title IX dramatically increased the opportunity for women to play sports.  In the next 35 years, women’s participation in high school and college sports would increase by 904% and 456% respectively (source).  Today, 42% of high school athletes and 45% of college athletes are women (source).

Title IX is often mistakenly accused of forcing schools to cut funding for men’s athletics.  In fact, funding for men’s athletics, as well as the number of men who play sports in school, has increased since Title IX.  The chart above also shows that men’s participation has increased by 15% in high school and 31% in college.  It’s not true, then, that Title IX has led to fewer male athletes (especially because some colleges count men as women).  Still, there is great resistance to the Amendment, with a particular emphasis on sports.  Many schools are only marginally compliant, and then only because (tireless) Title IX Officers keep pressure on institutions to follow the law.

It will be fascinating to see how changing college demographics affect the politics around Title IX.  After all, forty years later, people still argue that it’s not right that women’s sports get (almost) as much funding men’s.  Now there are more women on college campuses than men, so proportional funding may mean spending more money on women’s sports than men’s.  Fire and brimstone upon us.

Lisa Wade, PhD is an Associate Professor at Tulane University. She is the author of American Hookup, a book about college sexual culture; a textbook about gender; and a forthcoming introductory text: Terrible Magnificent Sociology. You can follow her on Twitter and Instagram.