Cross-posted at Reports from the Economic Front.

Market advocates have had their way for years now and one of the consequences has been the growing dominance of industry after industry by a select few powerful corporations.  In short, unchecked competition can and does produce its opposite: monopoly.

As John Bellamy Foster, Robert W. McChesney, and R. Jamil Jonna explain:

This [development] is anything but an academic concern. The economic defense of capitalism is premised on the ubiquity of competitive markets, providing for the rational allocation of scarce resources and justifying the existing distribution of incomes. The political defense of capitalism is that economic power is diffuse and cannot be aggregated in such a manner as to have undue influence over the democratic state. Both of these core claims for capitalism are demolished if monopoly, rather than competition, is the rule.

The chart below highlights the rise, especially since the 1980s, in both the number and percentage of U.S. manufacturing industries in which four firms account for more than 50% of sales.

Number and Percentage of U.S. Manufacturing Industries in which Largest Four Companies Accounted for at Least 50 Percent of Shipment Value in Their Industries, 1947-2007:

As the table below shows, the concentration of market power is not confined to manufacturing.

Percentage of Sales for Four Largest Firms in Selected U.S. Retail Industries:

Industry (NAICS code)  1992    1997    2002    2007
Food & beverage stores (445)  15.4    18.3    28.2    27.7
Health & personal care stores (446)  24.7    39.1    45.7    54.4
General merchandise stores (452)  47.3    55.9    65.6    73.2
Supermarkets (44511)  18.0    20.8    32.5    32.0
Book stores (451211)  41.3    54.1    65.6    71.0
Computer & software stores (443120)  26.2    34.9    52.5    73.1

As impressive as these concentration trends may be, they actually understate the market power exercised by leading U.S. firms because many of these firms are conglomerates and active in more than one industry.  The next chart provides some flavor for overall concentration trends by showing the growing share of total business revenue captured by the top two hundred U.S. corporations.  Notice the sharp rise since the 1990s.

Revenue of Top 200 U.S. Corporations as Percentage of Total Business Revenue, U.S. Economy, 1950–2008:

These are general trends.  Here, thanks to Zocalo (which draws on the work of Barry Lynn), we get a picture of the market dominance of just one corporation–Procter and Gamble.  This corporation controls:

  • More than 75 percent of men’s razors
  • About 60 percent of laundry detergent
  • Nearly 60 percent of dishwasher detergent
  • More than 50 percent of feminine pads
  • About 50 percent of toothbrushes
  • Nearly 50 percent of batteries
  • Nearly 45 percent of paper towels, just through the Bounty brand
  • Nearly 40 percent of toothpaste
  • Nearly 40 percent of over-the-counter heartburn medicines
  • Nearly 40 percent of diapers.
  • About 33 percent of shampoo, coffee, and toilet paper

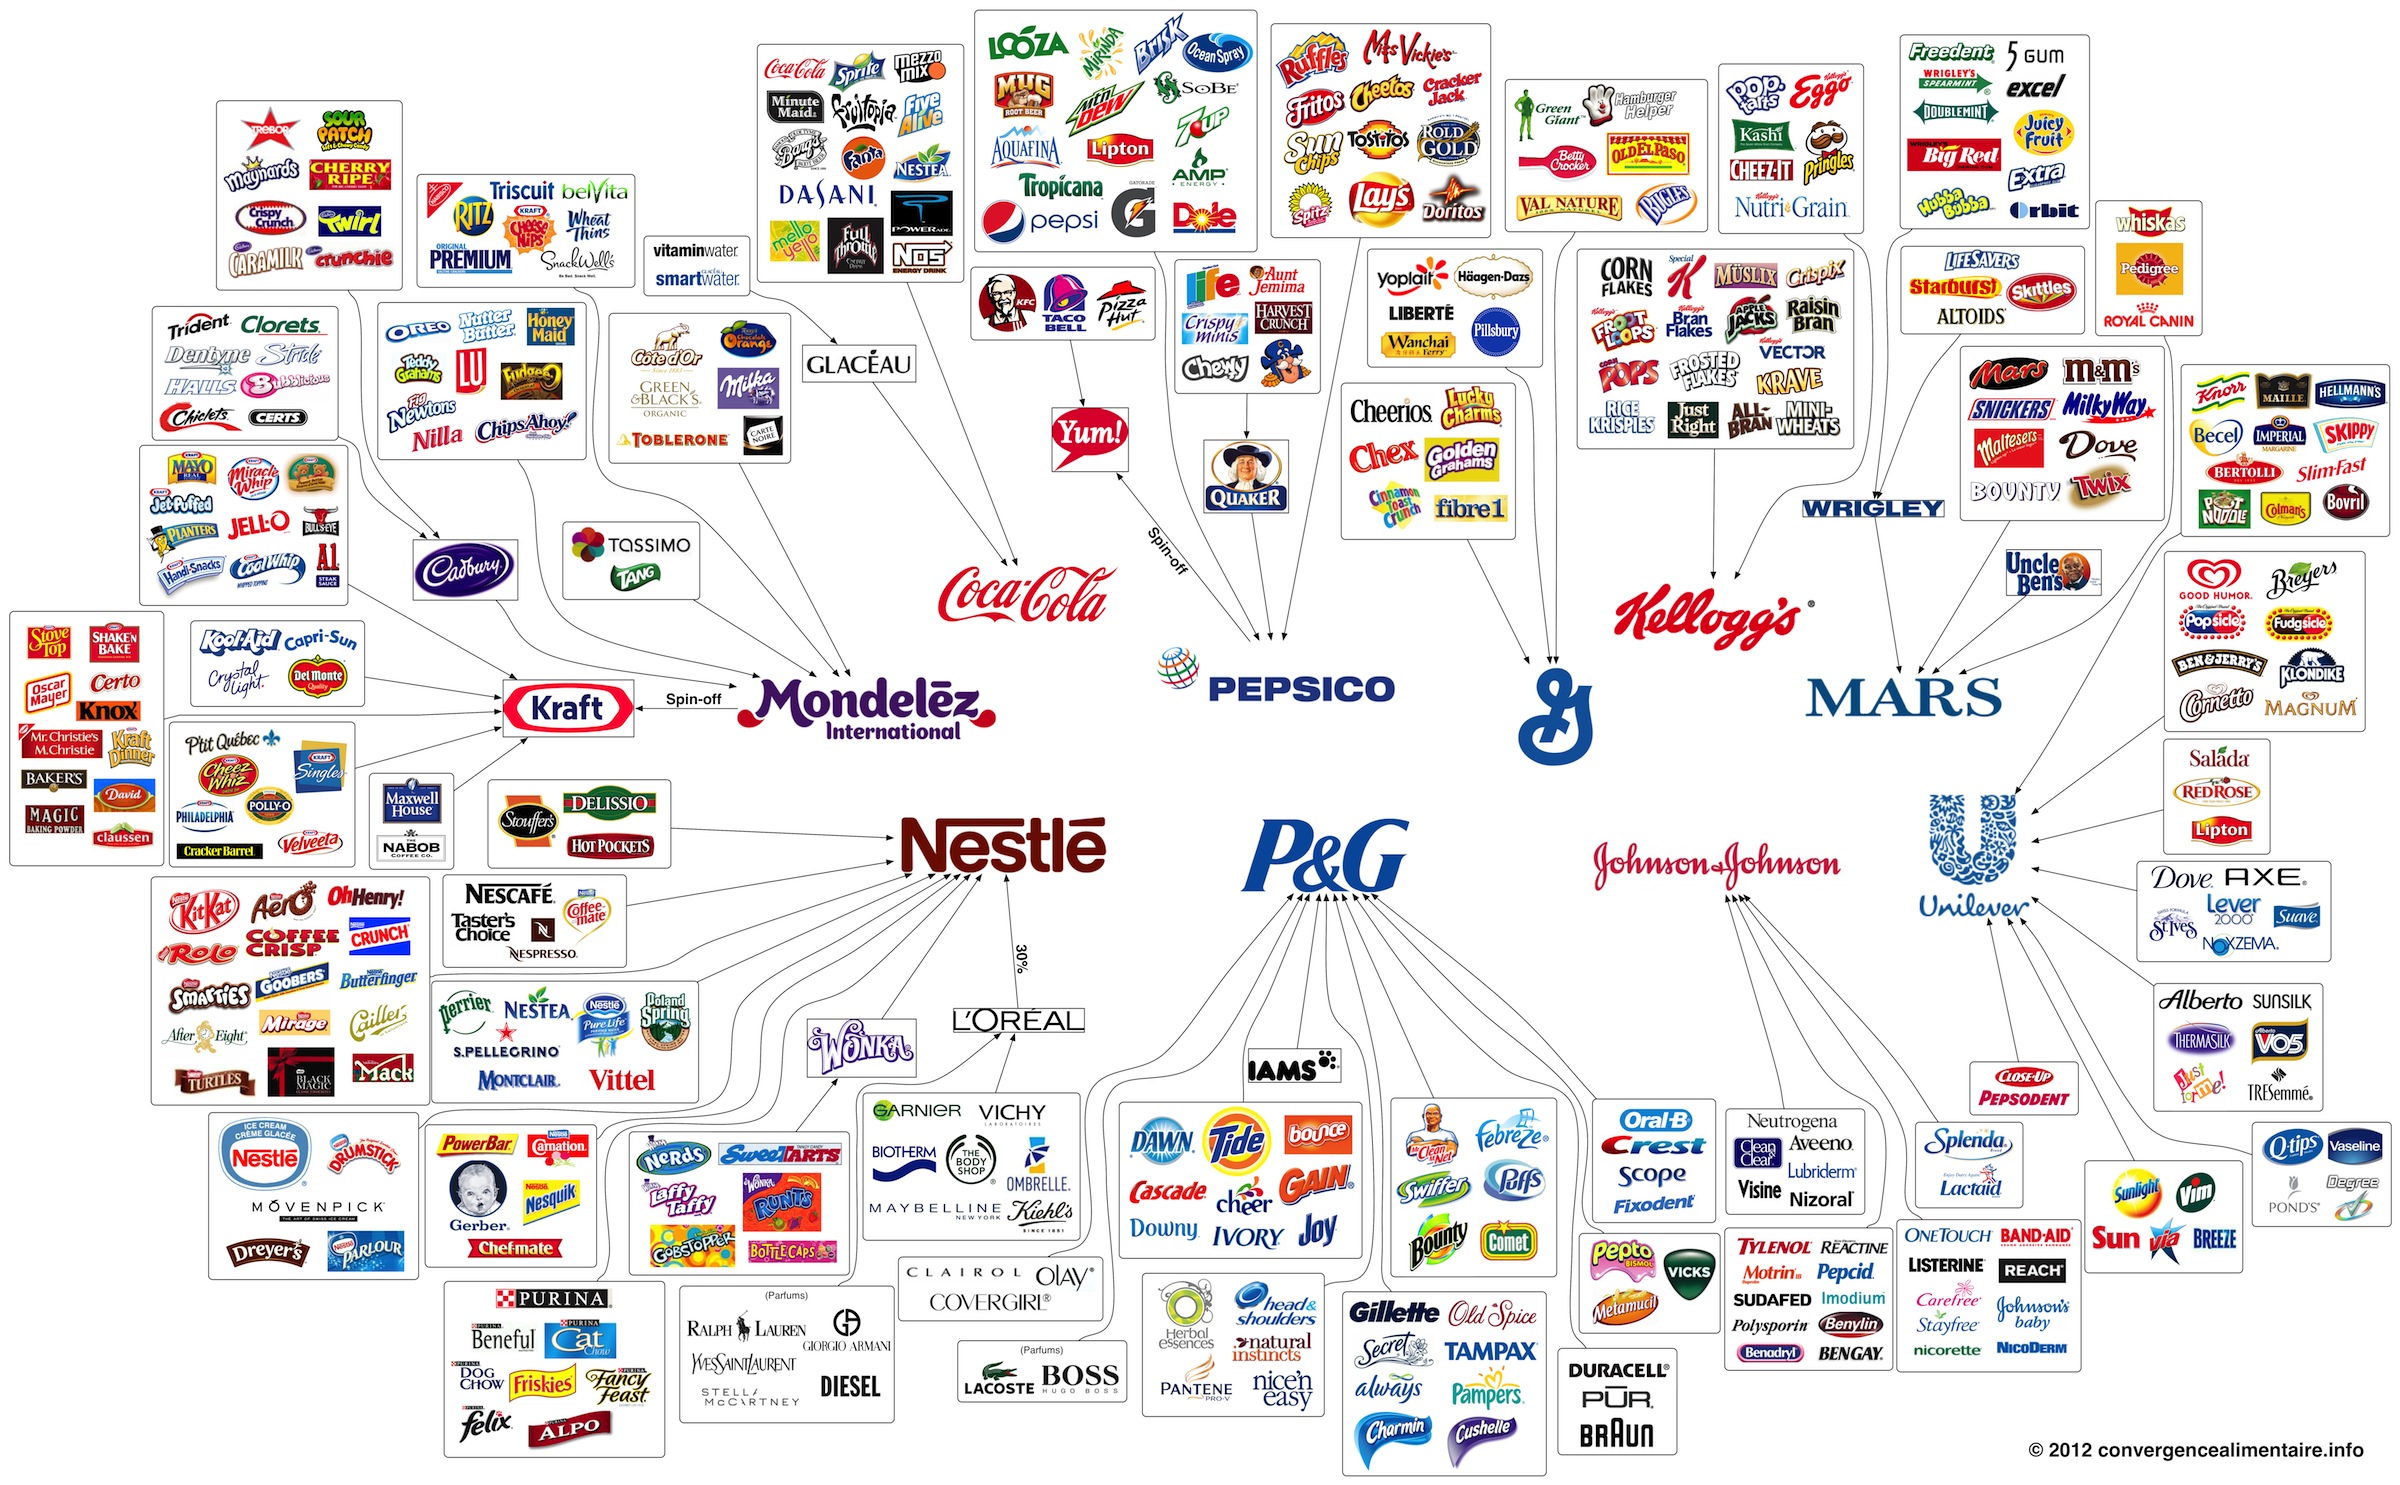
A recent Huffington Post blog post, which includes the following infographic from the French blog Convergence Alimentaire, makes clear that Procter and Gamble, as big as it is, is just one member of a small but powerful group of multinationals that dominate many consumer markets.   The blog post states: “A ginormous number of brands are controlled by just 10 multinationals… Now we can see just how many products are owned by Kraft, Coca-Cola, General Mills, Kellogg’s, Mars, Unilever, Johnson & Johnson, P&G and Nestlé. ”   See here for a bigger version of the infographic.

And, it is not just the consumer goods industry that’s highly concentrated.  As the Huffington Post also noted: “Ninety percent of the media is now controlled by just six companies, down from 50 in 1983…. Likewise, 37 banks merged to become JPMorgan Chase, Bank of America, Wells Fargo and CitiGroup in a little over two decades, as seen in this 2010 graphic from Mother Jones.”

Not surprisingly, there are complex interactions and struggles between these dominant companies.  Unfortunately, most end up strengthening monopoly power at the public expense.  For example, as Zocalo reports, Wal-Mart, Target, and other major retailers have adopted a new control strategy in which:

…these retailers name a single supplier to serve as a category captain. This supplier is expected to manage all the shelving and marketing decisions for an entire family of products, such as dental care.

The retailer then requires all the other producers of this class of products — these days, usually no more than one or two other firms — to cooperate with the captain. The consciously intended result of this tight cartelization is a growing specialization of production and pricing among the few big suppliers who are still in business…

It’s not that Wal-Mart and category copycats like Target cede all control over shelving and hence production decisions to these captains. The trading firms use the process mainly to gain more insight into the operations of the manufacturers and hence more leverage over them, their suppliers, and even their other clients… Wal-Mart, for instance, has told Coca-Cola what artificial sweetener to use in a diet soda, it has told Disney what scenes to cut from a DVD, it has told Levi’s what grade of cotton to use in its jeans, and it has told lawn mower makers what grade of steel to buy.

And don’t think that such consolidation within the Wal-Mart system makes it easier for new small manufacturers and retailers to rise up and compete. The exact opposite tends to be true. . . . This [system] boils down to presenting the owners of midsized and smaller companies, like Oakley or Tom’s of Maine, with the “option” of selling their business to the monopolist in exchange for a “reasonable” sum determined by the monopolist.

This was the message delivered to many of the companies that in recent decades managed to develop big businesses seemingly outside the reach of the Procter & Gambles, Krafts, and Gillettes of the world. Consider the following:

  • Ben & Jerry’s, the Vermont ice cream company that reshaped the industry, was swallowed by Unilever in 2000.
  • Cascadian Farm, one of the most successful organic food companies, sold out to General Mills and was promptly transformed into what its founder calls a “PR farm.”
  • Stonyfield Farm and Brown Cow, organic dairy companies from New Hampshire and California, respectively, separately sold con-trol to the French food giant Groupe Danone in February 2003 and were blended into a single operation.
  • Glaceau, the company behind the brightly colored Vitamin Water and one of the last independent success stories, sold out to Coca-Cola in 2007.

The practical result is a hierarchy of power in which a few immense trading companies — in control of and to some degree in cahoots with a few dominant supply conglomerates — govern almost all the industrial activities on which we depend, and they back their efforts with what amounts to police power. This tiny confederation of private corporate governments determines who wins and who loses in this country, at least within our consumer economy.

Of course the growing concentration nationally is matched by a growing concentration of power globally, with large transnational corporations from different nations battling each other and, in many cases, uniting through mergers and acquisitions.  We cannot hope to understand and overcome our current problems and the structural pressures limiting our responses to them without first acknowledging the extent of corporate dominance over our economic lives.

—————————

Martin Hart-Landsberg is a professor of Economics and Director of the Political Economy Program at Lewis and Clark College.  You can follow him at Reports from the Economic Front.

I know everyone is tired of hearing or thinking about the U.S. presidential election, but Latino Decisions has released an interactive website that shows how Latinos/as in the U.S. voted, as well as the issues they found particularly important.

In many of the swing states, Latinos formed an essential part of President Obama’s winning coalition of voters. As you may have heard by now, Latinos voted overwhelmingly Democratic, with about 3/4 voting for President Obama:

But this varied by ancestry. Among Cuban Americans, only 44% supported Obama, while he received 96% of votes cast by Dominican Americans, 78% by Mexican Americans, 83% by Puerto Ricans, 76% by Central Americans, and 79% by South Americans (hover over the graph here to see the %s):

Language also made a difference. Among those who speak primarily English, Obama got 70% of the vote; among those who speak Spanish, it was 83%:

Religion was an even bigger factor. While 81% of Catholic Latinos voted for President Obama, he got a much smaller majority — 54% — among those who identified as born-again Christians:

The website also lets you get specific data on a number of swing states or states with large or growing Latino populations, as well as breakdowns of the issues that Latino voters said were most important to them. It’s an interesting website with a lot of breakdowns, so it’s worth clicking over and looking around.

Gwen Sharp is an associate professor of sociology at Nevada State College. You can follow her on Twitter at @gwensharpnv.

While the news often discusses the proportion of the population that is unemployed, sociologists also talk about the working poor (people with full time jobs, but who are paid so little that they remain below the poverty line) and the underemployed (e.g., people who have part-time jobs, but wish they were full-time).

The New York Times recently put together a graphic illustrating the rise of underemployment due to the recession. Overall, the number of people who are working part-time involuntarily has risen.  In the related article, reporter Steven Greenhouse quotes a retail consultant explaining: “Over the past two decades, many major retailers went from a quotient of 70 to 80 percent full-time to at least 70 percent part-time across the industry.”  Underemployment has risen in some economic sectors more than others, notably leisure/hospitality and wholesale/retail:

Among other employers, Greenhouse profiles a Fresh & Easy store in San Diego. Employed there are 5 full-time managers and 17 part-time workers.  Shannon Hardin, who has worked there for five years, averages 28 hours a week and earns $10.90 an hour.

Workers like Hardin often get very short shifts (designed to increase the number of employees in the store only during rush times), irregular schedules (making it difficult to arrange childcare), and last minute requests to work.  Being inflexible can get an employee fired.

This is why employers like part-timers; from the company’s perspective, they’re cheap and flexible:

From the employee’s perspective, of course, it means a meager existence, an uncertain future, and a life led at the whims of a company’s bottom line.

Lisa Wade, PhD is an Associate Professor at Tulane University. She is the author of American Hookup, a book about college sexual culture; a textbook about gender; and a forthcoming introductory text: Terrible Magnificent Sociology. You can follow her on Twitter and Instagram.

…voting rights still excluded certain groups?

Buzzfeed has put together a great collection of U.S. maps showing what last Tuesday’s election would have looked like if women, non-whites, and 18- to 23-year-olds had never been given the vote.

Actual results:

Results with just white men:

Results with only men, all races:

Results with only white people, men and women:

Results excluding people 18- to 23-years-old:

The results are stunning and are a hint of just how consequential the ongoing voter suppression and disenfranchisement can be.

Lisa Wade, PhD is an Associate Professor at Tulane University. She is the author of American Hookup, a book about college sexual culture; a textbook about gender; and a forthcoming introductory text: Terrible Magnificent Sociology. You can follow her on Twitter and Instagram.

Wanna get clear on the relationship between sex, gender identity, sexual and romantic orientation, sexual behavior, and gender role?  Watch this video by the Vlog Brothers, sent in by Jeffrey B.:

UPDATE: Comments closed.

Lisa Wade, PhD is an Associate Professor at Tulane University. She is the author of American Hookup, a book about college sexual culture; a textbook about gender; and a forthcoming introductory text: Terrible Magnificent Sociology. You can follow her on Twitter and Instagram.

I’ve posted more than once, and gleefully, about the weird American habit we have of associating dogs with men and cats with women.

Well, Adrienne H. sent in a particularly humorous example: an advertising image from Pajamagram, featuring “hoodie-footies” for the entire family.  They are color-coded — pink for girls, blue for boys — all the way down to the dog and cat.

So, there you have it; I’m not crazy after all.

Lisa Wade, PhD is an Associate Professor at Tulane University. She is the author of American Hookup, a book about college sexual culture; a textbook about gender; and a forthcoming introductory text: Terrible Magnificent Sociology. You can follow her on Twitter and Instagram.

Last spring I posted a map of the legal status of same-sex marriage in the U.S. Given the results of the election, it’s time to update that map.

Greg Stoll posted an interactive map that lets you look at changes in in statutes regarding same-sex marriage from 1990 to now. On Tuesday, voters in Maine and Maryland approved referendums legalizing same-sex marriage, reaffirmed marriage equality in Washington, and defeated an effort to put a ban on same-sex marriages in the Minnesota constitution. That makes this this first time same-sex marriage was legalized by voters, rather than a legislature or the courts. (NOTE: As a reader pointed out, there’s an error in the map; Maryland should be colored blue now.)

Here’s the current map, with blue states having full marriage equality and red states banning both same-sex marriage as well as civil unions in their constitutions:


Gwen Sharp is an associate professor of sociology at Nevada State College. You can follow her on Twitter at @gwensharpnv.

A while back, David Dismore posted about his archive of suffragist postcards, which appeared in the early 1900s as part of the campaign for women’s right to vote. The postcards got the messages of the movement across in short, clear, and often humorous ways.

Those opposed to women’s suffrage also used postcards to get their message out to the public. The Palczewski Postcard Archive at the University of Northern Iowa, sent to us by Katrin, has a number of great examples that illustrate the frames used to present women’s full political participation as threatening.

For instance, a 12-card series produced by Dunston-Weiler Lithographic Company presented suffrage as upending the gender order by masculinizing women and feminizing men. Suffragists, the postcards tell us, cause women to abandon their household duties and become aggressive and unladylike:

In an effort to win her own rights, then, women make their families suffer — a message complete with visuals that don’t seem out of place among stock images of crying babies and their working mothers today, as Katrin pointed out:

Equality in voting rights is clearly presented as female domination:

Postcards issued by other groups reflect these same themes. The clear message is that giving women the right to vote threatens men, the family, and the entire natural order of things:

The archive has a bunch more examples, categorized by various themes — including Cats and Suffrage, because lolcats are timeless.

Gwen Sharp is an associate professor of sociology at Nevada State College. You can follow her on Twitter at @gwensharpnv.