Search results for inequality

Why did people march on January 21, 2017? As a team of sociologists interested in social movements, we know there are many possible answers to this seemingly simple question.

As a team of sociologists we have developed a multi-method, multi-site research project, Mobilizing Millions: Engendering Protest Across the Globe.* We want to understand why people participate in a march of this scale, at a critical historical juncture in our political landscape. Within weeks of discussion of the first march, there were already “sister” march pages national and internationally. While it is beyond the scope of this post to discuss all of the project findings thus far, the predictability of the racial tensions visible in social media or the role of men, local opportunities and challenges we do offer some early findings.

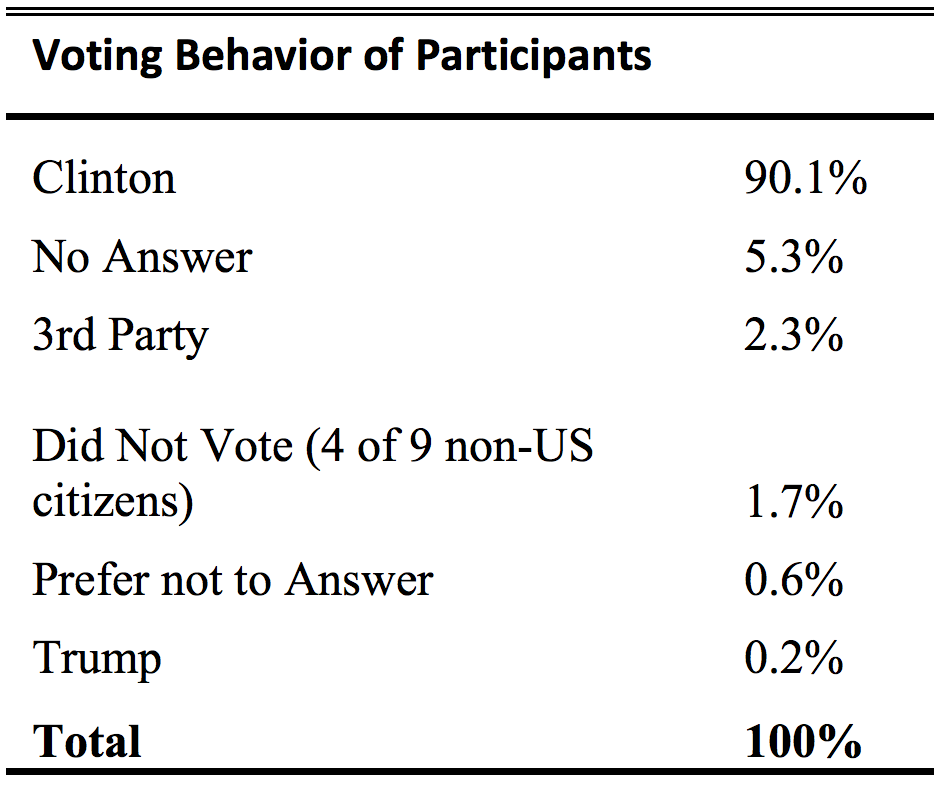
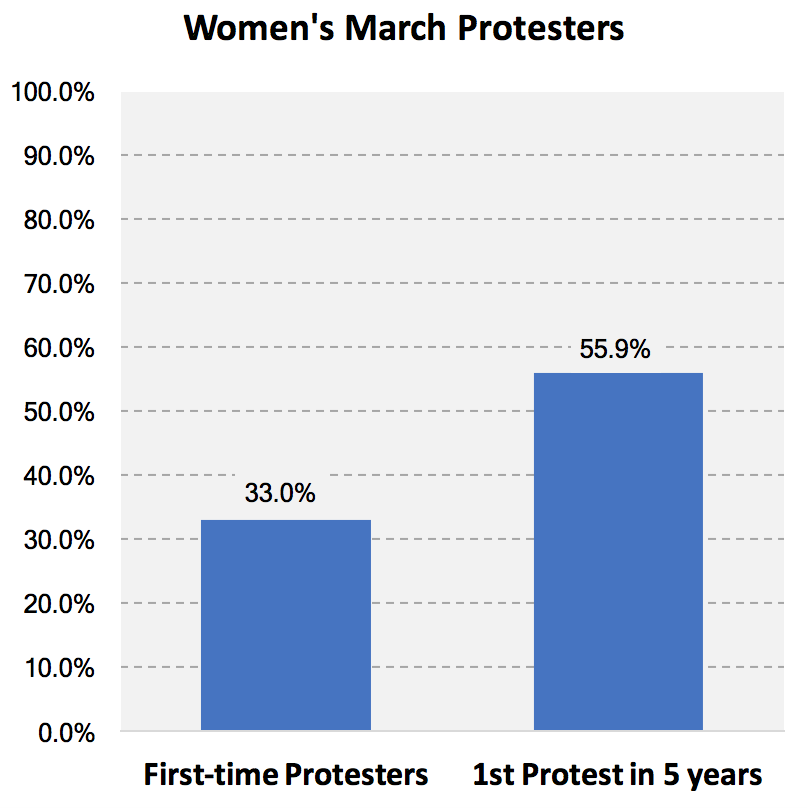
In the project’s first phase, we had team members on the ground in Washington D.C.; Austin, TX; Boston, MA; Los Angeles, CA; New York, NY; Philadelphia, PA;  Portland, OR; Santa Barbara, CA and St. Louis, MO. We are currently conducting a survey about the motivations and experiences that brought millions of people to the marches worldwide. We recruited respondents from marches in the aforementioned cities, and online. This has resulted in responses from around the world. Our preliminary findings from the observations and survey highlight that 1) there were a range of reasons people attended marches and 2) across and within sites, there were varying experiences of “the” march in any location.

One striking similarity we observed across sites was the limited visible presence of social movement organizations (SMOs). For sure, SMOs became visible in social media leading up to the event (particularly for the DC march). Unlike at social movement gatherings such as the US Social Forum or conservative equivalents, the sheer number of unaffiliated people dwarfed any delegations or representatives from SMOs. Of our almost 60-member nation-wide team across sites only a handful had encountered anyone handing out organizational material, as we would see at other protest. This is perhaps what brought many people to the march—an opportunity to be an individual connecting with other individuals. However, this is an empirical question as is what this means for the future of social movement organizing. We hope others join us in answering.

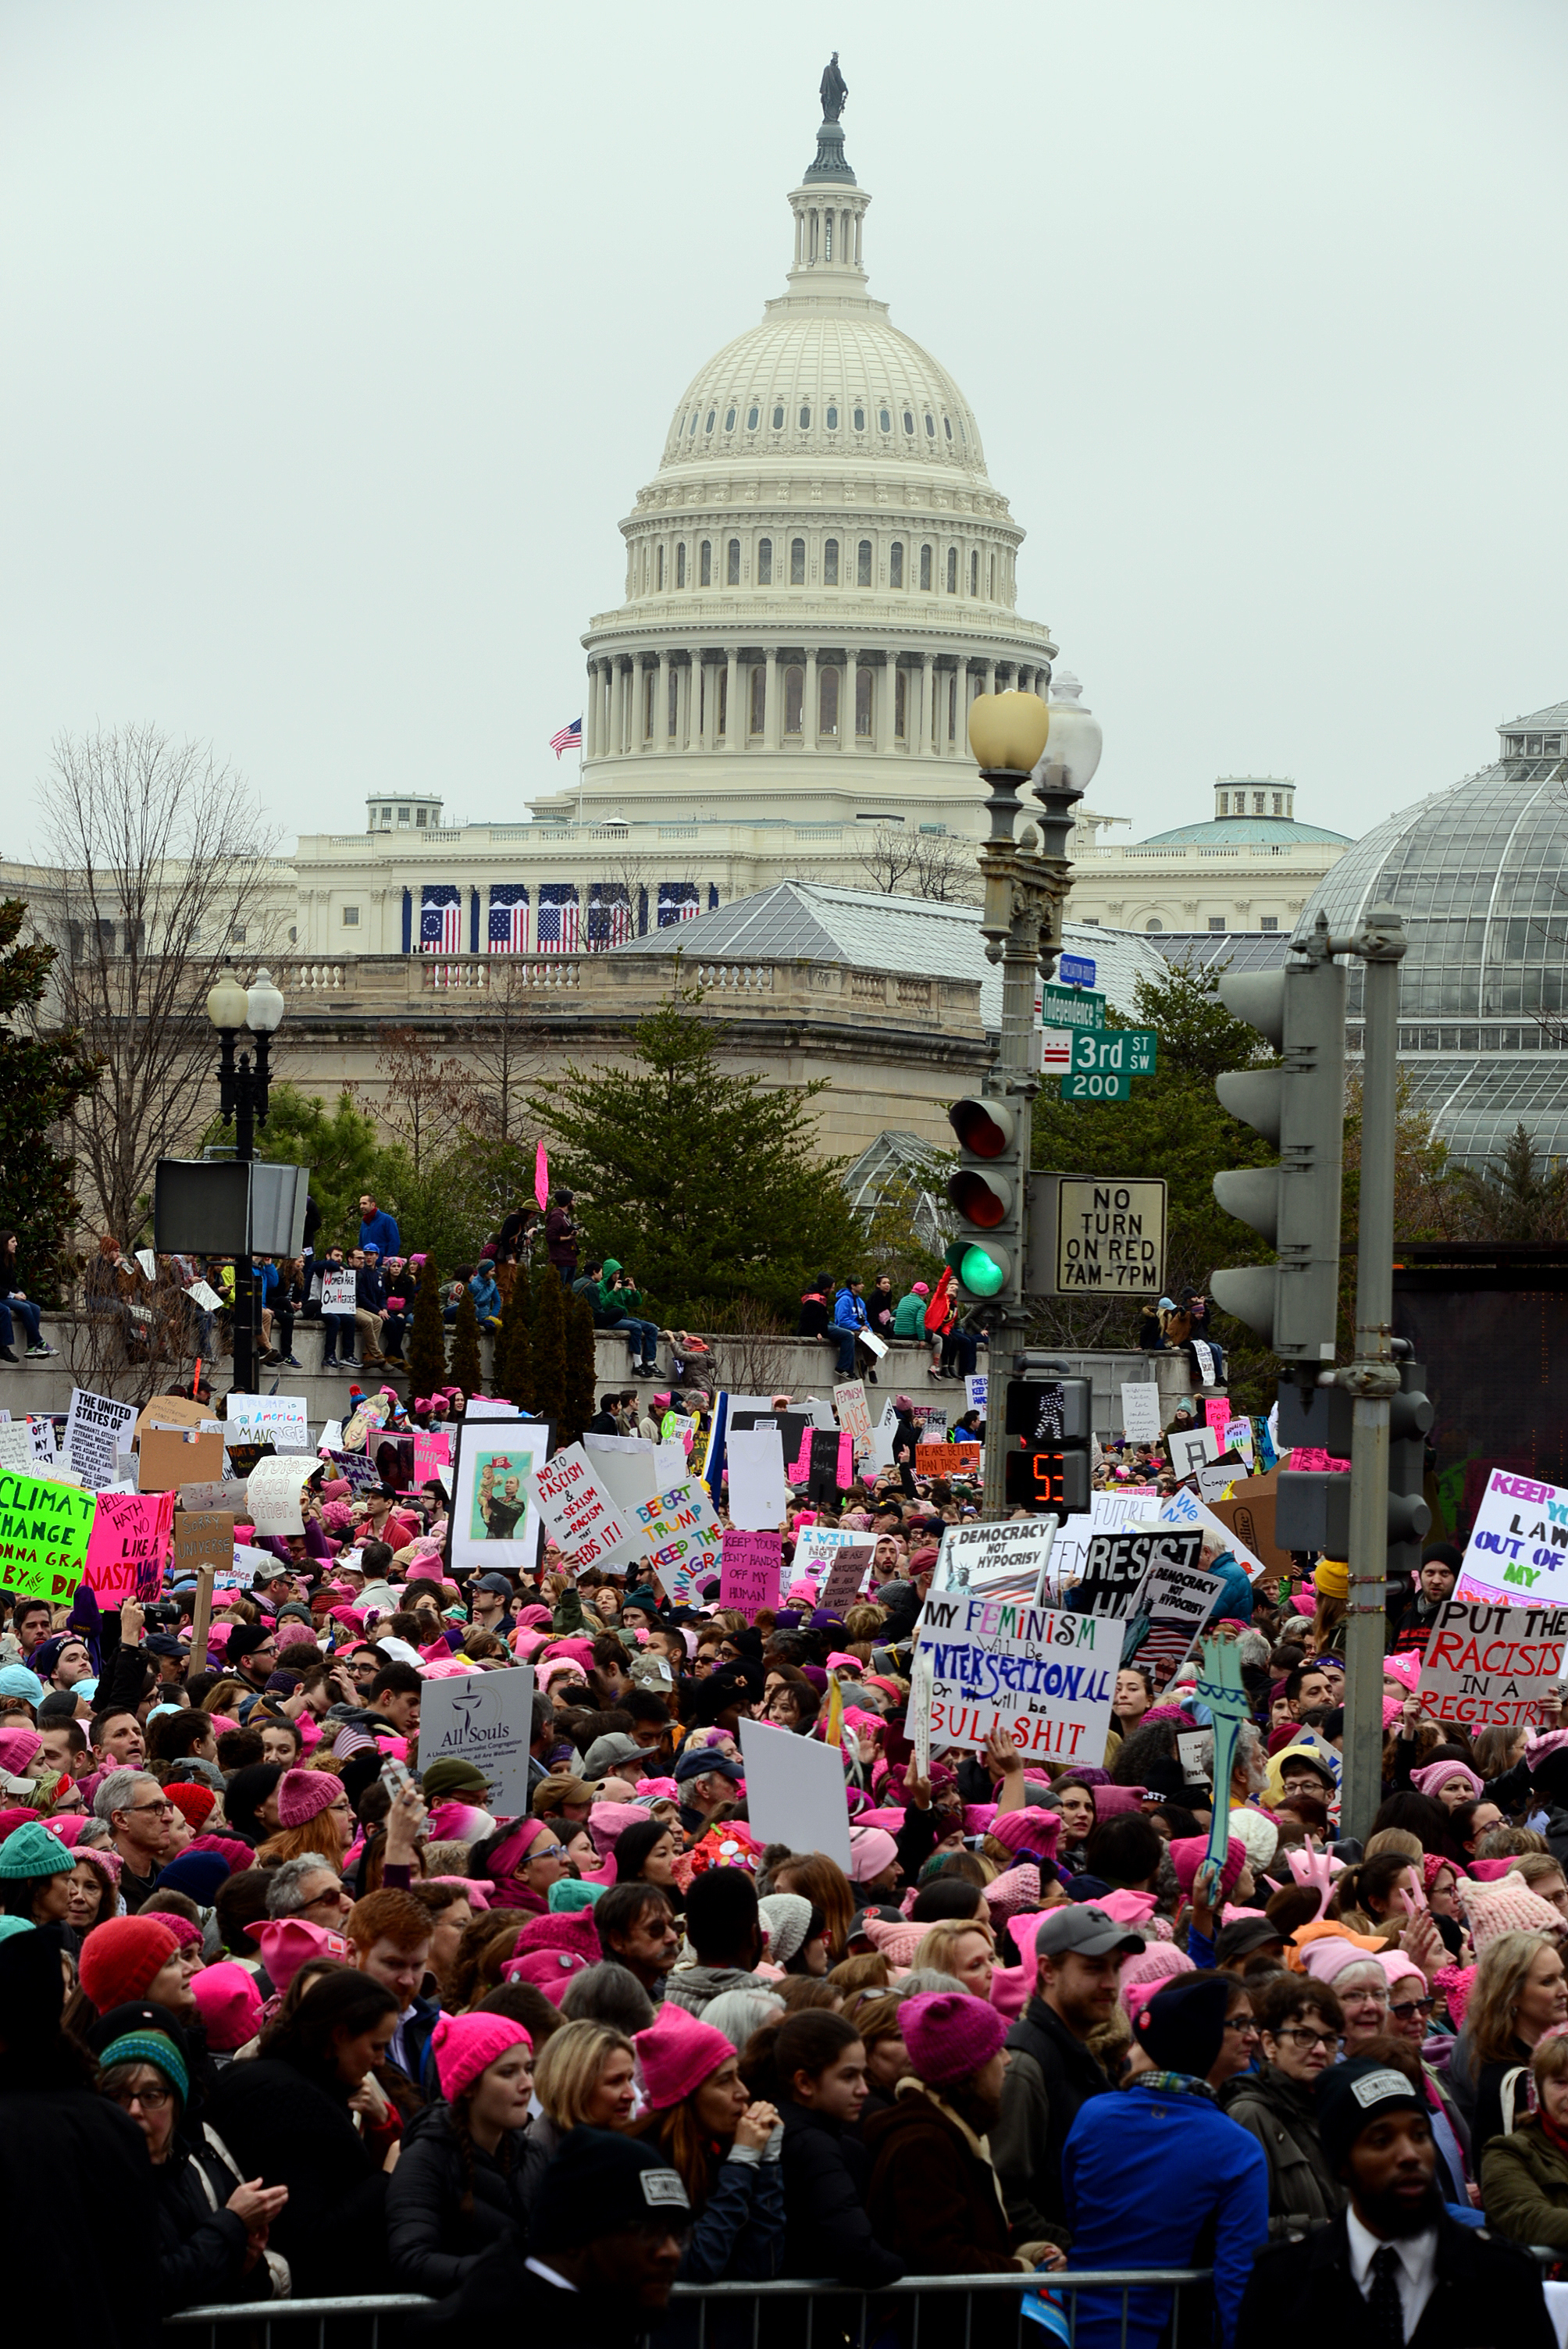
Second, while the energy was palpable at all of the marches so was the confusion. As various media sources reported, attendance at all sites far exceeded projections, sometimes by 10 times. Consequently, the physical presence of the expanded beyond organizers’ expectations, which in many places required a schedule shifted. At all marches there were points where participants in central areas could not move and most people could not hear scheduled speakers even if they were physically close to a stage.  Across the sites, we also observed how this challenge stimulated different responses. In multiple locations, people gathering spontaneously created their own sub-marches out of excitement as happened in DC when a band started playing on Madison street and people followed. Or, while waiting, waiting participants chanted “march, march.” Still, in many locations, once the official march started, people created sub-marches out of necessity because the pre-planned march route was impassable. When faced with standing for an hour to wait their “turn” to walk or create an alternative, they chose the latter.

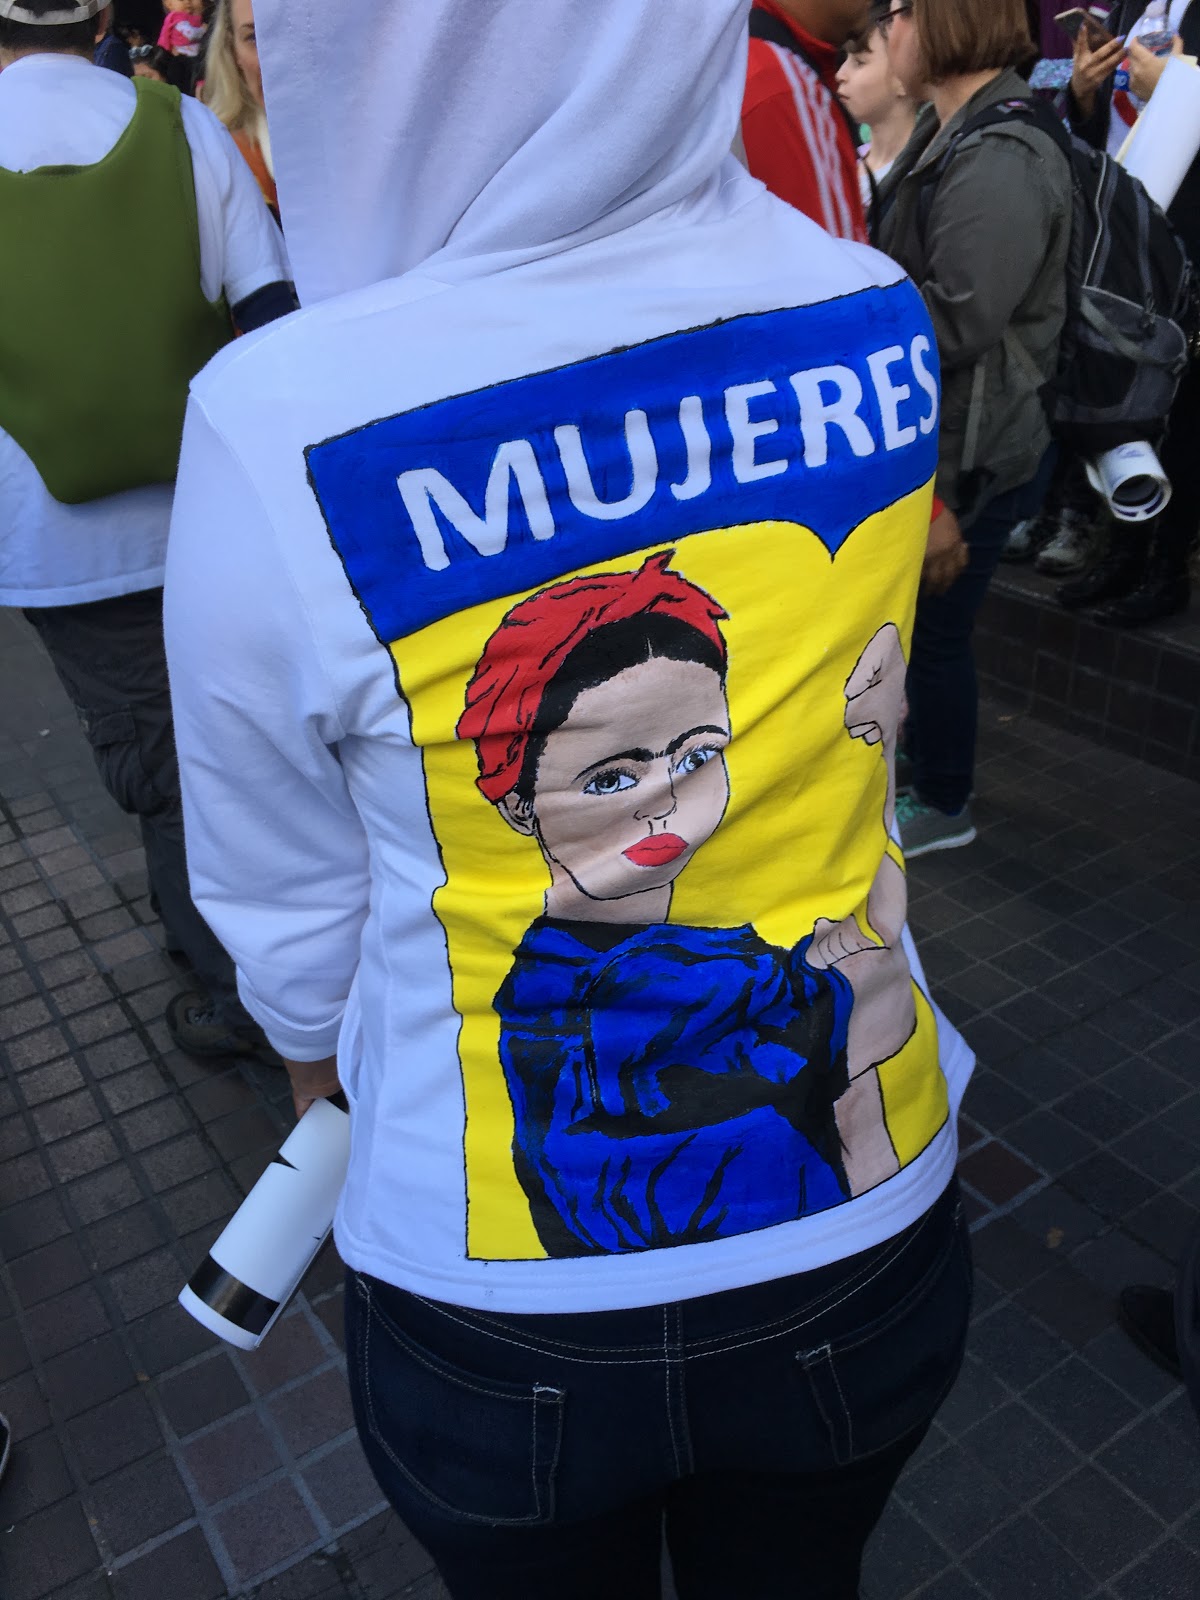
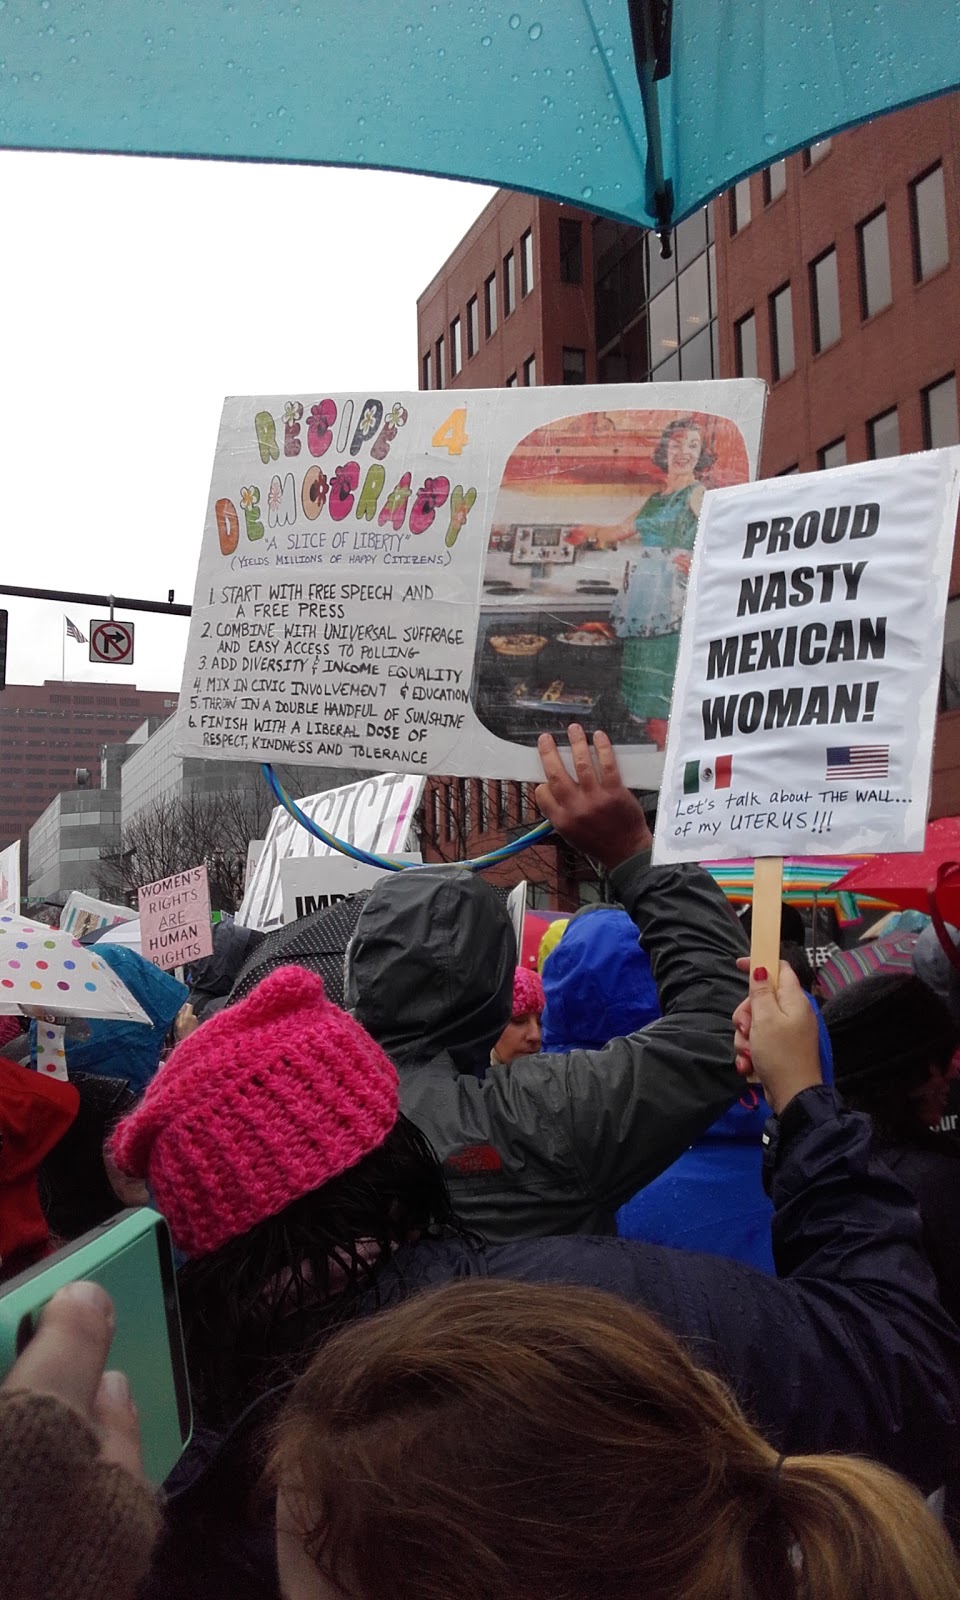
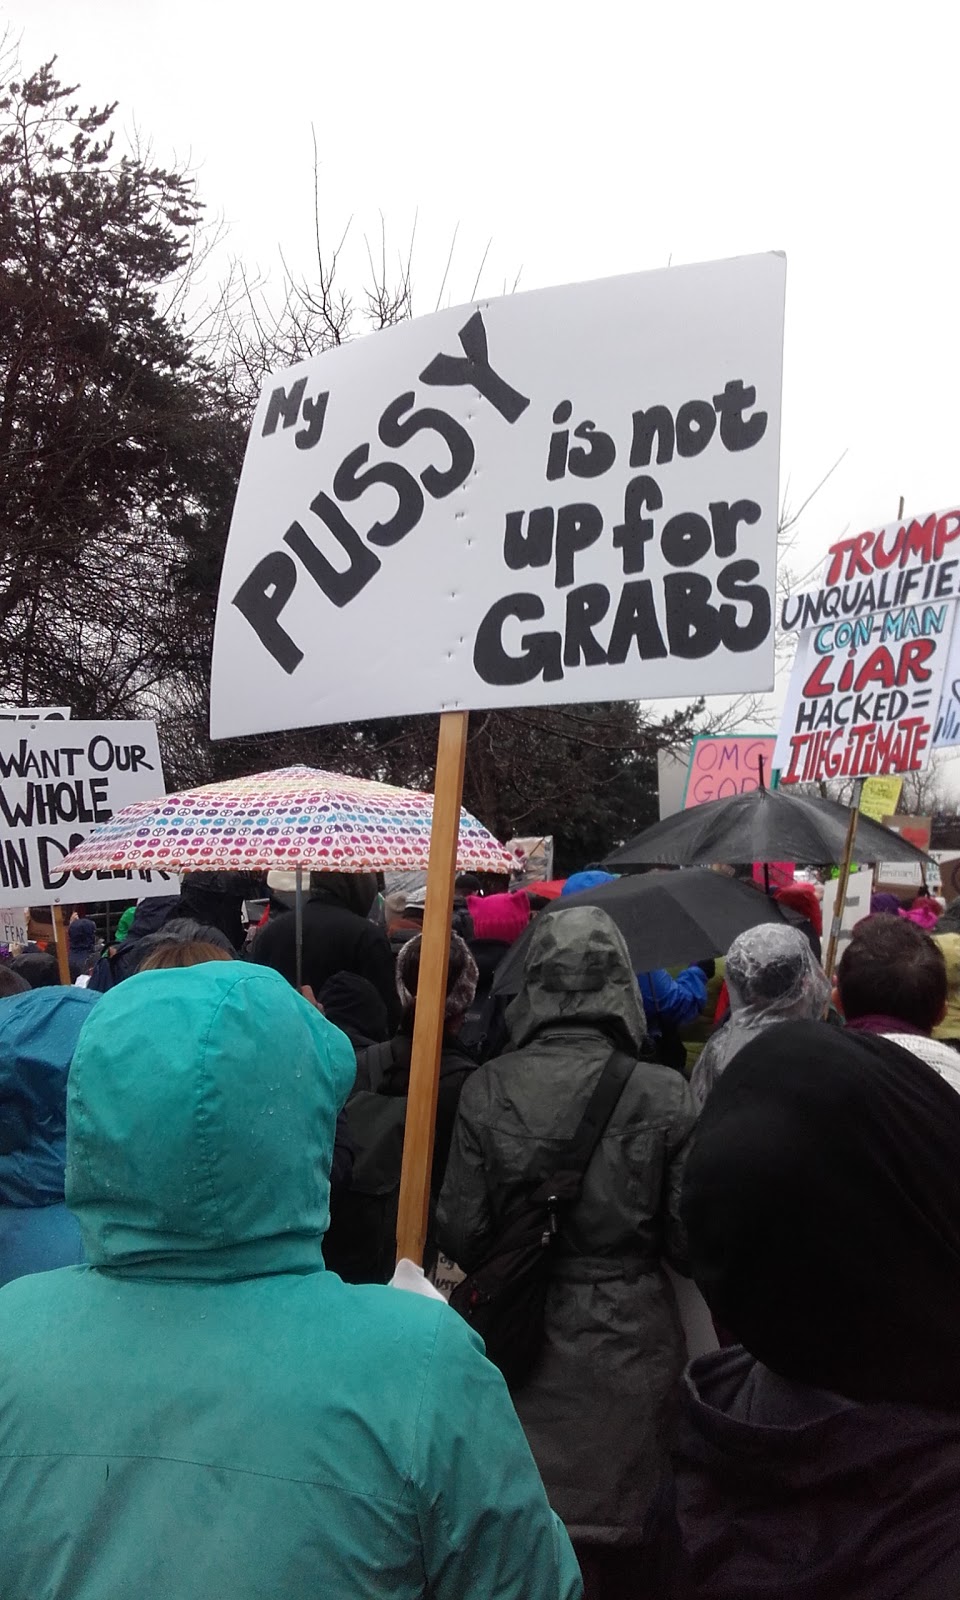
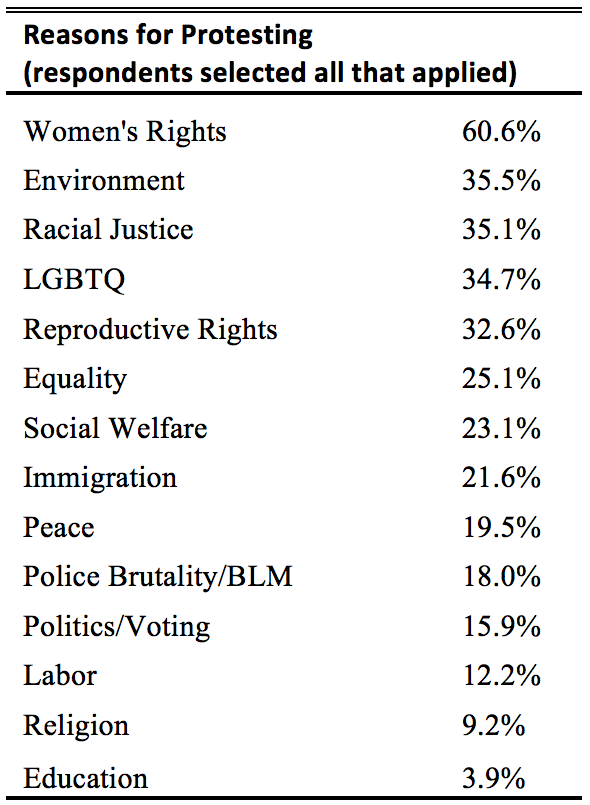
Creativity was visible in artistic forms as well. While there were professionally printed signs (and T-shirts), there was a wealth of handmade signs at the marches. As expected, a slew that referenced phrases the president-elect had said noting, for example, “this pussy grabs back.” Yet there was also a range of other signs ranging from simple text to complicated storyboards (see below).

Across sites, we also saw many differences: including which types of organizations sponsored (or “supported” or “ were affiliated with”) that march.

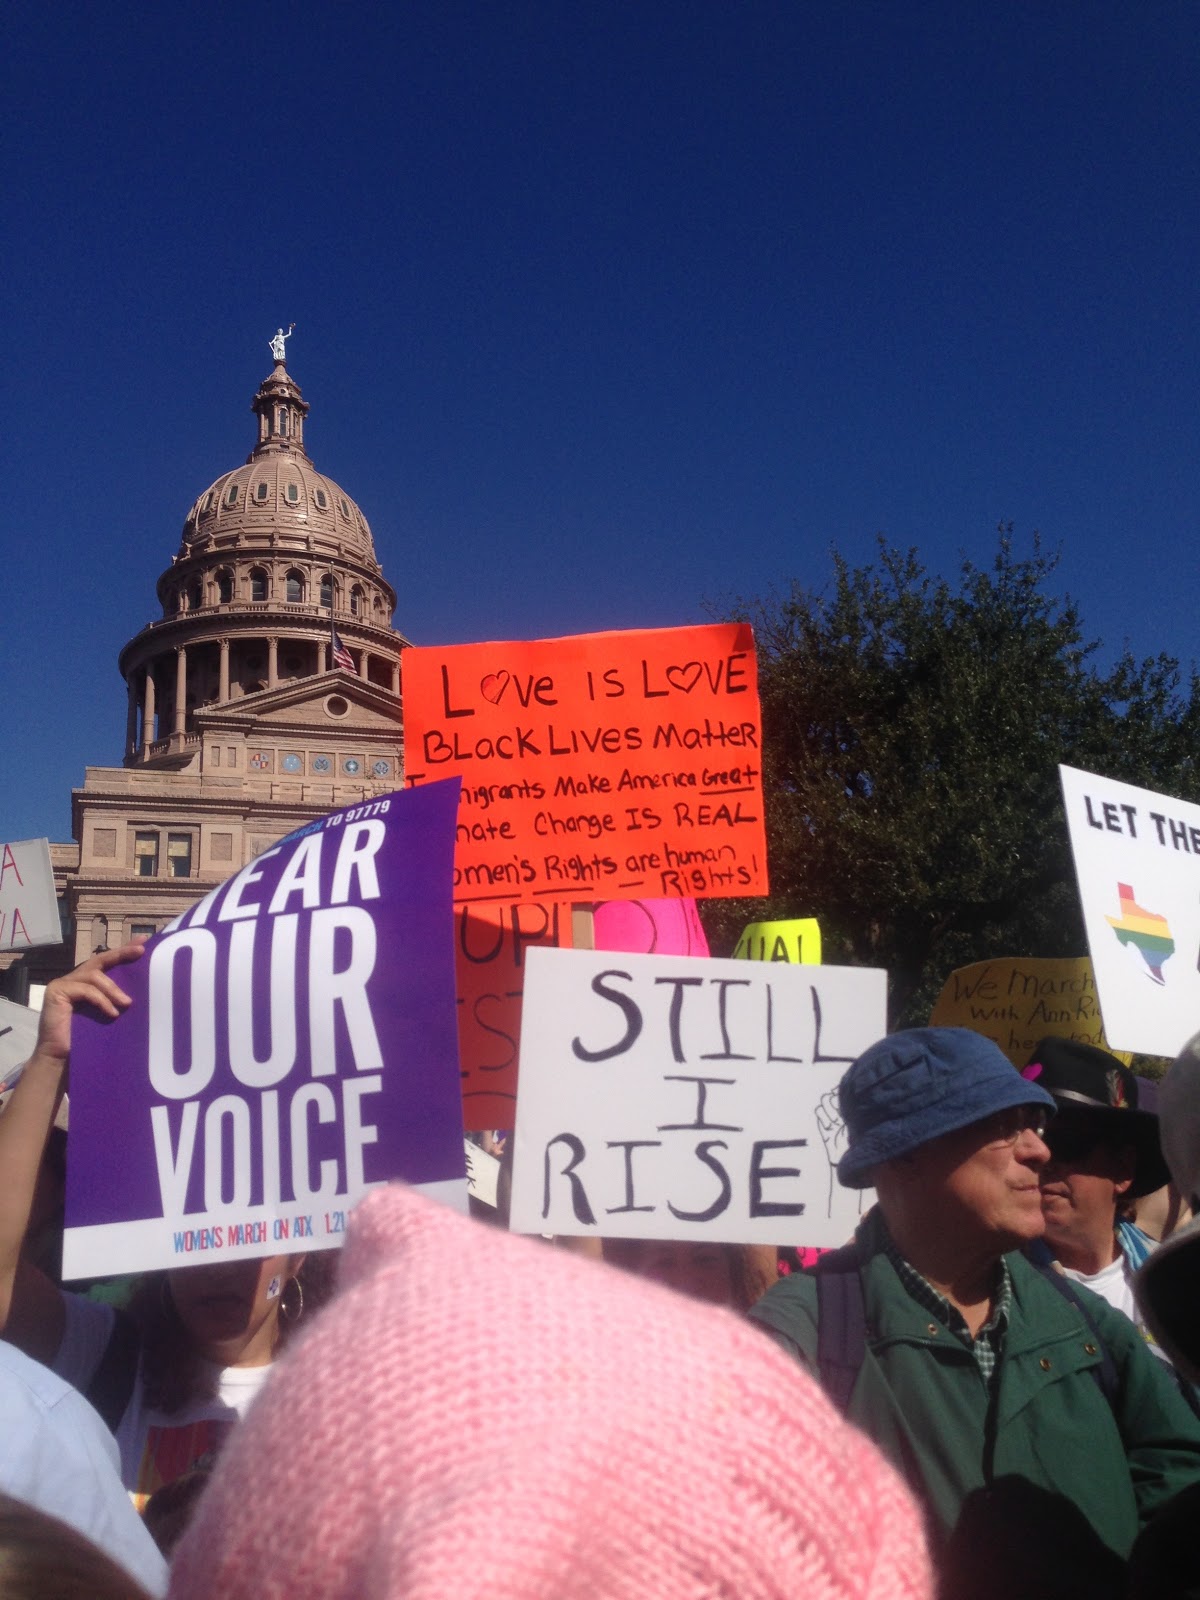
At the Austin, Texas march, marchers’ signs and chants reflected a wide variety of concerns, including women’s reproductive health care, Black Lives Matter, and environmental justice. The emotional tenor was frequently celebratory, though it varied from one point in the march to another across a crowd reported to be more than 40,000. Many speeches at the rally immediately following the march connected the actions of the Texas state legislature–on whose front steps the march began and ended–to the broader national context.

Photo of Austin, TX by Anna Chatillon-Reed.

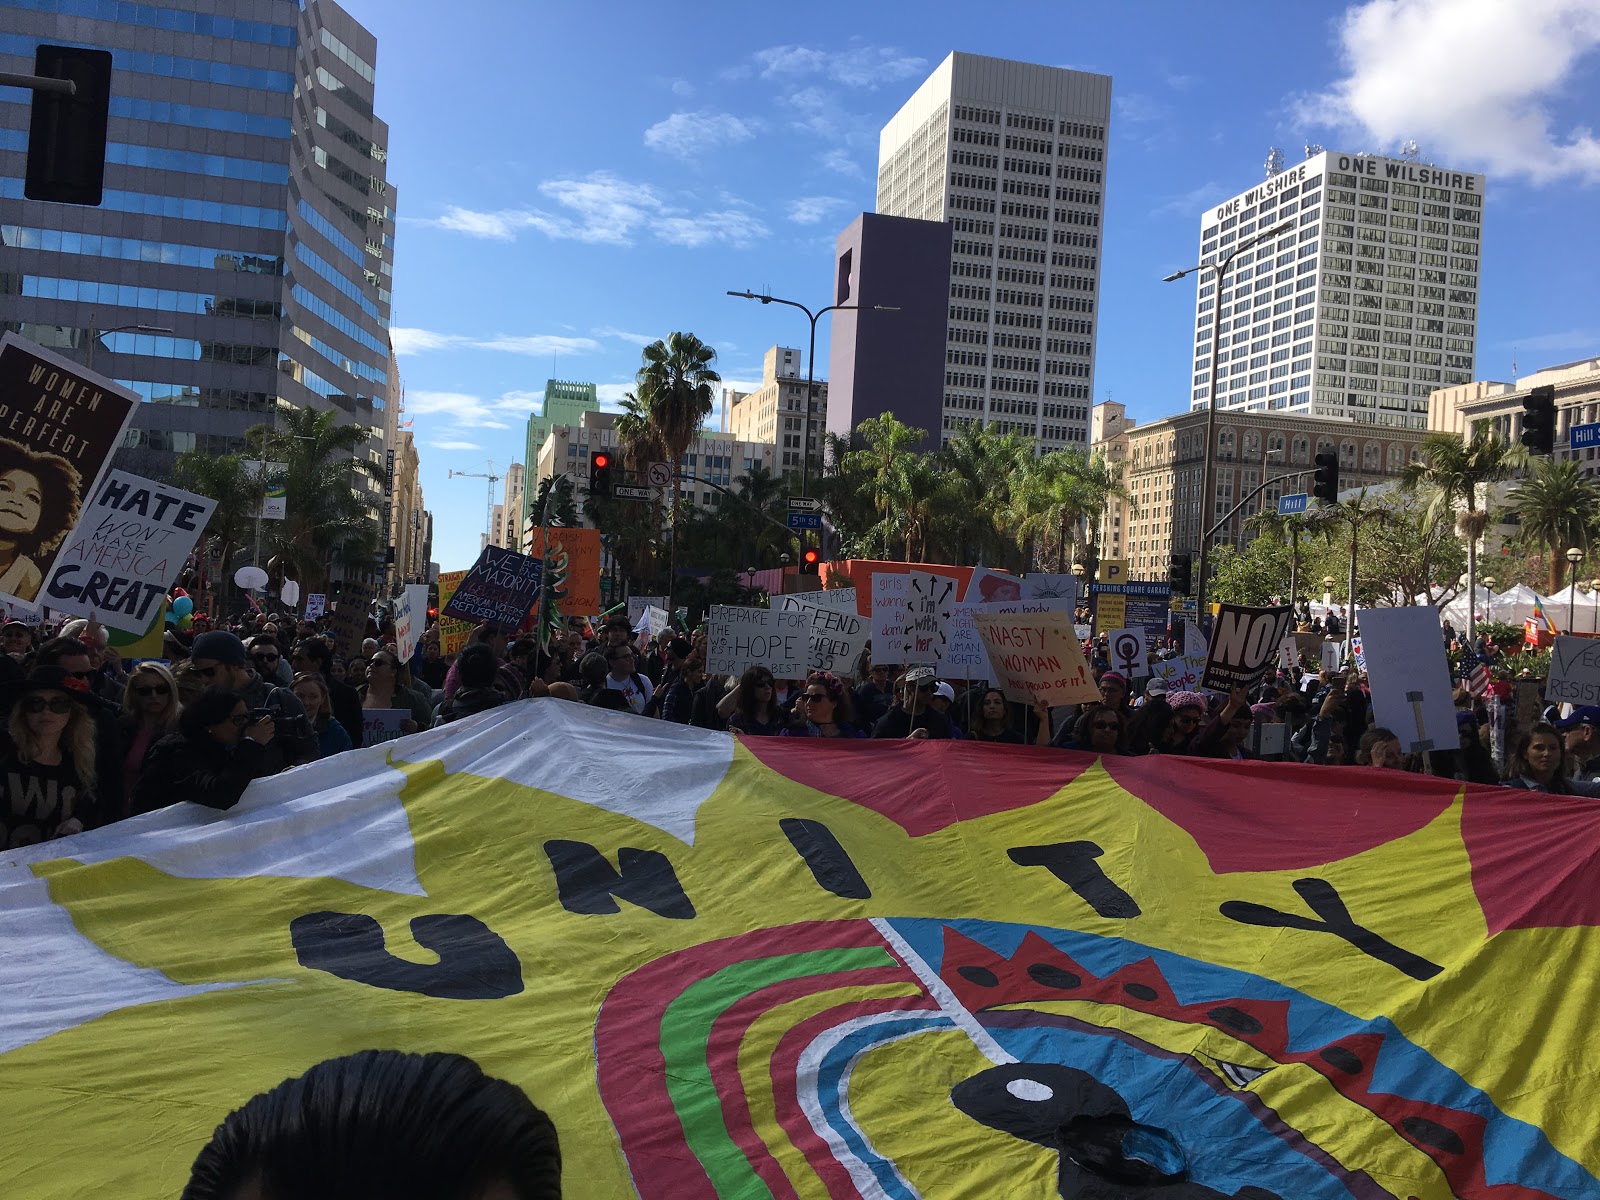
The Los Angeles March numbers suggest it exceeded DC participation. There was a noticeable presence of signs about immigration and in Spanish, which is not surprising considering the local and state demographics.

Photo of Los Angeles by Fátima Suarez.
Photo of Los Angeles by Fátima Suarez

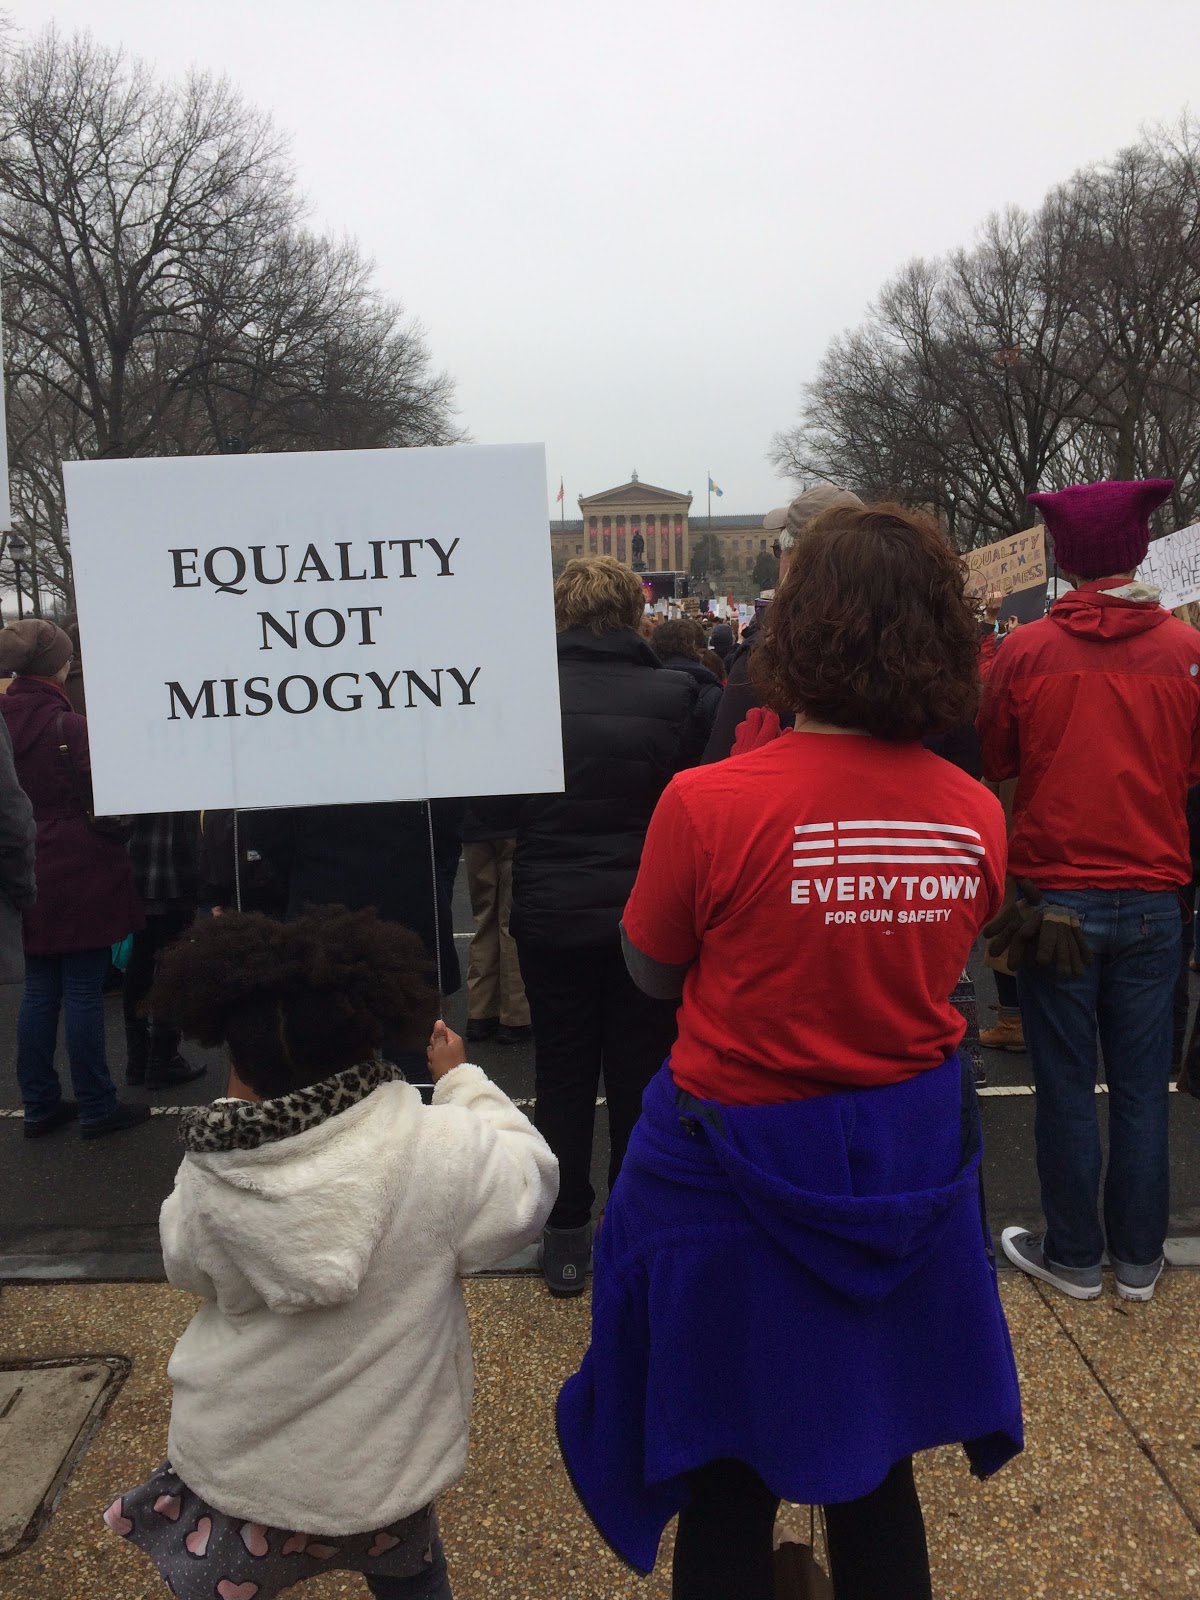
The Philadelphia, PA march was close to bigger cities of in New York and DC. Some participants noted that due to the location it was  “competing” for marchers.

Philadelphia photo by Alex Kulick.

The Portland, OR protest also exceeded attendance expectations as marchers withstood hours of pouring rain. Holding the “sister” marches on the same day worldwide emphasized the magnitude and assists in building collective identity. Yet it also meant organizers in different locations faced vastly different challenges. Factors such as weather that might not have existed if organizers had been scheduling based solely on local norms and contexts.

Portland photo by Kelsy Kretschmer.

To help provide a preliminary sense of the motivations and continued engagement of marchers, we examined a sample of the ~40,000 tweets posted over two months. The analysis continues.

In the coming month, we are launching a separate survey to better understand a group social movement scholars are sometimes less inclined to study: people who do not participate in marches on January 21 (there are exceptions to this of course). As social movement scholars know, mobilization is actually a rare occurrence when we consider the range of grievances present in any society at any given moment. For a second phase of the project, we will conduct interviews with select survey participants.

Understanding the range of responses to grievances is critical as we move into this new era. If the first month of Trump’s presidency is any indication of the years to come, scholars and activists across the political spectrum will have many opportunities to engage these questions.

____________________

*The team Faculty collaborators are Zakiya Luna, PhD (Principal Investigator, California, DC, LA,PH and TX coordinator); Kristen Barber, PhD (St. Louis Lead); Selina Gallo-Cruz, PhD (Boston Lead); Kelsy Kretschmer, PhD (Portland Lead). The site leadership was provided by Anna Chatillon (Austin, TX); Fátima Suarez (Los Angeles, CA); Alex Kulick (Philadelphia, PA & social media); Chandra Russo, PhD (DC co-lead). We are also grateful to many volunteer research assistants.

Dr. Zakiya Luna is an Assistant Professor of Sociology at University of California, Santa Barbara. Her research focused on social movements, human rights and reproduction with an emphasis on the effects of intersecting inequalities within and across these sites. She has published multiple articles on activism, feminism and reproductive justice. For more information on her research and teaching, see http://www.zakiyaluna.com.

Alex Kulick, MA, is a doctoral student in sociology at the University of California, Santa Barbara and trainee in the National Science Foundation network science IGERT program. Their research investigates social processes of inequality and resistance with an emphasis on sexuality, gender, and race.

Anna Chatillon-Reed is a doctoral student in sociology at the University of California, Santa Barbara. She is currently completing her MA, which investigates the relationship between the Black Lives Matter movement and feminist organizations.

“Manspreading” is a relatively new term.  According to Google Trends (below), the concept wasn’t really used before the end of 2014.  But the idea it’s describing is not new at all.  The notion that men occupy more space than women is one small piece of what Raewyn Connell refers to as the patriarchal dividend–the collection of accumulated advantages men collectively receive in androcentric patriarchal societies (e.g., wages, respect, authority, safety).  Our bodies are differently disciplined to the systems of inequality in our societies depending upon our status within social hierarchies.  And one seemingly small form of privilege from which many men benefit is the idea that men require (and are allowed) more space.


It’s not uncommon to see advertisements on all manner of public transportation today condemning the practice of occupying “too much” space while other around you “keep to themselves.”  PSA’s like these are aimed at a very specific offender: some guy who’s sitting in a seat with his legs spread wide enough in a kind of V-shaped slump such that he is effectively occupying the seats around him as well.

I recently discovered what has got to be one of the most exhaustive treatments of the practice ever produced.  It’s not the work of a sociologist; it’s the work of a German feminist photographer, Marianne Wex.  In Wex’s treatment of the topic, Let’s Take Back Our Space: Female and Male Body Language as a Result of Patriarchal Structures (1984, translated from the German edition, published in 1979), she examines just shy of 5,000 photographs of men and women exhibiting body language that results from and plays a role in reproducing unequal gender relations.

The collection is organized by an laudable number of features of the various bodily positions.  Interestingly, it was published in precisely the same year that Erving Goffman undertook a similar sociological study of what he referred to as “gender display” in his book, Gender Advertisements–though Goffman’s analysis utilized advertisements as the data under consideration.

Like Goffman, Wex examined the various details that made up bodily postures that seem to exude gender, addressing the ways our bodies are disciplined by society.  Wex paired images according to the position of feet and legs, whether the body was situated to put weight on one or two legs, hand and arm positions, and much much more.  And through this project, Wex also developed an astonishing vocabulary for body positions that she situates as the embodied manifestations of patriarchal social structures.  The whole book organizes this incredible collection of (primarily) photographs she took between 1972 and 1977 by theme.  On every page, men are depicted  above women (as the above image illustrates)–a fact Wex saw as symbolizing the patriarchal structure of the society she sought to catalog so scrupulously.  She even went so far as to examine bodily depiction throughout history as depicted in art to address the ways the patterns she discovered can be understood over time.

If you’re interested, you can watch the Youtube video of the entire book.

Tristan Bridges, PhD is a professor at the University of California, Santa Barbara. He is the co-editor of Exploring Masculinities: Identity, Inequality, Inequality, and Change with C.J. Pascoe and studies gender and sexual identity and inequality. You can follow him on Twitter here. Tristan also blogs regularly at Inequality by (Interior) Design.

Protestors march in the Woman’s March on Washington D.C. Jan. 21, 2017. The Capital Mall area was the starting point of the march, hundreds of thousands of people attended. (National Guard photo by Tech. Sgt. Daniel Gagnon, JTF-DC).

Waves of pink knitted hats and protest signs packed the streets of D.C. on January 21, 2017, just one day after President Trump’s inauguration drew average crowds. The Women’s March of 2017 was the largest protest in recent history, bringing together over 500,000 people in DC- the location of the flagship march, and over 2.9 million people nationwide. Protesters came from near and far to protect a diverse set of rights that are threatened by the incoming administration. Perhaps the Women’s March can be understood as a partial response to President Obama’s declaration in his farewell address that the most important office in a democracy is “citizen,” and, thus, citizens must work to improve our society, not just when there is an election or when their own narrow interests are at stake. The march was an example of what this kind of democracy looks like. Originally proposed on social media, the idea for the march took off and a groundswell of support emerged from independent individuals and those associated with organizations.  Despite this level of support, many have speculated about who attended the march, whether they voted, the goals of protesters and their level of civic engagement. Some have discounted the protesters as only forwarding the perspectives and issues of white women and eschewing those of other groups such as people of color and/or members of the LGBTQ community.

Combatting this new era of “alternative facts,” a research team led by Dr. Dana R. Fisher, Dr. Dawn M. Dow and Dr. Rashawn Ray from the University of Maryland, College Park provides data-supported facts about participants at the Women’s March. Teams of 2 surveyed participants throughout the march (full details of sampling and methodology available upon request) to understand who was protesting and why. In total, 527 people completed the survey (representing a 92.5% response rate).

Far from using protesting as a substitute for voting, as a recent tweet from Trump suggested, initial findings from this project show that the protesters at the Women’s March voted, and overwhelmingly for Secretary Hillary Clinton. Among respondents, 90.1% reporting voting for Hilary Clinton, 2.3% voted for a third-party candidate and .2% (one person) voted for Donald Trump. Among the 1.7% who explicitly said they did not vote, nearly half were non-U.S. citizens who are not eligible to do so.

Our findings also suggest that the Women’s March has potentially lit the political fires of a new generation of activists and reactivated the political activism of others. Indeed, a third of the participants reported that the Women’s March was their first time participating in a protest ever. For over half of the participants (55.9%), the March was their first protest in 5 years (including those who had never participated before).

Respondents were also asked to identify the issues that motivated them to protest.  Our data suggest protesters were unified by a range of distinct and overlapping priorities. Given the name of the march, it is not surprising that 60.6% of respondents cited women’s rights as a motivation for protesting.  However, other social issues were also at the forefront of protesters’ minds. Nearly tied for second place, protesters cited the environment (35.5%), racial justice (35.1%), LGBTQ rights (34.7%), and reproductive rights (32.7%) as motivations to attend. Other political issues were also well represented including equality (25.1%), social welfare (23.1%) and immigration (21.6%).  Indeed, rather than representing a narrow set of interests, protesters identified multiple and diverse motivations for participating.

Historically protests focus on one social issue such as equal pay, climate change, voting rights or same sex marriage. The Women’s March was different in that its protesters were seemingly engaged in intersectional activism–a version of activism that is sensitive to how race, class, gender and sexuality complicate inequality. Perhaps the Women’s March is distinct in this way because protesters were not just motivated by concrete issues, but they were also motivated by a desire to protect and reassert a vision of America that embraces diversity and inclusion as a strength rather than a threat. This vision of America is increasingly under attack by the Trump Administration. It remains to be seen how the energy from the march will translate into change locally across the country but recent protests suggest that citizens stand ready to protect their rights and the rights of others.

Dr. Dawn M. Dow is an Assistant Professor of Sociology at the University of Maryland, College Park.  She received a PhD in sociology from the University of California, Berkeley and also earned a JD from Columbia University, School of Law.  Dow’s research examines intersections of race, class and gender within the context of the family, educational settings, the workplace and the law. Her work has been published in journals including Gender & Society, Journal of Marriage and Family and Sociology of Race & Ethnicity.  Follow her on Twitter here.

Dr. Dana R. Fisher is a Professor of Sociology and the Director of the Program for Society and the Environment at the University of Maryland. Her research focuses on environmental policy, civic participation and activism more broadly. She has written extensively on activism and social protest in articles as well as in her second book Activism, Inc. (Stanford University Press 2006).  Fisher’s work on protest builds on data collected from around 5,000 protesters at thirteen protest events in six countries. For more information, go to www.drfisher.umd.edu.  Follow her on Twitter here.

Dr. Rashawn Ray is an Associate Professor of Sociology at the University of Maryland, College Park. Ray obtained a Ph.D. in Sociology from Indiana University in 2010. From 2010-2012 he was a Robert Wood Johnson Foundation Health Policy Research Scholar at the University of California, Berkeley/UCSF. Ray’s research addresses the mechanisms that manufacture and maintain racial and social inequality. His work also speaks to ways that inequality may be attenuated through racial uplift activism and social policy. Follow him on Twitter here.


Gender gaps are everywhere.  When we use the term, most people immediately think of gender wage gaps.  But, because we perceive gender as a kind of omni-salient feature of identity, gender gaps are measured everywhere.  Gender gaps refer to discrepancies between men and women in status, opportunities, attitudes, demonstrated abilities, and more. A great deal of research focuses on gender gaps because they are understood to be the products of social, not biological, engineering.  Gender gaps are so pervasive that, each year, the World Economic Forum produces a report on the topic: “The Global Gender Gap Report.”

I first thought about this idea after reading some work by Virginia Rutter on this issue (here and here) and discussing them with her.  When you look for them, gender gaps seem to be almost everywhere.  As gender equality became something understood as having to do with just about every element of the human experience, we’ve been chipping away at all sorts of forms of gender inequality.  And yet, as Virginia Rutter points out, we have yet to see gender convergence on all manner of measures.  Indeed, progress on many measures has slowed, halted, or taken steps in the opposite direction, prompting some to label the gender revolution “stalled.”   And in many cases, the “stall” starts right around 1980.  For instance, Paula England showed that though the percentage of women employed in the U.S. has grown significantly since the 1960s, that progress starts to slow in the 1980s.  Similarly, in the 1970s a great deal of progress was made in desegregating fields of study in college.  But, by the early 1980s, about all the change that has been made had been made already.  Changes in the men’s and women’s median wages have shown an incredibly persistent gender gap.

A set of gender gaps often used to discuss inherent differences between men and women are gaps in athletic performance – particularly in events in which we can achieve some kind of objective measure of athleticism.  In Lisa Wade and Myra Marx Ferree’s Gender: Ideas, Interactions, Institutions, they use the marathon as an example of how much society can engineer and exaggerate gender gaps.  They chart world record times for women and men in the marathon over a century.  I reproduced their chart below using IAAF data (below).

marathon-world-record-progression-by-gender

In 1963, an American woman, Merry Lepper, ran a world recording breaking marathon at 3 hours, 37 minutes, and 7 seconds.  That same year, the world record was broken among men at 2 hours, 14 minutes, and 28 seconds.  His time was more than 80 minutes faster than hers!  The gender gap in marathon records was enormous.  A gap still exists today, but the story told by the graph is one of convergence.  And yet, I keep thinking about Virginia Rutter’s focus on the gap itself. I ran the numbers on world record progressions for a whole collection of track and field races for women and men.  Wade and Ferree’s use of the marathon is probably the best example because the convergence is so stark.  But, the stall in progress for every race I charted was the same: incredible progress is made right through about 1980 and then progress stalls and a stubborn gap remains.

Just for fun, I thought about considering other sports to see if gender gaps converged in similar ways. Below is the world record progression for men and women in a distance swimming event – the 1500-meter swim.

1500-meter-swim-world-record-progression-by-gender

The story for the gender gap in the 1500-meter swim is a bit different.  The gender gap was smaller to begin with and was primarily closed in the 1950s and early 60s.  Both men and women continued to clock world record swims between the mid-1950s and 1980 and then progress toward faster times stalled out for both men and women at around that time.

One way to read these two charts is to suggest that technological innovations and improvements in the science of sports training meant that we came closer to achieving, possibly, the pinnacle of human abilities through the 1980s.  At some point, you might imagine, we simply bumped up against what is biologically possible for the human body to accomplish.  The remaining gap between women and men, you might suggest, is natural.  Here’s where I get stuck… What if all these gaps are related to one another?  There’s no biological reason that women’s entry into the labor force should have stalled at basically the same time as progress toward gender integration in college majors, all while women’s incredible gender convergence in all manner of athletic pursuits seemed to suddenly lose steam.  If all of these things are connected, it’s for social, not biological reasons.

Tristan Bridges, PhD is a professor at the University of California, Santa Barbara. He is the co-editor of Exploring Masculinities: Identity, Inequality, Inequality, and Change with C.J. Pascoe and studies gender and sexual identity and inequality. You can follow him on Twitter here. Tristan also blogs regularly at Inequality by (Interior) Design.

Counting the number of lesbian, gay, bisexual, and transgender people is harder than you might think.  I’ve written before on just how important it is to consider, for instance, precisely how we ask questions about sexuality.  One way scholars have gotten around this is to analytically separate the distinct dimensions of sexuality to consider which dimension they are asking about.  For research on sexuality, this is typically done by considering sexual identities as analytically distinct from sexual desires and sexual behaviors.  We like to imagine that sexual identities, acts, and desires all neatly match up, but the truth of the matter is… they don’t.  At least not for everyone.  And while you might think that gender might lend itself to be more easily assessed on surveys, recent research shows that traditional measures of sex and gender erase our ability to see key ways that gender varies in our society.

Gallup just released a new publication authored by Gary J. Gates.  Gates has written extensively on gender and sexual demography and is responsible for many of the population estimates we have for gender and sexual minorities in the U.S.  This recent publication just examines shifts in the past 5 years (between 2012 and 2016).  And many of them may appear to be small.  But changes like this at the level of a population in a population larger than 300,000,000 people are big shifts, involving huge numbers of actual people.  In this post, I’ve graphed a couple of the findings from the report–mostly because I like to chart changes to visually illustrate findings like this to students.  [*Small note: be aware of the truncated y axes on the graphs.  They’re sometimes used to exaggerate findings.  I’m here truncating the y axes to help illustrate each of the shifts discussed below.]

lgbt-demo-1

The report focuses only on one specific measure of membership as LGBT–identity.  And this is significant as past work has shown that this is, considered alongside other measures, perhaps the most conservative measure we have.  Yet, even by that measure, the LGBT population is on the move, increasing in numbers at a rapid pace in a relatively short period of time.  As you can see above, between 2012 and 2016, LGBT identifying persons went from 3.5%-4.1% of the U.S. population, which amounts to an estimated shift from 8.3 million people in 2012 to more than 10 million in 2016.

lgbt-demo-2-generations

The report also shows that a great deal of that increase can be accounted for by one particular birth cohort–Millennials.  Perhaps not surprisingly, generations have become progressively more likely to identify as LGBT.  But the gap between Millenials and the rest is big and appears to be growing.  But the shifts are not only about cohort effects.  The report also shows that this demographic shift is gendered, racialized, and has more than a little to do with religion as well.

The gender gap between proportion of the population identifying as LGBT in the U.S. is growing.  The proportion of women identifying as LGBT has jumped almost a full percentage point over this period of time.  And while more men (and a larger share of men) are identifying as LGBT than were in 2012, the rate of increase appears to be much slower.  As Gates notes, “These changes mean that the portion of women among LGBT-identified adults rose slightly from 52% to 55%” (here).

lgbt-demo-3-gender-and-race

The gap between different racial groups identifying as LGBT has also shifted with non-Hispanic Whites still among the smallest proportion of those identifying.  As you can see, the shift has been most pronounced among Asian and Hispanic adults in the U.S.  Because White is the largest racial demographic group here, in actual numbers, they still comprise the largest portion of the LGBT community when broken down by race.  But, the transitions over these 5 years are a big deal.  In 2012, 2 of every 3 LGBT adults in the U.S. identified as non-Hispanic White.  By 2016, that proportion dropped to 6 out of every 10. This is big news.  LGBT people (as measured by self-identification) are becoming a more racially diverse group.

They are also diverse in terms of class.  Considering shifts in the proportion of LGBT identifying individuals by income and education tells an interesting story.  As income increases, the proportion of LGBT people decreases.  And you can see that finding by education in 2012 as well–those with less education are more likely to be among those identifying as LGBT (roughly).  But, by 2016, the distinctions between education groups in terms of identifying as LGBT have largely disappeared.  The biggest rise has been among those with a college degree.  That’s big news and could mean that, in future years, the income gap here may decrease as well.

There were also findings in the report to do with religion and religiosity among LGBT identifying people in the U.S.  But I didn’t find those as interesting.  Almost all of the increases in people identifying as LGBT in recent years have been among those who identify as “not religious.”  While those with moderate and high levels of religious commitment haven’t seen any changes in the last five years.  But, among the non-religious, the proportion identifying as LGBT has jumped almost 2 percentage points (from 5.3% in 2012 to 7.0% in 2016).

All of this is big news because it’s a powerful collection of data that illustrate that the gender and sexual demographics of the U.S. are, quite literally, on the move.  We should stand up and pay attention.  And, as Gates notes in the report, “These demographic traits are of interest to a wide range of constituencies.”  Incredible change in an incredibly short period of time.  Let the gender and sexual revolution continue!

Edit (1/17/17): The graph charting shifts by age cohort may exaggerate (or undersell) shifts among Millennials because the data does not exclude Millennials born after 1994.  So, some of those included in the later years here wouldn’t have been included in the earlier years because they weren’t yet 18.  So, it’s more difficult to tell how much of that shift is actually people changing identity for the age cohort as a whole as opposed to change among the youngest Millennials surveyed.

Tristan Bridges, PhD is a professor at the University of California, Santa Barbara. He is the co-editor of Exploring Masculinities: Identity, Inequality, Inequality, and Change with C.J. Pascoe and studies gender and sexual identity and inequality. You can follow him on Twitter here. Tristan also blogs regularly at Inequality by (Interior) Design.

1The dining rooms are coming. It’s how I know my neighborhood is becoming aspirationally middle class.

My neighborhood is filled with “shotgun” houses. Probably from West Africa, they are designed for a hot, humid climate. The homes consist of several rooms in a row. There are no hallways (and no privacy). High ceilings collect the heat and the doorways are placed in a row to encourage a breeze to blow all the way through.

Around here, more often than not, they have been built as duplexes: two long skinny houses that share a middle wall. The kitchen is usually in the back leading to an addition that houses a small bathroom. Here’s my sketch:

??????????????

As the neighborhood has been gentrifying, flippers have set their sights on these double shotguns. Instead of simply refurbishing them, though, they’ve been merging them. Duplexes are becoming larger single family homes with hallways (which substantially changes the dynamic among its residents) and makes space for dining rooms. Check out the new dining room on this flip (yikes):

8

At NPR, Mackensie Griffin offered a quick history of dining rooms, arguing that they were unusual in the US before the late 1700s. Families didn’t generally have enough room to set one aside strictly for dining. “Rooms and tables had multiple uses,” Griffin wrote, “and families would eat in shifts, if necessary.”

Thomas Jefferson would be one of the first Americans to have a dining room table. Monticello was built in 1772, dining room included. Wealthy families followed suit and eventually the trend trickled down to the middle classes. Correspondingly, the idea that the whole family should eat dinner together became a middle class value, a hallmark of good parenting, and one that was structurally — that is, architecturally — elusive to the poor and working class.

The shotgun house we find throughout the South is an example of just how elusive. Built before closets, all the rooms in a traditional shotgun are technically multi-purpose: they can be used as living rooms, bedrooms, offices, dining rooms, storage, or whatever. In practice, though, medium to large and sometimes extended families live in these homes. Many residents would be lucky to have a dedicated living room; a dining room would be a luxury indeed.

But they’re coming anyway. The rejection of the traditional floor plan in these remodels — for being too small, insufficiently private, and un-dining-roomed — hints at a turn toward a richer sort of resident, one that demands a lifestyle modeled by Jefferson and made sacred by the American middle class.

Cross-posted at Inequality by (Interior) Design.

Lisa Wade, PhD is an Associate Professor at Tulane University. She is the author of American Hookup, a book about college sexual culture; a textbook about gender; and a forthcoming introductory text: Terrible Magnificent Sociology. You can follow her on Twitter and Instagram.

1To Post Secret, a project that collects personal secrets written artistically onto postcards, someone recently sent in the following bombshell: “Ever since we started getting married and buying houses,” she writes, “my girlfriends and I don’t laugh much anymore.”

4

Her personal secret is, in fact, a national one.  It’s part of what has been called the “paradox of declining female happiness.” Women have more rights and opportunities than they have had in decades and yet they are less happy than ever in both absolute terms and relative to men.

Marriage is part of why. Heterosexual marriage is an unequal institution. Women on average do more of the unpaid and undervalued work of households, they work more each day, and they are more aware of this inequality than their husbands. They are more likely to sacrifice their individual leisure and career goals for marriage. Marriage is a moment of subordination and women, more so than men, subordinate themselves and their careers to their relationship, their children, and the careers of their husbands.

Compared to being single, marriage is a bum deal for many woman. Accordingly, married women are less happy than single women and less happy than their husbands, they are less eager than men to marry, they’re more likely to file for divorce and, when they do, they are happier as divorcees than they were when married (the opposite is true for men) and they are more likely than men to prefer never to remarry.

The only reason this is surprising is because of the torrent of propaganda we get that tells us otherwise. We are told by books, sitcoms, reality shows, and romantic comedies that single women are wetting their pants to get hitched. Men are metaphorically or literally drug to the altar in television commercials and wedding comedies, an idea invented by Hugh Hefner in the 1950s (before the “playboy,” men who resisted marriage were suspected of being gay). Not to mention the wedding-themed toys aimed at girls and the ubiquitous wedding magazines aimed solely at women. Why, it’s almost as if they were trying very hard to convince us of something that isn’t true.

But if women didn’t get married to men, what would happen? Marriage reduces men’s violence and conflict in a society by giving men something to lose. It increases men’s efforts at work, which is good for capitalists and the economy. It often leads to children, which exacerbate cycles of earning and spending, makes workers more reliable and dependent on employers, reduces mobility, and creates a next generation of workers and social security investors. Marriage inserts us into the machine. And if it benefits women substantially less than men, then it’s no surprise that so many of our marriage promotion messages are aimed squarely at them.

Lisa Wade, PhD is an Associate Professor at Tulane University. She is the author of American Hookup, a book about college sexual culture; a textbook about gender; and a forthcoming introductory text: Terrible Magnificent Sociology. You can follow her on Twitter and Instagram.

Cross-posted at Cyborgology.

Fake news among the alt-right has been central in post-election public discourse, like with Donald Trump’s dubiously sourced tweet about the “millions of illegal voters” supposedly driving Clinton’s substantial lead in the popular vote. Less attention, however, has been paid to the way “real” news is, to use the sociologist Nathan Jurgenson’s term, based in “factiness,” described as “the feel and aesthetic of ‘facts,’ often at the expense of missing the truth.”  Mainstream news gets cast as objective in part because journalists, stack of papers and obligatory pen studiously in hand, point to statistics that back up their reports. Such reliance on “data” can mask the way that humans are involved in turning things into numbers and numbers into stories. So here I present a cautionary tale.

It is a common truism that white male voters without college degrees disproportionately supported Trump in the 2016 election. Indeed, the notion that men with high school as their highest level of education were more likely to vote for Trump is an empirically supported fact. This data point spread widely throughout the campaign season, and bore out in the post-election analyses. But also in the post-election analyses — over which researchers poured in response to the statistically surprising result — another data point emerged that could have, but didn’t, change the narrative around this demographic voting bloc.

The data point that emerged was that white American men without college degrees have remained economically depressed since the 2008 recession and subsequent recovery. Although the U.S. economy has been steadily improving, the economic reality for this particular segment of the population has not. This is what Michael Moore talked about experientially (but not statistically), claiming that he knows the people who live in the rust belt, and they are struggling. He was right, the data show that they are struggling. Highlighting the economic reality for people without college degrees in the U.S. tells a very different story than highlighting the fact that they don’t have college degrees. The former renders an image of a voting contingent who, in the face of personal economic hardship that contrasts with national economic gain, are frustrated and eager to try something — anything — new. The latter renders an image of ignorance.

Data about education levels of voters is transformed by its coupling with economic trajectories. What’s been strange, is that although this coupling was discovered, it never really penetrated the larger “what happened” narrative. This is particularly strange given the meticulous and sometimes frantic search for explanation and the media’s public introspective quests to understand how so many got it all so wrong.

The transformative effect of the economic data point and its failure to effectively transform the story underlines two related things: data are not self-evident and narrative currents are hard to change.

The data weren’t wrong — people without college degrees were more likely to vote for Trump — but they were incomplete and in their partialness, quite misleading. That’s not a data problem, it’s a people problem. Data are not silent, but they are inarticulate. Data make noise, but people have to weave that noise into a story. The weaving process begins with survey construction, and culminates in analyses and reports. Far from an objective process, turning data into narrative entails nuanced decisions about the relevance of, and relationship between, quantifiable items captured through human-created measures. The data story is thus always value-laden and teeming with explicit and implicit assumptions.

Framing a contingent of Trump supporters through the exclusive metric of education without examining the interaction, mediating, and moderating effects of economic gains, was an intellectual decision bore out through statistical analyses. That is, pollsters, strategists, and commentators treated “lack of education” as the variable with key explanatory power. Other characteristics or experiences of those with low levels of education could/should/would be irrelevant.

Such dismissal created a major problem with regard to Democratic strategy. To situate a voting bloc as “uneducated” is to dismiss that voting bloc. How does one campaign to those voting in ignorance? In contrast, to situate a voting bloc as connected through an economic plight not only validates their position, but also gives a clear policy platform on which to speak.

But okay, after the election, analysts briefly shed light on the way that economics and education operated together to predict candidate preference. Why has this gotten so little attention? Why is education — rather than economics or the economic-education combination — still the predominant story?

The predominance of education remains because narrative currents are strong. Even when tied to newly emergent data, established stories are resistant to change. Narratives are embedded with social frameworks, and changing the story entails changing the view of reality. A key tenet of sociology is that people tend towards stability. Once they understand and engage the world in a particular way, they do social and psychological gymnastics to continue understanding and engaging the world in that way. To reframe (some) Trump voters as part of an economic interest group that has been recently underserved, is an upheaval of previous logics. Moreover, disrupting existing logics in this way forces those who practice those logics to, perhaps, reframe themselves, and do so in a way that is not entirely flattering or identity affirming. To switch from a frame of ignorance to a frame of economics is to acknowledge not only that the first frame was distorted, but also, to acknowledge that getting it wrong necessarily entailed ignoring the economic inequality that progressives take pride in caring so much about. Switching from ignorance to economics entails both a change in logic and also, a threat to sense of self.

Data are rich material from which stories are formed, and they are not objective. Tracing data is a process of deconstructing the stories that make up our truths — how those stories take shape, evolve, and solidify into fact. The “truth” about Trump voters is of course complex and highly variable. The perpetually missed nuances tell as much of a story as those on which predominant narratives hang.

Jenny L. Davis, PhD, is in the department of sociology at James Madison University. She studies social psychology, experimental research methods, and new and social media. She is also a contributing author and editor at Cyborgology.  You can follow her at @Jenny_L_Davis.