This week Neil DeGrasse Tyson tweeted the following, along with a photograph of suspiciously gendered AP exam study guide covers:

1

I’m going to take this to mean that Tyson is as big a fan of sociology as I am of astrophysics.  Made my day.

Thanks to Jay Livingston for the tip!

Lisa Wade, PhD is an Associate Professor at Tulane University. She is the author of American Hookup, a book about college sexual culture; a textbook about gender; and a forthcoming introductory text: Terrible Magnificent Sociology. You can follow her on Twitter and Instagram.

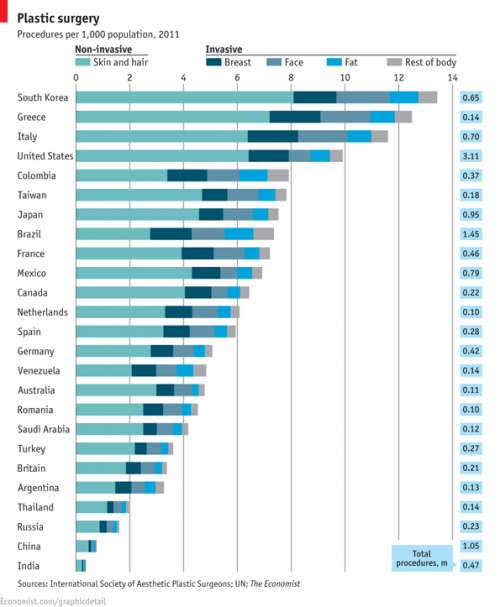
The  International Society of Aesthetic Plastic Surgeons has released new data on the incidence of invasive and non-invasive cosmetic procedures.  The U.S. leads in sheer numbers of procedures but, accounting for population, we fall into 4th place.  South Korea leads for the number of procedures per person, followed by Greece and Italy.

1

By far the most common kinds of surgical cosmetic procedures are lipoplasty and breast augmentation.  Along with fat, breasts seem to be a particular concern: breast lifts and breast reductions for both men and women are also in the top ten.  Abdominoplasty, nose jobs, eyelid surgeries, and facelifts are as well.

2

The incidence of these surgeries is strongly related to everything from the gender binary to global power dynamics.  In 2008 we reported that male breast reductions were the most common cosmetic surgery for 13-19 year olds (boys and girls combined). You would be shocked at what counts as excess breast tissue and how little the before and after photos look.  Boys and men getting breast reductions, alongside women getting augmentations, is obviously about our desire for men and women to be different, not naturally-occurring difference.  See The Story of My Man-Boobs for more.

Likewise, we’ve posted about surgeries that create an epithelial fold, a fold of skin in the eyelid more common in people with White than Asian ethnic backgrounds.  This surgery is a trend among Asians and Asian-Americans, as colonization has left us with an association between Whiteness, attractiveness, and power.

The Economist summarizes some other trends:

Breast augmentation, the second biggest surgical procedure, is most commonly performed in America and Brazil. Buttock implants are also a Brazilian specialty, as is vaginal rejuvenation. Asia is keen on nose jobs: China, Japan and South Korea are among the top five nations for rhinoplasty.

More on where and how many procedures are being performed, but nothing on why, at the ISAPS report.

Image at The Economist; via Global Sociology.

Lisa Wade, PhD is an Associate Professor at Tulane University. She is the author of American Hookup, a book about college sexual culture; a textbook about gender; and a forthcoming introductory text: Terrible Magnificent Sociology. You can follow her on Twitter and Instagram.

Screenshot_5One of the few genuinely large observed differences between men and women involves throwing ability.  Men, on average, are much stronger throwers than women.  Hence the phrase “throws like a girl.”

That we observe a difference, however, tells us nothing about where that difference comes from.  Figuring that out is much more difficult than simply measuring difference and sameness.  We know that the difference emerges at puberty, suggesting that sheer size might have something to do with it.  But the fact that boys and men, on average, get much more practice throwing than women might also play a role.  How to test this?

Well, here’s one way: compare men and women throwing with their non-dominant hand.  Muscle memory doesn’t transfer from one side of the body to the other.  Accordingly, since most people have a lot of practice throwing only with one hand, comparing the throws of men and women using their non-dominant hand might tell us something interesting.

I don’t know that that study has been done, but an enterprising videographer has captured video of a set of men throwing with the “wrong” hand. What I like most about the video is the men’s facial expressions.  You can see them laughing at themselves, suddenly reduced to a beginner thrower.  Though we still don’t know how much of it is biological and how much social — though, this is the wrong question anyway — it reveals that, no matter what the answer, men’s throwing ability is strongly related to practice:

A big thanks to Reynaldo C. for sending in the video!

Cross-posted at BlogHer.

Lisa Wade, PhD is an Associate Professor at Tulane University. She is the author of American Hookup, a book about college sexual culture; a textbook about gender; and a forthcoming introductory text: Terrible Magnificent Sociology. You can follow her on Twitter and Instagram.

Cross-posted at The Huffington Post.

Justin J.W. Powell and Liat Ben-Moshe have written a great short history of the icon signifying accessibility for people who use wheelchairs for the magazine Stimulus Respond.  The story, they argue, is one of “exclusion to inclusion.”

For most of American history, they begin, there was no icon at all.  This is because people in wheelchairs were largely excluded from public life.  There were no efforts to ensure accessibility, so no signs of accessibility were needed.

In the late ’60s, however, Rehabilitation International partnered with the United Nations and the International Standards Organisation to sponsor an international competition for an icon.  The winner, a Danish design student named Susanne Koefoed, had submitted the icon on the left.  In committee, they noted that Koefoed’s design erased the person in the wheelchair.  They added a head, creating what people around the world recognize as a symbol of accessibility.

1

The symbol is still evolving. Powell and Ben-Moshe note that recent revisions have been aimed at emphasizing that people in wheelchairs are active users, not passive ones.  Accordingly, some organizations have shifted to using a symbol that captures the fact that people in wheelchairs get themselves around.  I’ve snapped pictures of the icons used by the Huntington Gardens and a T.J. Maxx (both in CA): the former has the users’ arms bent behind them to signify pushing their chair forward, while the latter leans the figure forward and adds motion lines.

2

Another trend involves trying to break down the categorical binary between abled and disabled people, instead recognizing that there is a spectrum of ability. For example, this icon (source):

3

Ultimately, Powell and Ben-Moshe hope that access will be so universally designed into public buildings that it will eliminate the need for an icon at all: architecture would no longer be designed around a specific type of person considered “normal,” but instead would be designed for the range of people who will use the spaces.  This full integration would mean that differently-abled people would be considered just “people” and we wouldn’t need an icon at all.

Lisa Wade, PhD is an Associate Professor at Tulane University. She is the author of American Hookup, a book about college sexual culture; a textbook about gender; and a forthcoming introductory text: Terrible Magnificent Sociology. You can follow her on Twitter and Instagram.

Cross-posted at Policy Mic and The Huffington Post.

The gap between the household wealth of Black and White families is massive.  Today the median wealth held by White households is 20 times that of Black households.  There are lots of reasons for this difference and a new study offers great data on one of them: the need to assist poor relatives.

Kevin Hartnett, at Braniac, writes:

Middle-income blacks are more than twice as likely as middle-income whites to have a poor sibling and more than four times as likely to have parents below the poverty line. And because of these relationships, they’re called upon more often to provide financial assistance.

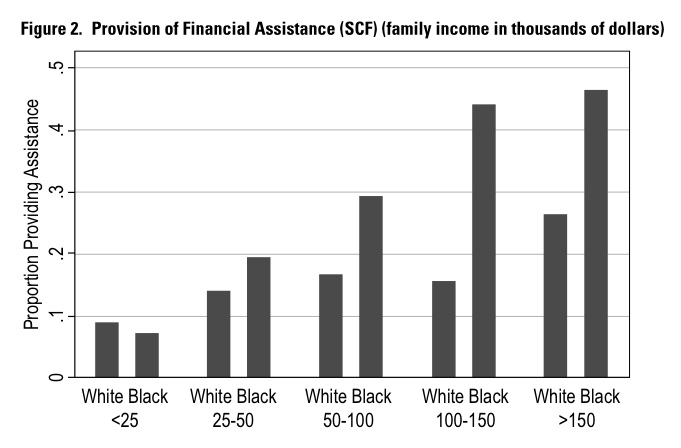
Sociology graduate student Rourke O’Brien used data on spending and other financial patterns among Americans to test whether this is a significant source of the wealth gap (link).  He found that, at all but the most low income level, Black households are more likely than White households to give money to struggling relatives.  And the wealthier the Black household, the more likely they were to help others.

The graph below illustrates this.  The vertical axis represents the proportion of households offering assistance and the horizontal axis represents increasing income levels (in thousands of dollars).

blackwhitewealth

The lesson is simple, but all too often unnoticed.  Due to hundreds of years of enslavement and discrimination, African Americans are more likely to be poor than Whites. If you grow up poor then most of the people in your family are poor.  Accordingly, even if you “make it out” and arrive in the middle class (income-wise), you will likely be less financially secure than a person that earns the same income but came from a middle class family.  That person can put all of their extra money towards buying a home (and earning equity), retirement, additional degrees, starting a business, and sending their kids to college.

But the poor person who earns a middle-class income might use a significant portion of their income keeping their parents’ heat on, helping their little brother go to college, or buying back-to-school clothes for their nieces and nephews.  This makes it much harder for poor and working class people who become middle class to stay that way.  And the cycle continues.

Via Citings and Sightings.

Lisa Wade, PhD is an Associate Professor at Tulane University. She is the author of American Hookup, a book about college sexual culture; a textbook about gender; and a forthcoming introductory text: Terrible Magnificent Sociology. You can follow her on Twitter and Instagram.

In 2009, 470,000 15-year-olds in 65 developed nations took a science test.  Boys in the U.S. outperformed girls by 14 points: 509 to 495.  How does the U.S. compare to other countries?

The figure below — from the New York Times — features Western and Northern Europe and the Americas (in turquoise), Asia and the Pacific Islands (in pink), and the Middle East and Eastern and Southern Europe (in yellow).  The line down the middle separates societies in which boys scored higher than girls (left) and vice versa (right).

Notice that the countries in which boys outscore girls are overwhelmingly Western and Northern Europe and the Americas.

This data tells a similar story to the data on gender and math aptitude.  Boys used to outperform girls in math in the U.S., but no longer.  And if you look transnationally, cultural variation swamps gender differences.  Analyses have shown that boys outperforming girls in math is strongly correlated with the degree of inequality in any given society.

One lesson to take is this: any given society is just one data point and can’t be counted on to tell the whole story.

Via The Global Sociology Blog.

Lisa Wade, PhD is an Associate Professor at Tulane University. She is the author of American Hookup, a book about college sexual culture; a textbook about gender; and a forthcoming introductory text: Terrible Magnificent Sociology. You can follow her on Twitter and Instagram.

CollegeHumor posted a set of fake Puritan-themed Valentine’s Day cards.  They’re a humorous way of reminding us that our intensive focus on romantic love as a driving force for sex and marriage is, in fact, quite new.

1

When the Puritans landed on the rocky east coast of America in the 1600s, they brought with them the belief that sex should be restricted to intercourse in marriage, hence the sentiment on the left. All non-marital and non-reproductive sexual activities were forbidden, including pre- and extra-marital sex, homosexual sex, masturbation, and oral or anal sex (even if married).   Violations of the rules were punished by fines, whipping, public shaming (yes, with “scarlet letters”), ostracism, or even death.

Alongside religion, there were practical reasons why the Puritans were so darn puritanical.  Colonizing the U.S. was a dangerous job; lots of people were dying from exposure, starvation, illness, and war.  Babies replenished the labor supply, motivating the Puritans to channel the sex drive towards the one sexual activity that made babies: intercourse. Accordingly, having intercourse with your spouse wasn’t only allowed, it was essential; women could divorce men who had proven impotent.  

The Puritans also married primarily to form practical partnerships for bearing children and mutual survival, hence the sentiment in the card on the right.

The idea that love should be the basis for marriage didn’t take hold until the Victorian era, when industrialization was changing the value of children.  Useful on the farm, children were suddenly became a burden in expensive and overcrowded lodgings.  This gave couples a new reason to limit the number of children they had and, because industrial production had made condoms increasingly cheap and effective, they could.  Marital fertility rates dropped precipitously between 1800 and 1900: from 6+ children/woman to 3 1/2 in the U.S., England, and Wales.

In this context, a Puritan sexual ethic that restricted sex to efforts to make babies just didn’t make sense. People needed a new logic to guide sexual activity: the answer was love. Over the course of the 1800s, Victorians slowly abandoned the Puritan idea that sex was only for reproduction, embracing instead the now familiar idea that sex could be an expression of love and a source of pleasure, an idea that still resonates strongly today.

That’s at least part of the story anyway.

Sources:

Bremer, Francis J., and Tom Webster.  2006. Puritans and Puritanism in Europe and America: A Comprehensive Encyclopedia. SantaBarbara: ABC-CLIO, Inc.

D’Emilio, John & Estelle Freedman. 1997. Intimate Matters: A History of Sexuality in America. Chicago: University of Chicago Press.

Freedman, Estelle. 1982. Sexuality in Nineteenth Century America: Behavior, Ideology, and Politics. Reviews in American History 10, 4: 196-215.

Lisa Wade, PhD is an Associate Professor at Tulane University. She is the author of American Hookup, a book about college sexual culture; a textbook about gender; and a forthcoming introductory text: Terrible Magnificent Sociology. You can follow her on Twitter and Instagram.

The current political discourse is so focused on a single form of government revenue, that the word taxes has become essentially synonymous with just one tax in particular; the federal income tax.  In fact, unless there is a foreign policy crisis, the federal income tax usually dominates most political discussion given how the federal budget (or increasingly the federal debt) relates to almost anything and everything the federal government does (or does not do in more and more instances).

For example, during the closing months of 2012 we watched how a fight over a sunset of the Bush Tax Cuts almost shoved the United States over a fiscal cliff.  Just prior to this near crisis, the most discussed difference between 2012 presidential candidates was their disagreement about a 4 point increase in the highest federal income bracket.  Also, Mitt Romney will likely be remembered mostly for his disparagement and disregard of “The 47% of United States Citizens who pay no federal income tax.”

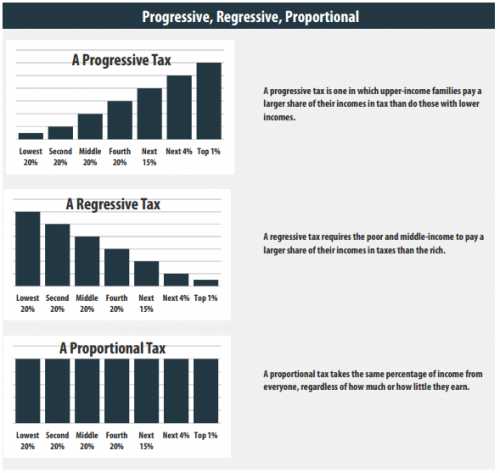
However, limiting discussion about government funding and spending to just the federal income tax and ignoring the other types of payments we make to the treasury is not without consequence, especially given how the federal income tax is actually a very unique kind of tax.  Unlike excise taxes, payroll deductions, sales taxes and most property taxes that are regressive or require the poor to pay a larger proportion of their resources than the wealthy; the federal income tax is one of the few progressive taxes in the United States because at least on paper (I say that because these marginal rates often do not equate the larger effective rates given that the wealthy are afforded more loopholes, deductions, and lower rates on investment income), the rich pay larger marginal rates than the middle-class and poor.   Thus, with our political discussion largely limited to the federal income tax, it should come as no surprise conservatives are so easily able to frame “The State,” especially the federal government, as a perverse Robin Hood who steals from the rich (the makers as they are being called now) to give to the poor (the takers).

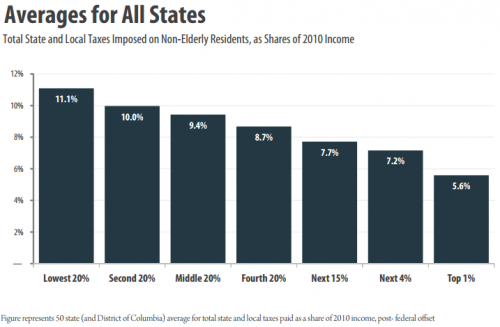
The non-profit, non-partisan Institution on Taxation and Economic Policy recently released its research on the taxes families in the United States paid in 2010.  These findings reveal when the focus is taken off the federal income tax and the entire tax system is examined, cumulative household taxes in nearly every state are regressive because the less money a family makes, the larger proportion they pay to the different levels of government.  As the graph below shows, the cumulative tax system is regressive because sales, excise and property taxes offset progressive income taxes at both the state, and federal levels.

The tax system as a whole is largely regressive because the higher one’s class standing, the lower the proportion of total taxes they pay.  While the report provides great details in the variations across each state, the graph below shows that on average, the lowest 20% of earners pays an overall tax rate that is more than twice of what the top 1% of earners pay.

While many citizens perceive the U.S. tax code as inherently unfair because the wealthy have higher marginal rates on their federal income tax (the only one anyone ever seems to talk about); an examination of the entire system reveals the opposite as cumulatively, the poor pay a larger proportion of their income to local, state, and the federal governments.

—————————

Jason Eastman is an Assistant Professor of Sociology at Coastal Carolina University who researches how culture and identity influence social inequalities.