Can political leaders put partisanship aside to govern in a crisis? The COVID-19 pandemic has proved to be a crucial test of politicians’ willingness to put state before party. Acting swiftly to slow the spread of a novel virus and cooperating with cross-partisans could mean the difference between life and death for many state residents.

The first confirmed case of the novel coronavirus in the United States was reported in Washington state in January 2020. New cases, including incidents of community spread, continued to be recorded across the country in February. However, federal-level efforts to “flatten the curve” did not begin in force until March. Michigan’s Democratic Governor Gretchen Whitmer was among the first governors to openly criticize the Trump administration’s slow response. Her criticism led to an open partisan feud on Twitter between the two leaders.

In the absence of a national
order to limit the virus’ spread within the country, state governors took
action. Leaders in states with some of the earliest-recorded cases – such as
Washington, Illinois, and California – put stay-at-home or shelter-in-place
orders into effect shortly after the US closed its northern and southern borders to non-essential travel. In a matter of weeks,
most states’ residents were under similar orders.

Did governors’ decisions to order their states’ residents to hunker down vary by party? In the figure below, I have plotted the date stay-at-home or shelter-in-place orders went into effect (as of April 15, according to the New York Times) by the date of the state’s first reported confirmed case of COVID-19 (according to US News & World Report). States with Democratic governors are labeled in blue and Republican governors are labeled in red. As of April 15, no statewide stay-home orders had been issued in the Republican-governed states labeled in grey on the plot.
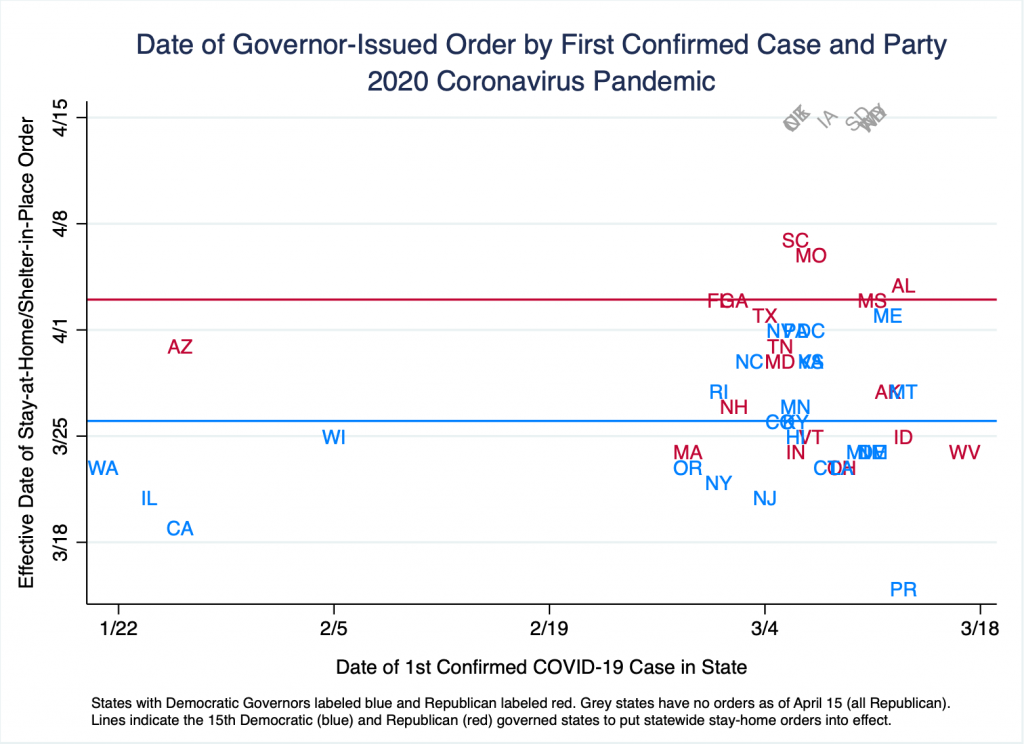
Of the 50 states plus
Washington DC and Puerto Rico, a total of 44 governors have issued stay-at-home
or shelter-in-place orders. All Democratic-governed states were under similar
orders after Governor Janet Mills called for Maine’s residents to stay home
beginning April 2. By contrast, just over two-thirds of states led by
Republican executives have mandated residents stay home. Eight states – all led
by Republicans – had not issued such statewide orders as of April 15, 2020.
States without stay-at-home orders have had substantial outbreaks of COVID-19,
including in South Dakota where nearly 450 Smithfield Foods workers were infected in April
causing the plant to close indefinitely.

Republican governors have generally been slower to issue restrictions on residents’ non-essential movement. Democrats and Republicans govern an equal number of states and territories on the above plot (26 each). Fifteen Democratic governors had issued statewide stay-home orders by March 26. The fifteenth Republican governor to mandate state residents stay home did not put this order into effect until April 3. This move came after all states with Democratic governors had announced similar orders and over two weeks after COVID-19 cases had been confirmed in all states.

The median number of days Democratic governors took to mandate their residents to stay home after their state’s first confirmed case was 21 days. By contrast, the median Republican governor took four additional days (25) to restrict residents’ non-essential movement, not accounting for states without stay-home orders as of April 15.

In short, the timing of
governors’ decisions to mandate #stayhomesavelives appears to be partisan.
However, there are select cases of governors putting public health before party.
Ohio’s Republican Governor Mike DeWine has been heralded as one example. He was
the first governor to order all schools to close, an action for which CNN
described DeWine as the “anti-Trump on coronavirus.” These deviations from the norm suggest that
divisive partisanship is not inevitable when governing a crisis.

Morgan C. Matthews is a PhD candidate in sociology at the University of Wisconsin-Madison. She studies gender, partisanship, and U.S. political institutions.

Because everything is currently terrible, I binge-watched Love is Blind. In case you are planning to do the same, this is a spoiler-free post.

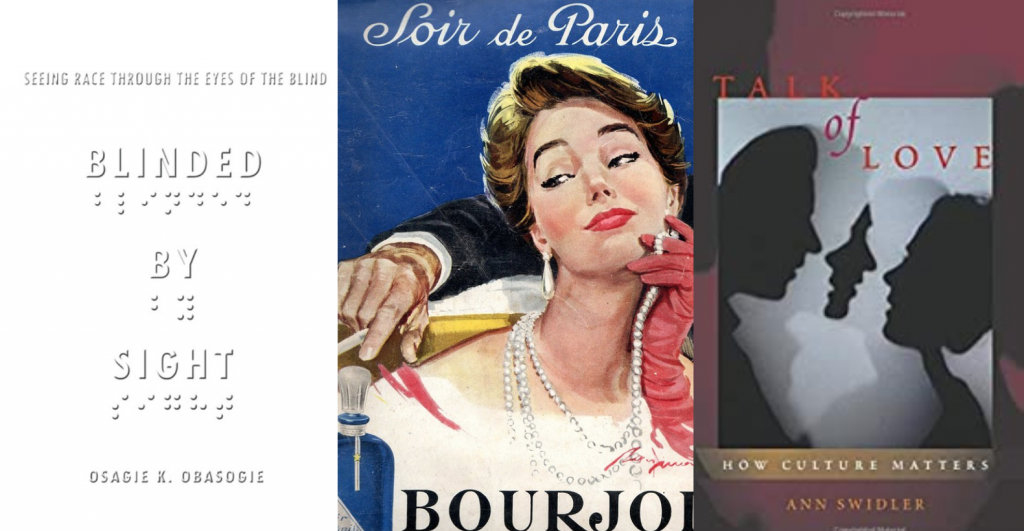
You probably know the premise: contestants in this romantic reality romp go on speed dates in little pods. They can’t see their conversation partners, and at the end of the dates they decide whether to get engaged before seeing each other. The question is whether love can flourish when we cast aside our assumptions about appearances, including race, wealth, and sexuality.1 It is a mess. I couldn’t look away.

What struck me most about the show isn’t actually what unfolded, but instead how it is based on an interesting assumption about the way biases work: if you can’t see anything to make a snap judgment, you have to be genuine and objective, right? This reminded me of how people use the term “colorblind” to signal that they don’t feel racial bias. Scholars are critical of this colorblindness because it suggests that ignoring social differences is the same as reducing biases against those differences.

Does limited information actually make us less likely to make snap judgements? Social science findings are a pretty mixed bag. 

On the one hand, taking information away in some cases has been shown to give people a fair shot. One big example is the “ban the box” movement. This policy reform effort works to remove the initial reporting of felony convictions on applications, based on the fact that people with criminal records often face high rates of discrimination when they try to get jobs or go to school

On the other hand, “blindness” doesn’t necessarily reduce bias. Our brains are pattern-making machines ready to fill in any gaps with our own best guesses. One of the most interesting findings on this is that people who are blind still understand race in visual terms. Experimental studies show that people can “smell” social class, matching perfume scents alone to our assumptions about taste and wealth. Jumping to conclusions is exactly what the mind does when you give it an incomplete picture, and you can see this lead to some particularly cringe-worthy moments early in the show.

Love may be blind, but all our senses give us social signals.

Implicit biases are implicit for a reason: they happen whether or not you are trying to stop them. The important part is to recognize them and consciously work to set them aside, rather than thinking they can be cast out by cutting off your information or attention. Again, avoiding spoilers, I think the most successful couples on the show were self-aware enough to know how much work they would have to put in after leaving the pods. For the couples who thought the experiment made this “meant to be”—that their relationship was somehow special, pre-ordained, or protected by the process—well, we got our fair share of drama.


1 They kept calling the show an “experiment.” The scientist talked about “testing hypotheses.” This irked me, because you know IRB would absolutely freak out if one of us tried to propose this as a study.

Evan Stewart is an assistant professor of sociology at University of Massachusetts Boston. You can follow his work at his website, or on BlueSky.

Who’s afraid of a global pandemic? We all are, at the
moment. But like so many other forms of fear, concern about medical issues is
much more acute for people in precarious and vulnerable social positions. The
privileged—particularly those who are white and upper class—can more afford not
to be preoccupied with health and medical concerns, including pandemics.

In our new book Fear Itself, we found consistent support for updating our classic theories about vulnerability. Classic theories often understand vulnerability in physical terms. But risk and vulnerability are also social, rather than primarily physical, and we found consistent evidence that members of disadvantaged status groups—particularly women, racial and ethnic minorities, and those with lower levels of social class—had higher levels of fear across many domains.

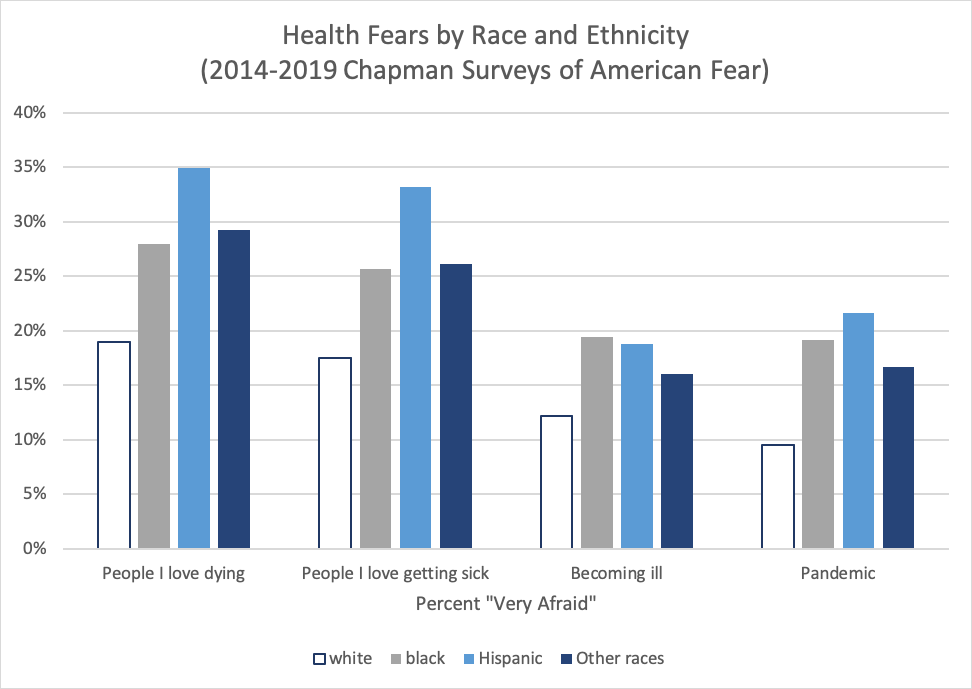
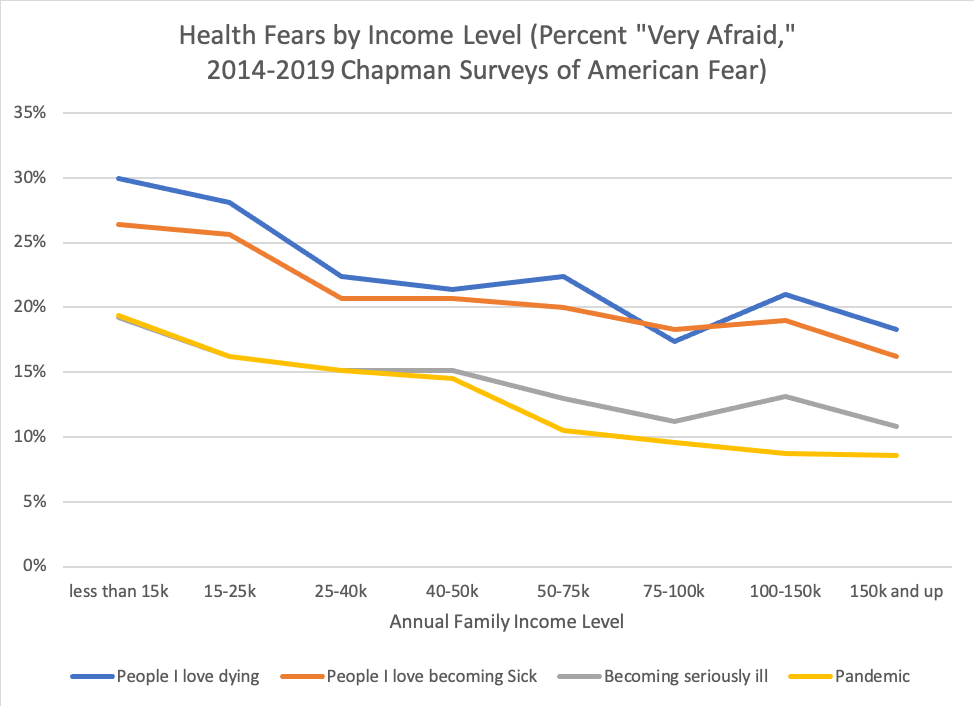
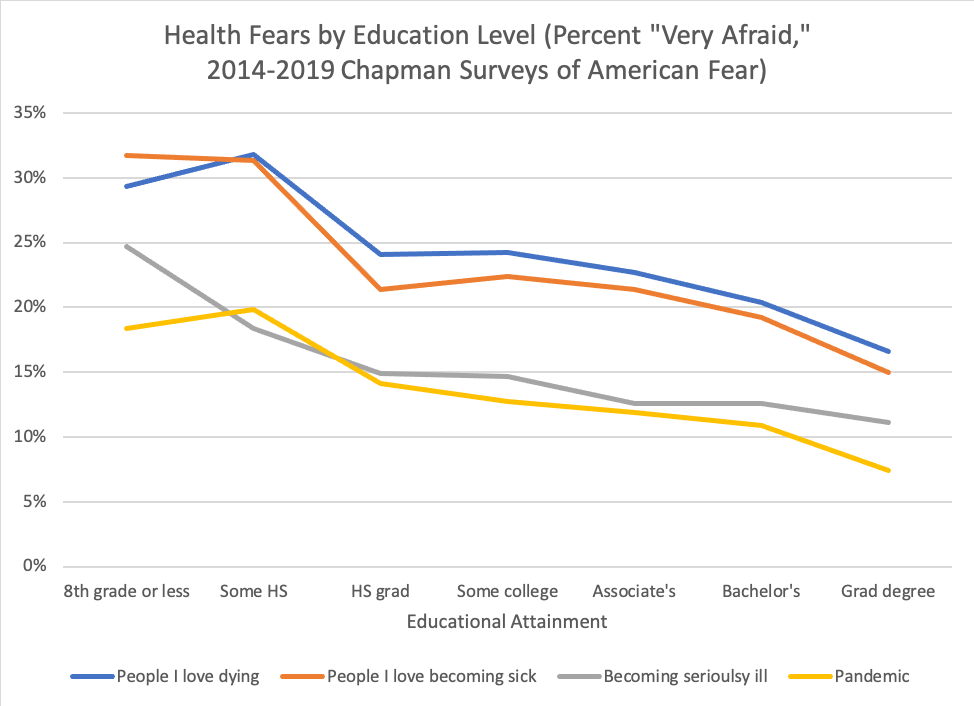
Using pooled data from six waves (2014–2019) of Chapman Survey of American Fears (CSAF), we examined the sociological patterns of fears about disease and health. We looked at fear about four specific issues: global pandemics, fears of becoming seriously ill, and fears about people you love becoming seriously ill or dying.     

The racial and ethnic disparities across these four outcomes
are striking, with white Americans being significantly less likely to report
being “very afraid” of pandemics and medical issues involving themselves or
their families. Hispanic Americans reported the greatest concern about all four
issues, likely a reflection of lower rates of health care insurance and access
among Latino/a communities and individuals.

Likewise, we find clear disparities in fears about health and pandemics across different levels of education and family income. Again, the mechanisms are clear, with vast disparities in health care access in the United States, as well as the well-known social determinants of disease both playing a role.

While these patterns are not necessarily surprising, they are nonetheless disconcerting, for a number of reasons. First, in terms of the epidemiology of the Coronavirus pandemic, it is the disempowered who will disproportionately bear the brunt of the negative health effects, and who will be least equipped with the resources to adequately respond if and when they get sick. Second, when preventative public health measures such as quarantines are put in place, it is people in the working and lower classes who can least afford to take time off of work or keep their children home from school in order to comply with public health procedures.

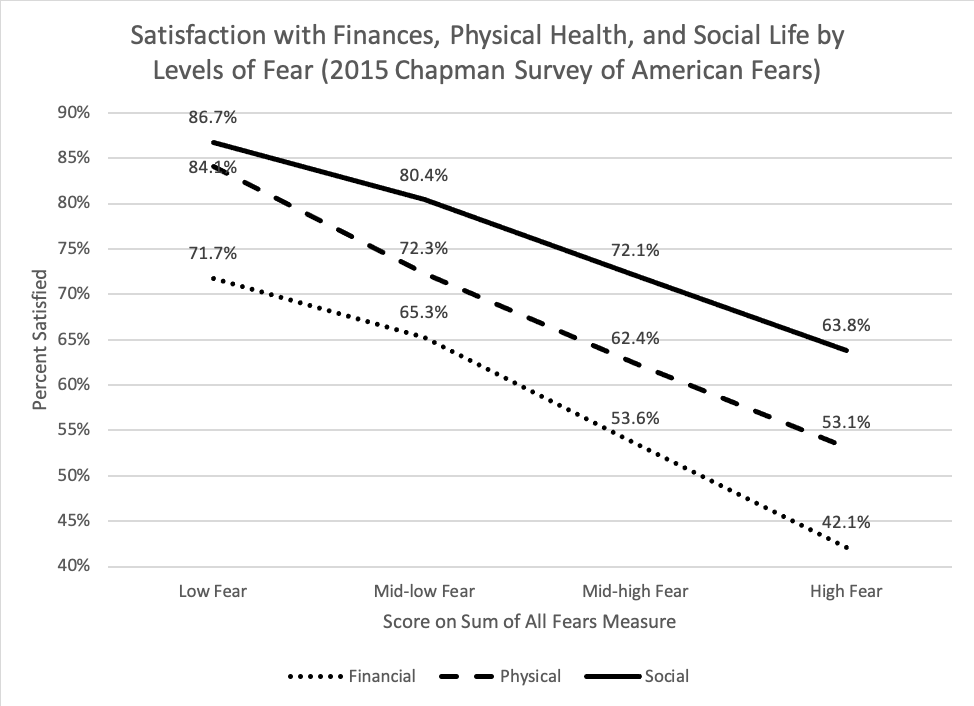
Not only does fear disproportionately prey upon people in less powerful social positions, it also exacerbates and deepens inequality. Higher levels of fear and anxiety are strongly and significantly related to harmful health outcomes, even after accounting for the social inequalities that structure who is afraid in the first place. In Fear Itself we created an omnibus fear metric we called the “Sum of All Fears” that combined levels of fear across a wide range of domains, including but not limited to health, crime, environmental degradation, and natural disasters. Scores on this global, summary fear metric once again produced strong support for social vulnerability theory; but levels of fear were also strongly connected to steep declines in quality of life across a range of domains, including social, personal, and financial well-being.

Taken together, fear is both a reflection of and a source of social inequality. This is true for the current global Coronavirus pandemic and the accompanying concerns, but it will also be the case long after the pandemic has passed. Our hope is that sociologists, social psychologists, and public health officials begin to consider how fear factors into and deepens social inequality.

Joseph O. Baker is Associate Professor in the Department of Sociology and Anthropology at East Tennessee State University and a senior research associate for the Association of Religion Data Archives.

Ann Gordon is Associate Professor of Political Science and Director of the Ludie and David C. Henley Social Science Research Laboratory, Chapman University.

L. Edward Day is Associate Professor and Chair of the Sociology Department at Chapman University.

Christopher D. Bader is Professor of Sociology at Chapman University and affiliated with the Institute for Religion, Economics and Culture (IRES). He is Associate Director of the Association of Religion Data Archives (www.theARDA.com) and principal investigator on the Chapman University Survey of American Fears.

Sociologists spend a lot of time thinking about lives in social context: how the relationships and communities we live in shape the way we understand ourselves and move through the world. It can be tricky to start thinking about this, but one easy way to do it is to start collecting social facts. Start by asking, what’s weird about where you’re from?

I grew up on the western side of the Lower Peninsula of Michigan, so my eye naturally drifts to the Great Lakes every time I look at a map of the US. Lately I’ve been picking up on some interesting things I never knew about my old home state. First off, I didn’t realize that, relative to the rest of the country, this region is a hotspot for air pollution from Chicago and surrounding industrial areas.

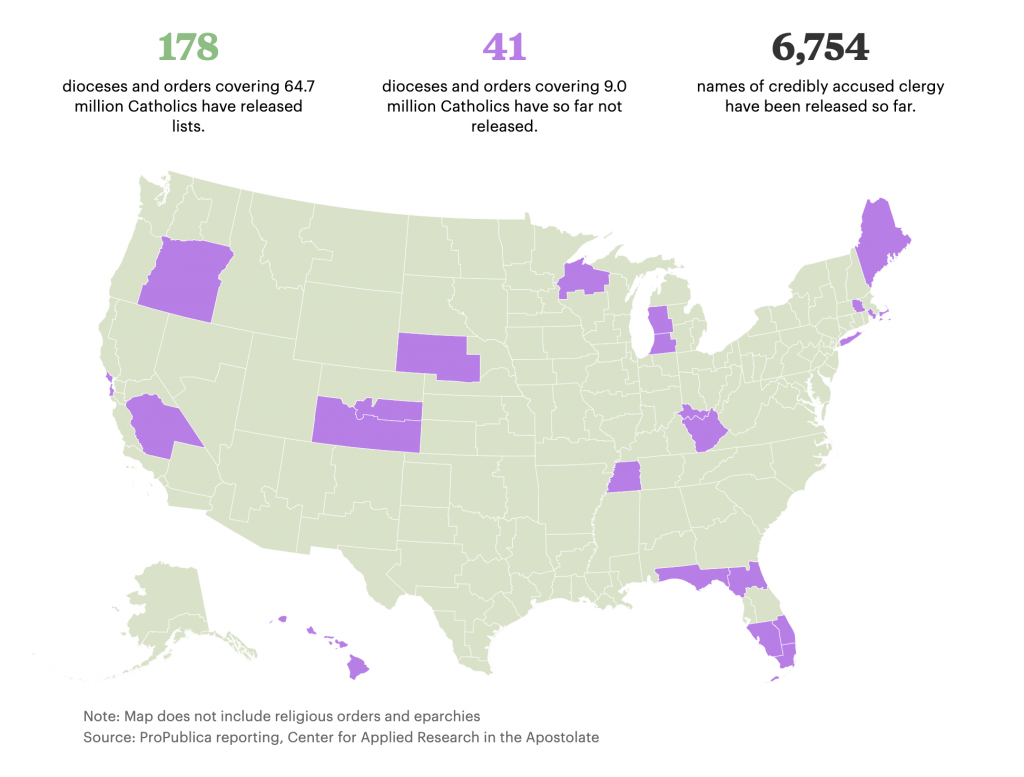
Second, I was looking at ProPublica’s reporting of a new database of Catholic clergy credibly accused of abuse, and noticed that the two dioceses covering western MI haven’t yet disclosed information about possible accusations. I didn’t grow up Catholic, but as a sociologist who studies religion it is weird to think about the institutional factors that might be keeping this information under wraps.

Third, there’s the general impact of this region on the political and cultural history of the moment. West Michigan happens to be the place that brought you some heavy hitters like Amway (which plays a role in one of my favorite sociological podcasts of last year), the founder of Academi (formally known as Blackwater), and our current Secretary of Education. In terms of elite political and economic networks, few regions have been as influential in current Republican party politics.

I think about these facts and wonder how much they shaped my own story. Would I have learned to like exercise more if I could have actually caught my breath during the mile run in gym class? Did I get into studying politics and religion because it was baked into all the institutions around me, even the business ventures? It’s hard to say for sure.

What’s weird about where YOU’RE from? Doing this exercise is great for two reasons. First, it helps to get students thinking in terms of the sociological imagination — connecting bigger social and historical factors to their individual experiences. Second, it also helps to highlight an important social research methods point about the ecological fallacy by getting us to think about all the ways that history and social context don’t necessarily force us to turn out a certain way. As more data become public and maps get easier to make, it is important to remember that population correlates with everything!

Evan Stewart is an assistant professor of sociology at University of Massachusetts Boston. You can follow his work at his website, or on BlueSky.

It’s Valentine’s Day, and my social media feed is more snarky than smarmy. The Hallmark holiday gets us thinking about love, but it also highlights our unquestioned assumptions about romantic relationships. The culture of love is tied up in all kinds of expectations: what we buy, how we date, even who does the dishes. A lot of sociological thought works to make these assumptions explicit, breaking them down to reveal the (sometimes sad) truth that many of us haven’t really thought that much about how we really want to love and be loved. 

But social science isn’t always depressing! Some recent work actually has pretty good news about the state of our romantic relationships. One example is Philip Cohen’s article published in Socius last year on “The Coming Divorce Decline.” Where many of us have gotten used to a story about rising divorce rates over the past few decades, Cohen finds that the probability of divorce for women has been declining from 2008 to 2017. Especially encouraging, he also finds that the probability of divorce for newly married women has been declining over same time period. 

Cohen, Philip N. 2019. “The Coming Divorce Decline.” Socius: Sociological Research for a Dynamic World 5:237802311987349.

In the article, Cohen writes:

…because the risk profile for newly married couples has shifted toward more protective characteristics, it appears certain that—barring unforeseen changes—divorce rates will further decline in the coming years.

And he even highlights how new data supported this prediction from an earlier draft of the paper!

Another example is a recent op-ed from Stephanie Coontz in The New York Times: “How to Make Your Marriage Gayer.” This piece is packed with current social science on relationships, from how couples split the housework to how they handle stress. One big takeaway from the research is better reported relationship outcomes for same-sex couples, and Coontz explains this in terms of our unquestioned assumptions about our love lives. Heterosexual couples tend to revert to more traditional assumptions about gender and relationship roles. But with fewer assumptions about gender and family roles at play, same-sex couples often have to (gasp!) openly talk about their needs, negotiate expectations, and generally do the things that make a relationship really strong.

So, if you’re grumpy this Valentine’s Day, remember that there’s some good news as well. As we learn more about what makes relationships work, we make it easier to navigate romance in a more open and honest way.

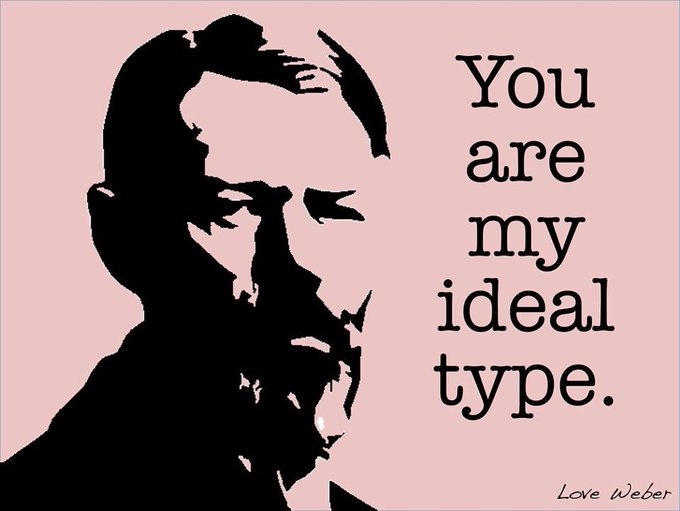
Hat tip to Erin McDonnell for tweeting this amazing SocValentine

Evan Stewart is an assistant professor of sociology at University of Massachusetts Boston. You can follow his work at his website, or on BlueSky.

Mattel, creator of the Barbie doll, has launched “a doll line designed to keep labels out and invite everyone in—giving kids the freedom to create their own customizable characters again and again.”  This doll has minimal makeup, a short hairstyle with an attachable long-hair wig, a flat chest, flat feet (for wearing sneakers, hiking boots, or platform sandals), and clothing that includes femme and butch options.  The clothes and accessories can, of course, be interchanged into dozens of different combinations. 

Creatable World Doll – Let Toys Be Toys Blog

For those old enough to remember the 1960s dolls, I have one word for you:  Skipper.  For those too young to know, Skipper was Barbie’s little sister and had a pre-pubescent body: flat chest and flat feet, since she was too young to wear heels. Imagine Skipper only with hair that could go off and on, and a more expansive wardrobe (which, in the 60s, we would have called “tomboy”).

https://www.flickr.com/photos/51764518@N02/16366423021
Vintage Skipper Doll, Joe Haupt, Flicker CC

In fact, Mattel sidestepped controversy by diplomatically calling the new doll “customizable” rather than gender-inclusive.  This doll does not include adult body types at all.  It is more of a genderless kid than a gender inclusive adult.  For gender inclusion recognizes that policies, programs, and language need to be broader to encompass the fluidity of gender expression and orientation.  According to Gender Spectrum, the organization whose mission is to create a gender-inclusive world for all children and youth, gender inclusivity means being open to everyone regardless of their gender identity and/or expression.  Gender inclusion would thus include people with large breasts who identify as men and people with penises who identify as women.    

Of course, Mattel’s 12-inch plastic dolls were never particularly realistic, and never had genitalia.  In addition, anyone with even an ounce of creativity could, and did, dress their Barbie doll in the clothing that came with a Ken or G.I. Joe doll, cut off Barbie’s hair, pierce Ken’s ears, draw on tattoos, create their own accessories, and so on.   

Interestingly, Mattel has already made Barbie dolls dressed as men.  Between 2011 and 2019, Mattel released an Elvis Barbie, a David Bowie Barbie, a Frank Sinatra Barbie, and an Andy Warhol Barbie.  These are standard buxom Barbie dolls dressed as the iconic male figures.  Some might consider these dolls at least as gender-bending as the Creatable WorldTM dolls.  But they are also less threatening because they are marketed to adult collectors, not to kids who will play with them.  And Mattel has yet to create Marilyn Monroe Ken or Barbra Streisand Ken. (If you’re listening, Mattel, I’ll accept royalties.)

Frank Sinatra Barbie
Frank Sinatra Barbie, Miss Vinyl, Flickr CC

Changing your Barbie’s skin color was a little more challenging, but by 2009, Barbie’s 50th anniversary, Mattel had released far more ethnically diverse Barbies, although they were still primarily princesses, graceful goddesses, and buxom movie stars.  Over its nearly 60-year history, Barbie’s body shape remained a lingering complaint of feminist critics, well after Barbie got more racially diverse and Teen Talk Barbie no longer said “Math class is tough.”  For even the pilot and presidential candidate Barbies had big chests and really tiny waists, making one wonder if she would hit that glass ceiling pointy boobs first.  Sure, it could be seen as a sign of strength that Barbie does everything Ken does, only in downward pointing feet that only fit in heels.  But as millennials began to become moms who buy (or refuse to buy) Barbies (see, e.g., this feminist mom’s explanation), and Mattel’s sales started to plummet, Mattel began to rebrand itself in 2016 with the launch of new Barbie body types—petite, tall, and curvy. 

Perhaps Lena Dunham, whose nudity in Girls was considered transgressive, deserves thanks.  We should also thank the artists and activists who had a dream for Barbie and used social media to share it, going much farther than Mattel to re-imagine Barbie, gender, and pop culture.  Indeed, they make Creative WorldTM dolls look pretty conventional.  The changes Mattel has been making can be seen as a direct result of the willingness of artists, activists, and fans to playfully engage with—rather than simply criticize—their dolls.  Creatable WorldTM dolls may be another step Mattel is taking to embrace diversity and include more consumers.  How far it will go might once again depend on what fans of the dolls demand and how creative people get in making their own visions known.

Martha McCaughey is Professor of Sociology at Appalachian State. She blogs on sexual assault prevention at See Jane Fight Back (www.seejanefightback.com)

I just wrapped up my political sociology class for the semester. We spent a lot of time talking about conflict and polarization, reading research on why people avoid politics, the spread of political outrage, and why exactly liberals drink lattes. When we become polarized, small choices in culture and consumption—even just a cup of coffee—can become signals for political identities. 

After the liberals and lattes piece, one of my students wrote a reflection memo and mentioned a previous instructor telling them which brand of coffee to drink if they wanted to support a certain political party. This caught my attention, because (at least in the student’s recollection) the instructor was completely wrong. This led to a great discussion about corporate political donations, especially how frequent contributions often go bipartisan.

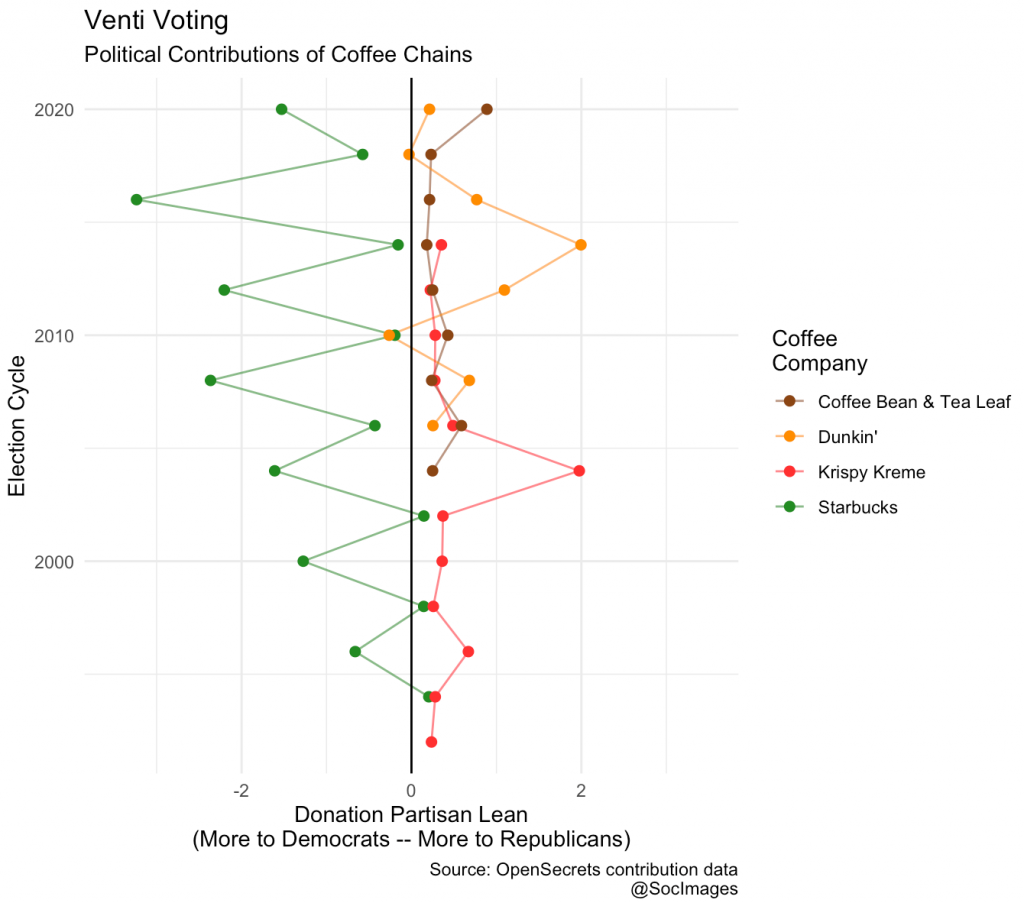
But where does your money go when you buy your morning coffee? Thanks to open-access data on political contributions, we can look at the partisan lean of the top four largest coffee chains in the United States.

Starbucks’ swing to the left is notable here, as is the rightward spike in Dunkin’s donations in the 2014 midterms. While these patterns tend to follow the standard corporate image for each, it is important to remember that even chains that lean one way still mix their donations. In midterm years like 2012 and 2014, about 20% of Starbucks’ donations went to Republicans.

One side effect of political polarization is that corporate politics don’t always follow cultural codes. For another good recent example of this, see Chick-fil-A reconsidering its donation policies.

Evan Stewart is an assistant professor of sociology at University of Massachusetts Boston. You can follow his work at his website, or on BlueSky.

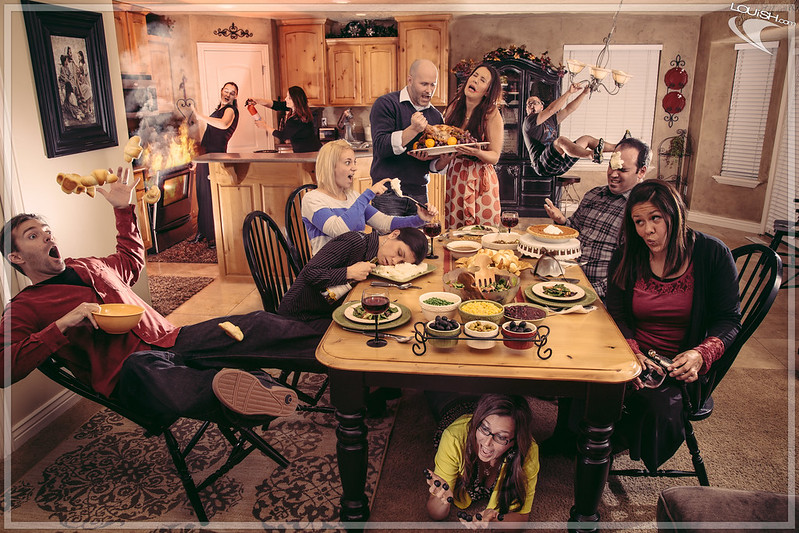
Tis’ the season for throwing down at dinner. Every year the humor and the horror stories about Thanksgiving hit our social media feeds. This isn’t just about politics, either. Family dinners have a strong symbolic significance. When the stakes are high for a once-a-year gathering, other kinds of social conflicts are primed to play out as well.

Photo Credit: Louish Pixel, Flickr CC

But for all this talk about fighting, one thing I find really interesting as a political sociologist is just how much work people do to avoid conflict. We know from embedded studies of parent organizations and neighborhood groups that people will tie themselves up in knots to avoid talking about political issues. In some cases, people are more likely to confide in near-strangers or acquaintances than close family members. In an increasingly fraught political climate, the answer for many people might be cutting their visits short. According to research published last year Science, there is some evidence for this happening.

In the article, political scientists matched anonymous smartphone location data from over 10 million Americans to precinct-level voting data from 2016. By doing this, they could see who traveled for Thanksgiving that year and how long they stayed at dinner. People who ate in an opposing political district spent less time at dinner, about 30-50 minutes less on average. The pattern was stronger for people coming from Republican districts to dine among Democrats—they split about 50 to 70 minutes sooner. The authors also find that increased local political advertising was also associated with cut-down dinner time.

Sure, these people could be storming out before that second helping. But I think one of the less-appreciated trends in political life is that many of us are just clamming up and cutting out early to spend time elsewhere. There are many perfectly valid reasons to do this, especially if people are made to feel unwelcome or unsafe. These results suggest we could all do a little more to think about keeping people at the table.

Evan Stewart is an assistant professor of sociology at University of Massachusetts Boston. You can follow his work at his website, or on BlueSky.