Archive: Apr 2012

The presence of vintage cars on Cuban roads is one of the  most iconic consequences of the 50-year-old U.S. trade embargo on the communist country.  Cubans, however, have had to preserve many other types of items that Americans routinely replace, while making do with the gradual deterioration that comes with age.

Offering another peek into this life, Ellen Silverman has been photographing Cuban kitchens.  NPR describes how they capture, among other things, the “grand, but crumbling” architecture,” mismatched kitchenware, and vintage appliances:

See the photographs of Cuban kitchens and more at her webpage.

Lisa Wade, PhD is an Associate Professor at Tulane University. She is the author of American Hookup, a book about college sexual culture; a textbook about gender; and a forthcoming introductory text: Terrible Magnificent Sociology. You can follow her on Twitter and Instagram.

Cross-posted at OrgTheory.

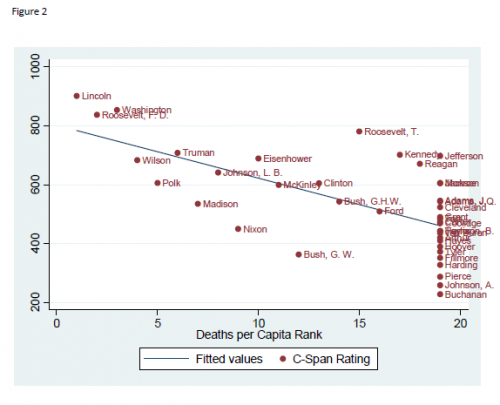
David Henderson and Zachary Gouchenour have a paper on the topic of presidential ratings. The finding is simple. American war casualties, as a fraction of the population, positively correlate with how historians rate U.S. presidents. More death = better presidents. The regression model includes some controls, like economic growth. Here’s the chart:

This is consistent with sociological research on state building, which has traditionally linked wars, bureaucratic growth, and tax collection. See, for example, Charles Tilly’s classic work “Warmaking and Statemaking as Organized Crime.”  My one criticism of the paper is that there is no measure in the regression that controls for “big legislation” (i.e., New Deal). Historians like law passing and it might account for some variation. I have a hunch that is how variation on the right hand side of the figure would be explained.

Henderson and Gouchenour then spin out the policy implication. Greatness rankings by historians may prompt presidents to start more wars. The historians may have more blood on their hands than we care to admit.

Adverts: From Black Power/Grad Skool Rulz

—————————

Fabio Rojas is an Associate Professor of Sociology at Indiana University. He is the author of two books: From Black Power to Black Studies: How a Radical Social Movement Became an Academic Discipline and Grad Skool Rulz: Everything You Need to Know about Academia from Admissions to Tenure.  Rojas’ academic research addresses political sociology, organizational analysis, and computer simulations.

Wired has posted a set of photos by Richard Ross highlighting the  harsh reality of life in juvenile detention centers  — locations where about 60,000 kids reside each night throughout the U.S. According to the article,

The U.S. locks up children at more than six times the rate of all other developed nations. The over 60,000 average daily juvenile lockups, a figure estimated by the Annie E. Casey Foundation (AECF), are also disproportionately young people of color. With an average cost of $80,000 per year to lock up a child, the U.S. spends more than $5 billion annually on youth detention.


The images are at Wired, and you can read more about the project, Juvenile-in-Justice, including a schedule of shows, at Ross’s website. His photos also appear in the Annie E. Casey Foundation report No Place for Kids.

You might also want to check out our previous posts on treatment of prisoners during Hurricane Katrina and overcrowding in California prisons.

And thanks to Karl for the tip about the article!

Gwen Sharp is an associate professor of sociology at Nevada State College. You can follow her on Twitter at @gwensharpnv.

In a fantastic editorial in the New York Times, sociologist Amy Schalet interprets new data from the CDC that shows that young men and women are now losing their virginity at about the same age.  Never-married males between aged 15-19 have essentially the same probability of being a virgin as females:

Schalet draws on her own research comparing American and Dutch teenagers to explain this trend, citing fear and love.  Regarding fear, she writes:

…I found that American boys often said sex could end their life as they knew it. After a condom broke, one worried: “I could be screwed for the rest of my life.” Another boy said he did not want to have sex yet for fear of becoming a father before his time.

The other reason for the increase in the age of virginity loss among boys is romance.  Even in the face of cultural narratives that tell boys that all they want is sex, they tell personal stories of love and emotional connection (yes, even to grown-up lady sociologists).  This loosening of rigid gender roles can be credited to feminism, Schalet contends, and even if it has “largely flown under the radar of American popular culture,” it is nonetheless given boys the “cultural leeway to choose a first time that feels emotionally right.”

For more about Amy Schalet’s research, see Consequences of U.S. and Dutch Approaches to Teen Sex and Talking Sex, Relationships, and Teen Health with Amy Schalet.

Lisa Wade, PhD is an Associate Professor at Tulane University. She is the author of American Hookup, a book about college sexual culture; a textbook about gender; and a forthcoming introductory text: Terrible Magnificent Sociology. You can follow her on Twitter and Instagram.
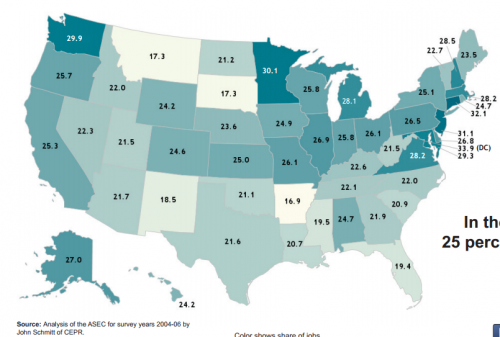
P. Mae Cooper sent in a report from the Center for Economic and Policy Research that looked at economic insecurity in the U.S. Using data from the Census Bureau’s Annual Social and Economic Supplement, the authors calculate the percentage of good jobs in each state. They define a good job as one that pays at least $17/hr (the inflation-adjusted median income for men in 1979), which for a full-time year-round worker would mean an annual income around $35,000, and which provides health insurance and retirement benefits. Overall, about 1 in 4 jobs fit this definition of a good job, with quite a bit of variation by state:

The data was for 2003-2005, so this doesn’t reflect any effect of the recession on the types of jobs available.

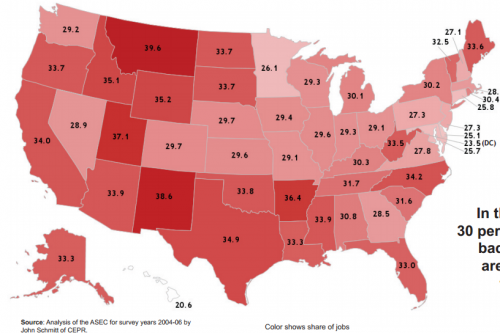
They also calculated the % of jobs that don’t meet any of the elements of a good job — that is, they pay under $17/hr, they don’t provide health insurance, and they don’t have any retirement plan available. These are more common than good jobs, making up about a third of all jobs in the typical state:

One criticism of the official poverty line is that it doesn’t account for regional differences in cost of living, as well as supplementary forms of income supports (Social Security, unemployment, etc.). The authors used Survey of Income and Program Participation data to calculate economic insecurity by taking into account regional costs of living.

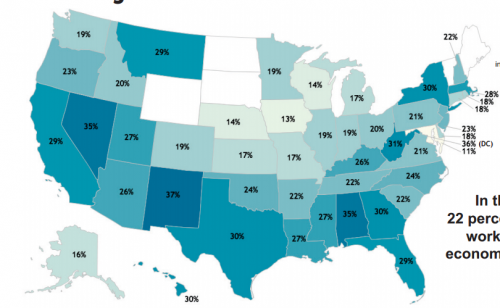
The calculations include data for 1) working families and 2) only those families that have 1 or 2 adults and o to 3 children, so it excludes families where not adults are employed or that have 4 or more children. And the data are for 2001-2003, so again, it doesn’t reflect the recession. This map shows the % of the included families whose total income is less than the basic budget standard (that is, actual market costs of essential goods and services in over 400 localities) where they live. About 22% of families were economically insecure, with a lot of variation by state:

I really hope someone updates this analysis, given the recession, but the report provides a general illustration of an important aspect of our economy, and the limitations of a measure of poverty that entirely ignores regional costs of living.

Cross-posted at Reports from the Economic Front.

While the press cheers on every sign of private sector job creation, little attention is being paid to public sector job destruction.  As the Economic Policy Institute reports, while there has been an increase of some 2.8 million private sector jobs since June 2009, public sector employment (federal, state, and local governments combined) has actually fallen by approximately 600,000.  As the figure below reveals, this is a very unusual development .

wwwepiorg.png

According to the Economic Policy Institute, if the percentage growth of public sector employment in this recovery had followed past recovery trends, we would have an additional 1.2 million public sector jobs and some 500,000 additional private sector jobs. A separate reason for concern about this trend is that lost public sector jobs generally means a decline in the services that we need to sustain our communities.  The withering away of our public sector during a period of expansion should worry us all.

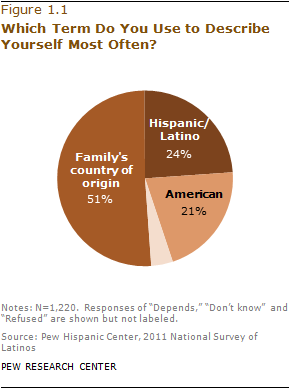
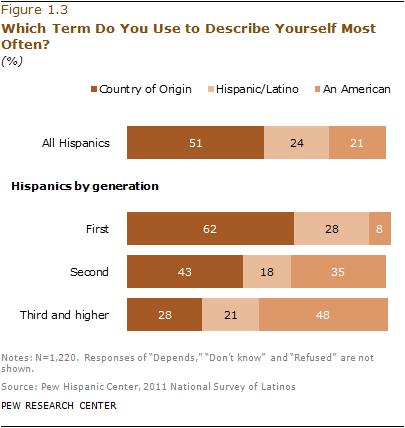
In 1970, the U.S. Census added a “country of origin” question to its demographics section, which asks respondents if they are “of Hispanic, Latino, or Spanish origin.” But a new Pew Hispanic Center report indicates that, while these might be the official terms for those from Spanish-speaking countries and/or Latin America, they aren’t the preferred or most popular labels among those they’re supposed to identify. Only about 1 in 4 use the terms Hispanic or Latino most frequently to describe themselves:

Not surprisingly, identification with different labels differs among recent immigrants and those born in the U.S. Among the first generation, country of origin is the overwhelming preference, but by the third generation, just over 1 in 4 choose that as their most common self-identifier:

Most respondents had no preference between the terms Hispanic or Latino, but for those who did, Hispanic was more popular:

White was the most commonly-chosen racial identification:

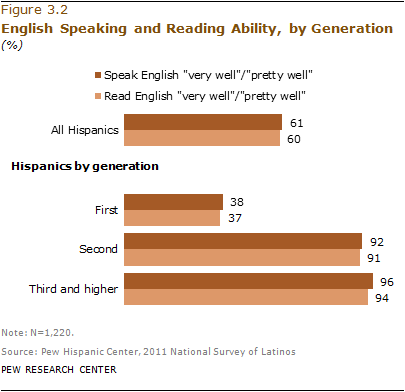
Most respondents also said that while they think it’s important that Hispanics be able to speak Spanish in the U.S., that learning English is very important for success. By the second generation, almost all rate themselves as knowing English “pretty” or “very” well:

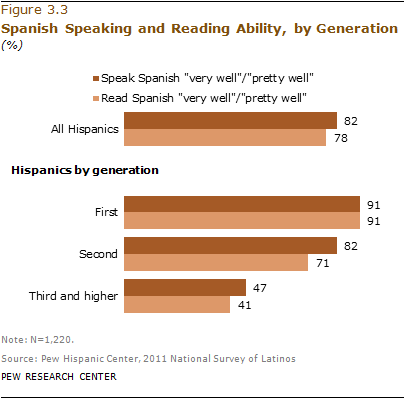
Conversely, among third-generation Hispanics, under half say they speak or read Spanish equally well:

Check out the full report for tons of additional information on identification, language use, etc.

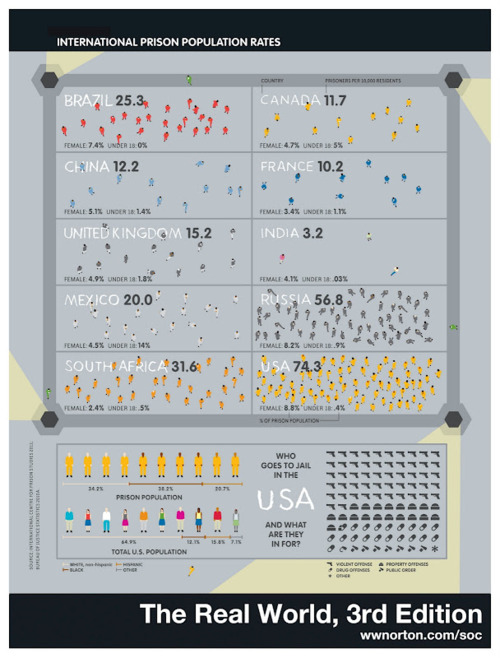
Norton Sociology recently posted an image that illustrate differences in rates of imprisonment in a number of countries. Imprisonment rates are influenced by a number of factors — what is made illegal, how intense law enforcement efforts are, preference for prison time over other options, etc. The U.S. does not compare favorably, with 74.3 per 100,000 10,000 of our population behind bars (click here for a version you can zoom in on, and sorry for the earlier typo!):

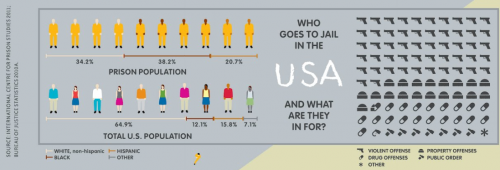
Here’s a close-up of the breakdown of the U.S. prison population:

Via Urban Demographics.