Archive: Jul 2011

Back when we were kind of obsessed with “man” and “woman” symbology — e.g., whether traffic lights ever include female figureshow stick figures tend to be male, unless they’re parenting, the weird world of default avatars, and also this interesting alternative symbol for disability — I had considered writing a post featuring the then-stewardess, now-flight attendant icon seen on airplanes.  Airplanes have a longer life than cars and, so, many of the airplanes operated by commercial companies still have the old stewardess icon: a friendly round head with a dress.  These were old planes though, I figured, so the post wouldn’t pack much of a punch. They were like that, back then, after all.

Lo and behold, MirandaB took a flight on Delta and snapped a photograph of an undeniably modern incarnation of the friendly round head:

Delta chose to use a digitally-skirted stick figure on its task screen.  Just to be clear, Delta still, in 2011, feels comfortable representing “flight attendants” as 100% female.  That’s a win with the language, a fail with the symbology.

According to the Bureau of Labor Statistics, women account for 81% of flight attendants, not 100% by a long shot.  But you can see why men might be reluctant to join their ranks.

Also in gender, sexism, and air travel: Sexism in Aviation, Then and Now, Selling Feminine Passivity, “Singapore Girls” and Emotion Work, and Fly the Unfriendly Skies.

Lisa Wade, PhD is an Associate Professor at Tulane University. She is the author of American Hookup, a book about college sexual culture; a textbook about gender; and a forthcoming introductory text: Terrible Magnificent Sociology. You can follow her on Twitter and Instagram.

Cross-posted at Reports from the Economic Front.

The Wall Street Journal recently surveyed more than 50 economists, asking them what they thought was the main reason U.S. firms were not hiring more workers.  Approximately 65% answered that it was a lack of demand for goods and services, 27% thought it was uncertainty about government policy, and 8% said it was the existence of more “favorable” hiring conditions overseas.

One might think that with so many economists citing a lack of demand as the primary reason for our continuing high rate of unemployment, those same economists would argue that getting more money into the pockets of working people would be a good strategy for recovery. But did the survey also reveal strong support by economists for a higher minimum wage, new union-friendly labor laws, a single payer health plan, an increase in social security payments, an aggressive industrial policy? No.

In fact, according to the Wall Street Journal, “Despite their forecasts for slow growth and an elevated unemployment rate, the economists aren’t in favor of futher action either by the Fed or the Federal government.”  In other words there was no support for policies (micro or macro) that would dramatically change the economic environment.

There is good reason for rejecting this preference for the status quo.  Take a look at the chart below which comes from an article in Investor’s Business Daily.  Each point on the chart shows the change in total wages (adjusted for inflation) over the previous ten years.


wage-depression.png

As the article notes:

The past decade of wage growth has been one for the record books — but not one to celebrate.

The increase in total private-sector wages, adjusted for inflation, from the start of 2001 has fallen far short of any 10-year period since World War II, according to Commerce Department data. In fact, if the data are to be believed, economy-wide wage gains have even lagged those in the decade of the Great Depression (adjusted for deflation).

Two years into the recovery, and 10 years after the nation fell into a post-dot-com bubble recession, this legacy of near-stagnant wages has helped ground the economy despite unprecedented fiscal and monetary stimulus — and even an impressive bull market.

Over the past decade, real private-sector wage growth has scraped bottom at 4%, just below the 5% increase from 1929 to 1939, government data show.

To put that in perspective, since the Great Depression, 10-year gains in real private wages had always exceeded 25% with one exception: the period ended in 1982-83, when the jobless rate spiked above 10% and wage gains briefly decelerated to 16%.

In other words, we are experiencing a steady and long term decline in total real wages, one that was worsened but not caused by the Great Recession.  Thus, there is little reason to believe that maintaining existing policies will lead to any meaningful increase in wages and, by extension, overall demand and employment.

How did the economy grow over the last decade despite this decline in wages?  As we known, the answer was a debt-driven housing bubble.  How is the economy growing now that the housing bubble has popped?  Here is the answer given by Investor’s Business Daily:

So how has the economy managed to scale new GDP heights despite sagging real wages?

Real disposable income is up 3.6% since December 2007, thanks to nearly $1 trillion in government support via higher social benefits (up $583 billion since the recession began); lower tax bills (down $255 billion); and higher government wages and benefits (up about $125 billion).

Absent those sources of support, real disposable income would still be 5% below its prior peak.

What the article doesn’t mention is that in contrast to the decline in total real wages, corporate profits and stock prices have been soaring.  In fact, the trends are related: the decline in wages is one of the main reasons for the growth in profits and stock prices.  Economists at the Center for Labor Market Studies discuss these trends and their relationship in a recent study, which includes the following table:

sum_etal.png

With these trends in mind the professional consensus for the status quo becomes easier to understand.  So does the need to actively oppose it.


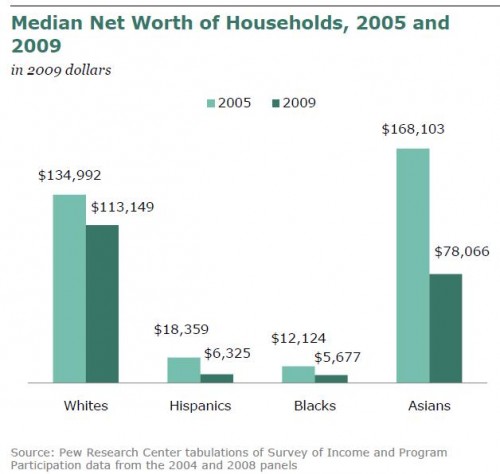
The Pew Research Center just released an analysis of 2009 government data on the wealth gap between White non-Hispanics, African Americans, and Hispanics, and it’s pretty depressing. It’s not just that the gap is so large, but also that Hispanic and African American households have such low median worth in absolute terms (p. 13 in the report):


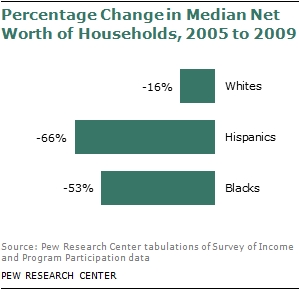
A quarter of Hispanics and Blacks have no assets other than a vehicle, compared to 6% of Whites. And 35% of Black and 31% of Hispanic households had negative median net worth in 2009, with their debts outweighing all of their assets; this was true of only 15% of White non-Hispanics.This is partially because African Americans and especially Hispanics were disproportionately hit by the effects of the housing crisis, the single largest source of reduced wealth. Overall, those two groups have suffered a much more dramatic loss in assets than Whites (sorry, Asians weren’t included in all the images, and Native Americans aren’t included in any):

The result is a wealth gap that is the largest it has ever been since the government began making such data available in the early ’80s. White non-Hispanics have nearly 20 times higher median wealth than Blacks, and 15 times as much as Hispanics:

For more details, check out the full report. The implications of these disparities, and the low levels of financial assets available to African Americans and Hispanics compared to Whites, is truly stunning.

In Cultures of War: Pearl Harbor/Hiroshima/9-11/Iraq, John Dower discusses how the U.S. responded to the Japanese attack on Pearl Harbor on December 7, 1941. Militarily, it pushed the U.S. into officially entering World War II, but Dower is just as interested in cultural responses, particularly efforts to stigmatize all U.S. residents of Japanese descent as unpatriotic or even traitorous.

A prime example of this is the film December 7th, created by John Ford, legendary director of classics such as Stagecoach and The Grapes of Wrath. The first version of the film was 82 minutes long. In it, an idealistic figure representing the U.S. talks with “C,” a figure meant to represent his conscience. Uncle Sam naively believes the racial and ethnic diversity of Hawaii isn’t a problem, but C helps him see that the large Japanese American population is a threat, even when they appear to be loyal, patriotic, assimilated Americans. Japanese-language telephone books and newspapers are ominously shown as evidence of their lack of true American-ness. Start at about 8:40:

The message is unequivocal: Japanese Americans are untrustworthy, and any actions or behaviors that seems to indicate that a Japanese American is loyal to the U.S. provides potential evidence of just how deceitful they are — they cover their treachery with an appearance of patriotism. At around 18:25, Uncle Sam tries to defend freedom of religion, but C patiently explains the problem with this view. C says he’s not saying all Japanese Americans are disloyal, but that he’s “just presenting the facts,” and can’t be responsible for separating the loyal from the disloyal.

Ford cut the film down to 34 minutes before releasing it. This shortened version of December 7th won the 1943 Oscar for Best Documentary Short Subject:

The attack scene from December 7th is often assumed to be actual documentary footage of the attack on Pearl Harbor, but Dower points out that it was almost entirely staged by Ford, since there was almost no existing film of the surprise attack available.

Dower also discusses the animated Disney film Victory through Air Power. The film was based on the book Victory through Air Power, by Alexander Seversky. Seversky’s book justifies bombing non-combatant targets as a way to demoralize the enemy and disrupt supply lines and communication. Civilians would no longer be seen as inherently off-limits for military operations. The film served as propaganda for this view, which increasingly took hold in the U.S. military, eventually justifying dropping nuclear bombs on Hiroshima and Nagasaki.

You can find the entire film on Youtube, but the most relevant segment is at the end; the widespread bombing of (noticeably resident-free) Japanese cities is presented as key to a glorious victory by the U.S.:

These films served to justify military strategies (internment camps and bombing non-military targets) that could have faced stiff resistance by drawing on popular fears in the wake of the Pearl Harbor attack. In both cases, they widened the circle of legitimate potential targets of war-related government actions to not just Japanese soldiers and government officials but to the entire civilian population of Japan, as well as anyone with Japanese ancestry living in the U.S.

This weekend I went to the Annenberg Space for Photography in Los Angeles to see the Beauty CULTure exhibit. The description of the show suggested a critical perspective on beauty:

Through different lenses focused on the body beautiful, the exhibition examines both traditional and unconventional definitions of beauty, challenging stereotypes of gender, race and age. It explores the links between beauty and violence, glamour and sexuality and the cost (in its multiple meanings) of beauty.

The exhibit, to be fair, included a 30-minute documentary that touched on several critiques: the socialization of children, the pressure felt by adult women, the role of capitalism, and sizism and racism in the industry (featuring Lauren Greenfield’s work on girl culture and weight loss camps and Susan Anderson on child pageants).

But the actual photographs in the exhibit overwhelmingly affirmed instead of challenged our beauty culture.  While the four images above, highlighted at the website, include an Asian woman, an older woman, and a picture of a child beauty pageant contestant designed to make us question how we raise children, the actual photographs were mostly conventionally-attractive, white, thin professional models glamorously outfitted, posed, and lit.  These photographs outnumbered those that included women of color, older women, “plus-size” women, and critical images (e.g., photos of cosmetic surgeries) by something like 10 to 1.  I didn’t leave feeling like I’d gained some perspective on the crushing pressure to be “perfect”; I left feeling like I’d flipped through a Cosmopolitan, awash in idealized images of female beauty, and more consciously aware of my deficiencies than when I arrived.

I say, skip it.

Lisa Wade, PhD is an Associate Professor at Tulane University. She is the author of American Hookup, a book about college sexual culture; a textbook about gender; and a forthcoming introductory text: Terrible Magnificent Sociology. You can follow her on Twitter and Instagram.

Cross-posted at Reports from the Economic Front.

Austerity advocates talk about government spending as if its impact on the economy is marginal. In their world, we can slash spending with few if any consequences for our roads and bridges; transportation, health care, and educational systems; research and development activity; investment in plant and equipment; employment and wage levels; economic growth . . . the list goes on.

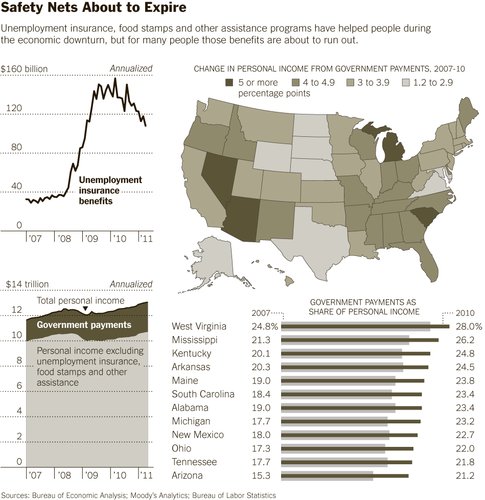
That may be how it looks in their world, but in the real world it is quite different. Looking just at personal income, for example, the New York Times reports that:

An extraordinary amount of personal income is coming directly from the government.

Close to $2 of every $10 that went into Americans’ wallets last year [2010] were payments like jobless benefits, food stamps, Social Security and disability, according to an analysis by Moody’s Analytics. In states hit hard by the downturn, like Arizona, Florida, Michigan and Ohio, residents derived even more of their income from the government.

If the austerity advocates have their way, public spending will be cut. However, as the information in the box below reveals, the consequences will be severe for our entire economy, not just for those individuals directly receiving support. As the New York Times explains, “Throughout the recession and its aftermath, government benefits have helped keep money in people’s wallets and, in turn, circulating among businesses. Total government payments rose to $2.3 trillion in 2010, from $1.7 trillion in 2007, an increase of about 35 percent.”

We definitely need to remake our political-economy. However, it is madness to think that destroying the social infrastructure underpinning current economic activity is a productive way to achieve that goal.

For a little dose of vintage sexism, I present to you an old Van Heusen ad, sent in by Leticia (via 22 Words):

I am still trying to figure out what a “man-talking” tie is, exactly, but I am more than happy to cede the “power-packed patterns” on those ties to the world of men.

The College Board has released data from an initiative with the aim of better understanding the educational pathways of men of color.  Their site includes testimonials from many of these men, in addition to the data below.  And they included Native American men, a group almost always left out of quantitative data analysis because they are such a small percent of total Americans (in a profound and tragic irony).  Here’s the data on what each group of men are doing after high school.

About 1/3 of African American and Hispanic men are enrolling in some sort of college, another 34 and 47%, respectively, face unemployment.  A significant proportion go straight into work.  The 5% incarceration rate for Hispanics, and the 10% rate for Blacks, is a sad testimony to the over-policing of poor, urban neighborhoods, racial profiling, and emphasis on prosecuting the crimes of the poor.

Native American men are significantly less likely than Black men to go to college or vocational school.  They are most likely to straight into a job or be unemployed.  While not all all Native American men live on reservations — not by a long shot, those that do are more likely to be unemployed because of the dismal economic profiles of many of these regions.

Asian men are more likely to enter postsecondary education than either Native American or Black men, but the 61% is balanced by a good 30% ending up unemployed.  This reflects the diversity of the Asian community.  Some Asian groups do very well in the U.S. — e.g., Japanese and Asian Indians — others are still struggling — e.g., Hmong and the Vietnamese.

The charts below compare men and women in each group.  Each, with the exception of Native Americans, reveals the feminization of postsecondary education and the relative advantage women see in the market (mostly because we’ve got a strong service economy that hires women disproportionately).

Hat tip to Sociology Lens.

Lisa Wade, PhD is an Associate Professor at Tulane University. She is the author of American Hookup, a book about college sexual culture; a textbook about gender; and a forthcoming introductory text: Terrible Magnificent Sociology. You can follow her on Twitter and Instagram.