Prepared for the Council on Contemporary Families Online Symposium on Civil Rights
February 4-6, 2014

Introduction.

In 1963, Rev. Dr. Martin Luther King, Jr. made his famous “I Have a Dream” speech at the March on Washington, the momentous demonstration that helped spur passage of the Civil Rights Act the following year. He described African Americans as living “on a lonely island of poverty in the midst of a vast ocean of material prosperity.” A half-century after the Civil Rights Act we can assess how much progress African-Americans have made in key areas such education, employment, income, health, and longevity.

Certainly, many African Americans have moved into positions of power that were scarcely imaginable when Dr. King gave his speech. In 1964 there were only 100 Black elected officials in the country. By 1990 there were 10,000. Since then there have been two Black Secretaries of State, and America’s first African-American president is now in his second term.

The number of Black households earning $100,000 a year or more has increased by 500 percent in the past 50 years, to about one-in-ten of Black households. African Americans have even headed several Fortune 500 companies. Examples include Dr. Clifton R. Wharton, Jr., former Chairman and CEO of TIAA-CREF, Ursula M. Burns, Chairman and CEO of Xerox Corp., Kenneth I. Chenault, Chairman and CEO at American Express, and Kenneth C. Frazier, President and CEO of Merck & Co. Inc. Many African Americans have also attained unprecedented wealth, status, and respect in the news, entertainment, and sports industries.

Yet despite these individual attainments, African Americans remain heavily underrepresented in the highest ranks of the business world, comprising barely one percent of the CEOs of the Fortune 500. Oprah Winfrey is the only African American on the Forbes 400 richest Americans list. And in the lower echelons of the income ladder, racial economic disparities have been remarkably persistent and gotten worse in a few respects.

Education.

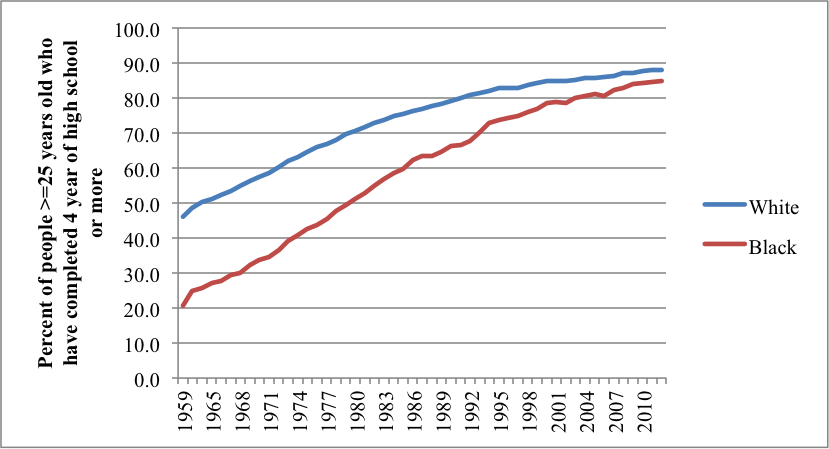
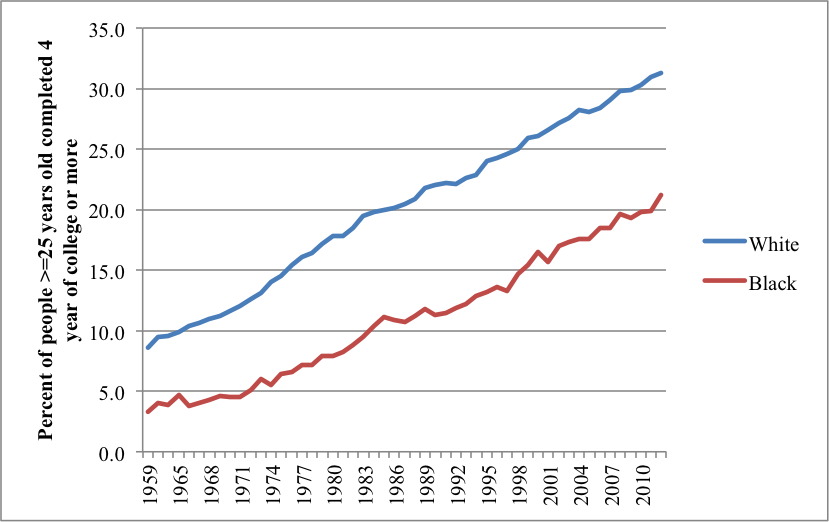
Over the past 50 years, there has been considerable progress in the educational attainments of African Americans, although they still lag behind the levels of Whites. In 1966, the high school completion rate of African Americans was just a little more than half that of White Americans. By 2012 it was almost 95 percent that of Whites. In 1966, fewer than four percent of African Americans, compared to more than ten percent of Whites, had college degrees. By 2012, the percentage of African Americans with college degrees had risen to 21.2, compared to 31.3 percent for Whites (U.S. Census, Education and Social Stratification Branch, 2013). See figures below (click to expand).

Source: U.S. Census Bureau. 1947, and 1952 to 2002 March Current Population Survey, 2003 to 2012 Annual Social and Economic Supplement to the Current Population Survey (non-institutionalized population, excluding members of the Armed Forces living in barracks); 1950 Census of Population and 1940 Census of Population (resident population).

But after declines in school segregation during the 1970s and 1980s, progress leveled off and even reversed in some areas. In 1968, 76.6 percent of African American children attended segregated schools. In 2012, 74 percent of African American children were in segregated schools, 15 percent of them in schools where less than one percent of the student body was White (Orfield, Kucsera, & Siegel-Hawley, 2012). Majority Black schools are generally characterized by lower funding, lower teacher quality, and higher drop-out rates than majority White schools (The Leadership Conference on Civil and Human Rights, 2013).

Employment and Income.

There have been significant improvements in employment opportunities for African Americans over the past half century. In 1960, only 6.7 percent of African Americans in the labor market were in professional and managerial positions, compared to 26 percent of Whites (Smith & Welch, 1977). By contrast, in 2012, 30 percent of employed African Americans were in professional and managerial positions, compared to 39 percent of employed Whites (U.S. Bureau of Labor Statistics, 2012). African American women have made especially significant gains and are now more likely than their male counterparts to occupy professional and managerial positions.

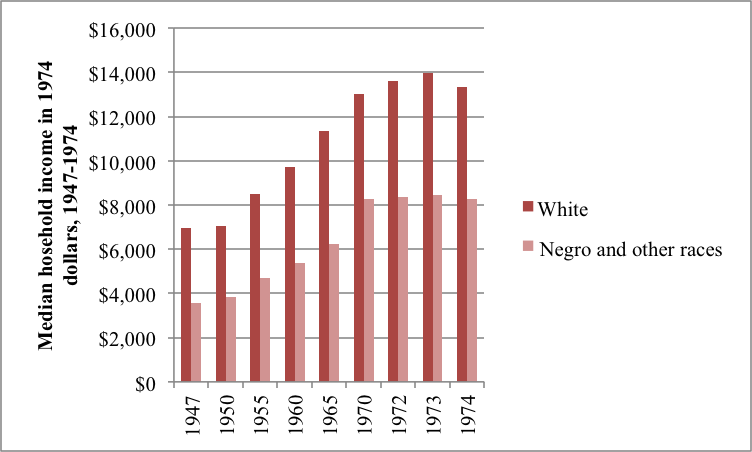
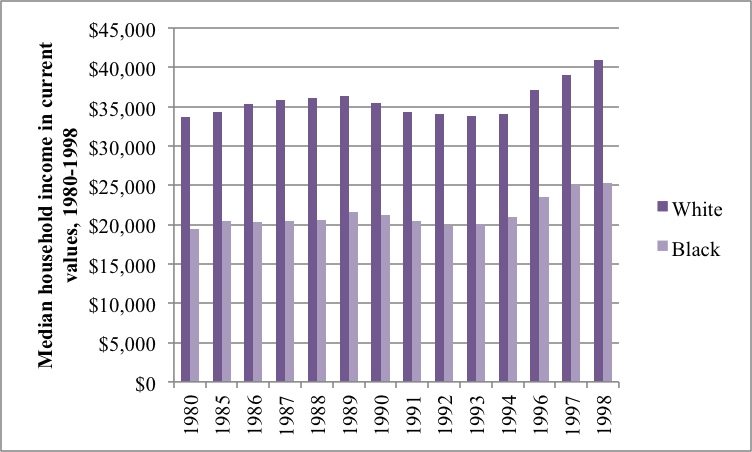
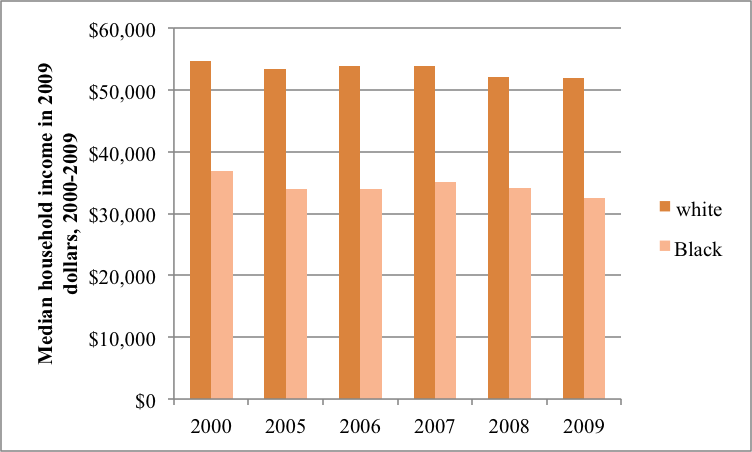
However, African Americans professionals earn significantly less than their White peers, and African American women in such occupations earn less than their male counterparts. In 2012, the median weekly earnings for African American women who worked in “management, professional, and related occupations” were $838, compared to $958 for White women, $1,021 for African American men, and $1,339 for White men (U.S. Bureau of Labor Statistics, 2012). See bottom of page for charts on median household income in historically and recently by race.

Overall, despite absolute progress in Black earnings, the income gap between Blacks and Whites remains large. In 1963, African American workers earned 55 cents for every dollar earned by Whites. By 2012, that had risen to 78.4 cents, leaving Blacks still more than 20 percent behind (U.S. Bureau of Labor Statistics, 2013).

The wealth gap is even higher, due to the lower value of homes in predominantly black communities and the much smaller access of African Americans to any accumulated wealth of parents and grandparents. The median wealth of White households is ten times as large as that of Black households.

Educational disparities may explain some of the remaining gap in pay equity. We have come some distance from the 1960s, when African Americans with a four-year college degree earned less than White men with only a high school diploma (Katz & Stern, 2006; Taylor, 1981). Today, by contrast, being college graduate counts for more than being a White man in determining earnings.

Yet as late as 2012, African American men and women still earned less than their White peers with the same level of education. For male college graduates over age 25, Whites’ weekly earnings were $1,399, compared to $1,086 for African Americans. College–graduated Black women, aged 25 years and older, had weekly earnings of $913, compared to $1,012 for White women with similar educational attainment. White men with a high school diploma earned over $150 more a week than similarly-educated African American men — $760 vs. $604 per week. In fact, a Black man with an associate’s degree earns, on average, $15 per week less than a White man with only a high-school diploma (U.S. Bureau of Labor Statistics, 2013).

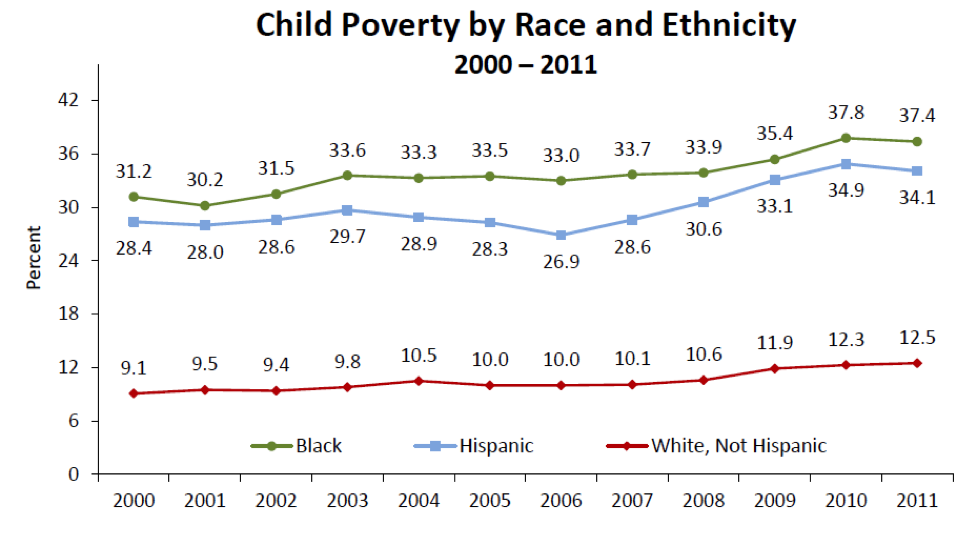
Unemployment and Poverty.

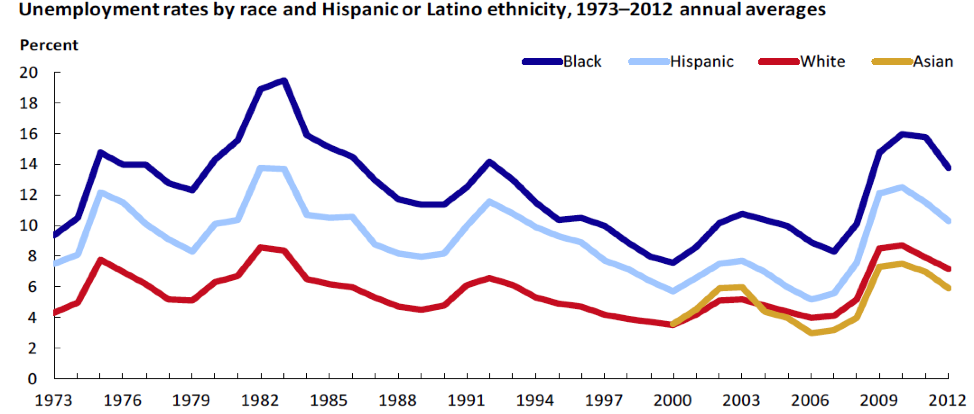
African Americans are also more likely to lose their jobs during economic downturns (see figures below; click to expand). Despite ups and downs in unemployment for all racial and ethnic groups, the Black unemployment rate has consistently been twice as high as that of Whites since the 1950s.

Source: U.S. Department of Labor, Bureau of Labor Statistics, Table B-35 & Table B-37. Data related to persons 16 years of age and over.
Source: U.S. Bureau of Labor Statistics, (2013). Labor force characteristics by race and ethnicity, 2012.
 And since 1964, the poverty rate of African Americans has consistently been more than twice that of Whites. Worse, Blacks are far more likely to live in areas of concentrated poverty. Among Americans born between 1985 and 2000, 31 percent of Blacks, versus only one percent of Whites, live in neighborhoods where 30 percent of the residents are poor (see figures below; click to expand).
Source: U.S. Department of Health and Human Services, Office of the Assistant Secretary for Planning and Evaluation. Information on poverty and income statistics: A summary of 2012 current population survey data.

Social and Institutional Disparities.

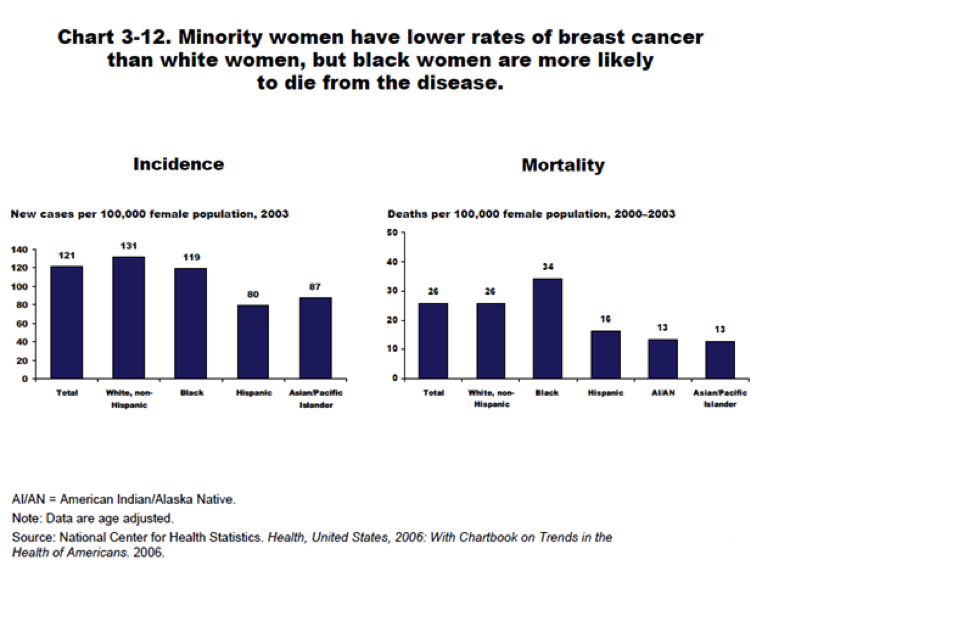
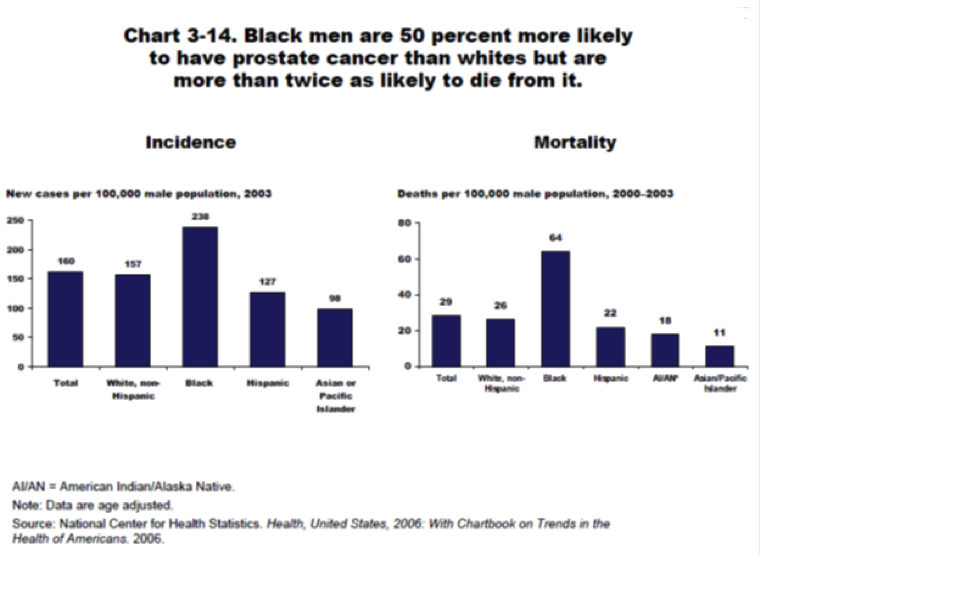
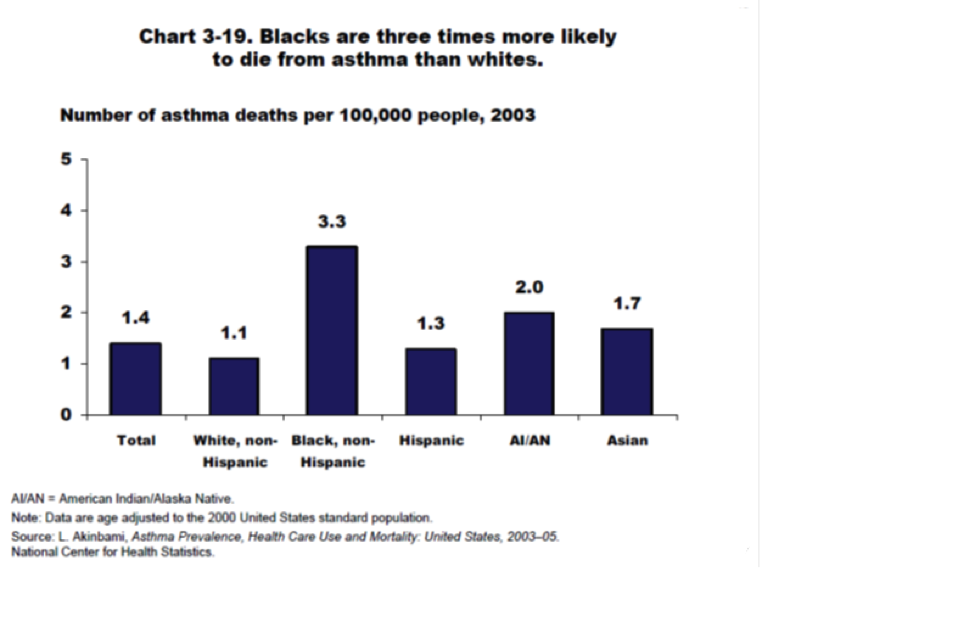
African American children are at greater risk than their White counterparts for numerous problems associated with growing up in poverty, (e.g., poor prenatal health care, malnutrition, poor quality housing, and exposure to environmental toxins). This helps explain why African Americans are disproportionately affected by chronic illnesses, such as cancer, heart disease, and diabetes, and, because of lack of access to quality health care, are more likely to die from these illnesses and diseases (Mead, Cartwright-Smith, Jones, Ramos, Woods, & Siegel, 2008). Blacks are three times as likely to die from asthma as Whites. Black women are less likely than White women to develop breast cancer, but more likely to die from it (Mead et al, 2008). And Black maternal mortality rates are three to four times higher than rates for Whites. (See end of paper for charts of racial and ethnic health disparities by race.)

While life expectancies for all Americans have greatly improved over time, African Americans continue to have a shorter life expectancy than Whites. In 2008, there was a 5.5 year gap between African American and White men, and a 3.8 year gap between African American and White women (U.S. Census, 2010). African American men have the shortest life expectancy at birth of all Americans across racial and ethnic groups (see figure below; click to expand).

Source: U.S. National Center for Health Statistics, National Vital Statistics Reports (NVSR), Deaths: Preliminary data for 2008, Vol, 59, No.2.

Incarceration.

The rate of imprisonment is one area where there has been significant deterioration for African Americans in the past half-century. Incarceration rates among African American men are three times higher than 50 years ago and the disparity between incarceration rates for African Americans and Whites has continued to grow. African American men are more likely to be arrested and receive longer sentences for nonviolent drug crimes than Whites committing similar or more serious offenses. In consequence, African Americans, who are just ten percent of the overall U.S. population, represent 35.4 percent of the prison population, with an incarceration rate more than six times higher than Whites. One in three African American men can expect to go to prison at some point in his life time, compared to one in 17 White men. (Pettit & Western, 2004).

Conclusion.

As we reflect on the state of African Americans 50 years after the passage of the Civil Rights Act, it is clear that despite the progress made in many arenas of life, African Americans are still burdened by the legacy of slavery, segregation, and discrimination. In fact, it may be that the dramatic successes of a minority of Blacks have made it harder for Americans to recognize the continuing disparities and injustices facing the remainder.

For further information, contact Velma McBride Murry, Professor and Betts Chair, Human and Organizational Development Dept., Vanderbilt University; velma.m.murry@vanderbilt.edu.

References

Centers for Disease Control and Prevention (2010). National Center for Health Statistics. U.S. Department of Health and Human Services.

Eggebeen, D. J., & Lichter, D. T. (1991). Race, family structure, and changing poverty among American children. American Sociological Review, 801-817.

Gabe, Thomas (2013). Poverty in the United States: 2012. Congressional Research Service (CRS) based on U.S. Census Bureau 2012 and 2011 American Community Survey (ACS) data.

Katz, Michael and Stern, Mark, One Nation Indivisible (2006). Russell Sage, p. 95.

King, Martin Luther; King, Coretta Scott (2008). The Words of Martin Luther King, Jr.: Second Edition. Newmarket Press. p. 95.

Lichter, D., ZHENCHAO, Q., & Crowley, M. (2006). Race and poverty: Divergent fortunes of America’s children?. Focus24(3), 8-16.

Loeber, R., Pardini, D., Homish, D.L., Wei, E.H., Crawford, A.M., Farrington, D.P., et al. (2004). The prediction of violence and homicide in young men. Journal of Consulting and Clinical Psychology, 76, 1074–1088

Mead, H., Cartwright-Smith, L., Jones, K., Ramos, C., Woods, K., & Siegel, B. (2008). Racial and ethnic disparities in US health care: A chart book. Commonwealth Fund New York.

Orfield, G., Kucsera, J., & Siegel-Hawley, G. (2012). E Pluribus… Separation: Deepening Double Segregation for More Students. Civil Rights Project/Proyecto Derechos Civiles.

Pettit, B., & Western, B. (2004). Mass imprisonment and the life course: Race and class inequality in U.S. incarceration. American Sociological Review, 69, 151-169.

Roscigno, V. J., Williams, L. M., & Bryon, R. A. (2012). Workplace racial discrimination and middle class vulnerability. American Behavioral Scientist, 56, 696-710.

Sawhill, I., Winship, S., & Grannis, K. (2012). Pathways to the middle class: Balancing personal and public responsibilities. Washington, DC: Brookings.

Smith, J. P., & Welch, F. R. (1977). African American/White Male Earnings and Employment: 1960-70. In Distribution of Economic Well-Being (pp. 233-302). NBER.

Taylor, D. E. (1981). Education, on-the-job training, and the African American-white earnings gap. Monthly Lab. Rev.104, 28.

The Leadership Conference on Civil and Human Rights (2013). Still segregated: How race and poverty stymie the right to education. http://civilrightsdocs.info/pdf/reports/Still_Segregated-Shadow_Report.pdf.

Washington, James M. (1991). A Testament of Hope: The Essential Writings and Speeches of Martin Luther King, Jr. HarperCollins. Pp. 365–67.

Wolff, Edward N. (2010). Recent trends in household wealth in the United States: Rising debt and the middle-class squeeze-An update to 2007, working paper, Levy Economics Institute, No. 589

U.S.Census of Bureau, Education and Social Stratification Branch, (2013). CPS data on educational attainment: http://www.census.gov/hhes/socdemo/education/data/cps/historical/index.html.

U.S. Bureau of the Census (1974, 1994, 1996, 1997, 1998). Current Population Reports: Income, Poverty, and valuation of Noncash Benefits.

U.S. Bureau of the Census, (2012). Statistical Abstract of the United States, 2012. http://www.census.gov/compendia/statab/2012/tables/12s0691.pdf.

U.S. Department of Health & Human Services, (2012). ASPE issue brief: Information on poverty and income statistics: A summary of 2012 current population survey data. http://aspe.hhs.gov/hsp/12/povertyandincomeest/ib.shtml.

U.S. National Center for Health Statistics, (2010). National Vital Statistics Reports (NVSR), Deaths: Preliminary data for 2008, Vol, 59, No.2.

U.S. Bureau of Labor Statistics, (2013). Labor force characteristics by race and ethnicity, 2012. http://www.bls.gov/cps/cpsrace2012.pdf.

Additional Charts

Source: Historical Statistics of Black America: Agriculture to Labor & Employment. Table 987: Median Family Income 1950-1973. Original source: "Median Income of Families: 1950 to 1974," Current Population Reports, Special Studies, Series P-23, No. 54. The Social and Economic Status of the Black Population in the United States, 1974, 1975, p. 25. Primary source: U.S. Department of Commerce, Social and Economic Statistics Administration Bureau of the Census.
Source: Historical Statistics of Black America: Agriculture to Labor & Employment. Table 987: Median Family Income 1950-1973. Original source: “Median Income of Families: 1950 to 1974,” Current Population Reports, Special Studies, Series P-23, No. 54. The Social and Economic Status of the Black Population in the United States, 1974, 1975, p. 25. Primary source: U.S. Department of Commerce, Social and Economic Statistics Administration Bureau of the Census.
Source: Black Americans: A Statistical Sourcebook, 2000 Edition. Table 7.01: Money income of Households, 1980-1998.   Original source: U.S. Bureau of the Census, Current Population Reports: Income, Poverty, and valuation of Noncash Benefits: 1994, Series P-60, #189, pp. B-2-Table B-1. U.S. Bureau of the Census, Current Population Reports: Money Income in the United States: 1996
Source: Black Americans: A Statistical Sourcebook, 2000 Edition. Table 7.01: Money income of Households, 1980-1998. Original source: U.S. Bureau of the Census, Current Population Reports: Income, Poverty, and valuation of Noncash Benefits: 1994, Series P-60, #189, pp. B-2-Table B-1. U.S. Bureau of the Census, Current Population Reports: Money Income in the United States: 1996
Source: U.S. Census Bureau, Statistical Abstract of the United States, 2012: http://www.census.gov/compendia/statab/2012/tables/12s0691.pdf.
Source: Following charts are drawn from this resource: Mead, Holly, Cartwright-Smith, Lara, Jones, Karen, Ramos, Christal, Woods, Kristy, & Siegel, Bruce (2008).  Racial and ethnic disparities in U.S. health care: A chartbook. The Common Wealth Fund.
Source: Following charts are drawn from this resource: Mead, Holly, Cartwright-Smith, Lara, Jones, Karen, Ramos, Christal, Woods, Kristy, & Siegel, Bruce (2008). Racial and ethnic disparities in U.S. health care: A chartbook. The Common Wealth Fund.
U.S. Supreme Court Justice Sonia Sotomayor shows students at the Berkeley Unified School District one model of Latina success: her own. Photo via flickr.com.

This short essay was part of a CCF series published in February 2013 in honor of the 50th Anniversary of Betty Friedan’s The Feminine Mystique.

Latinas are often described as being either too devoted to their cultural values or not sufficiently connected to them. They are often told that they must choose “one of way of being,” either Latina or American. This expectation not only implies that there is an “authentic” Latina femininity and American femininity, but that their success depends on enacting the “right” femininity.

A prevailing mystique facing Latinas is that their “culture” holds them back from success and fulfillment. More specifically, they are told that machismo and familismo, respectively referring to an exaggerated expression of masculinity among Latino men and sacrificing Latina femininity. There are certainly aspects of Latinas’ cultural backgrounds that privilege men, but this is not unique to Latinas/os. Yet, this is the persistent narrative about Latinas’ challenges. This powerful mystique conveys to Latinas that they must reject their “culture” to be successful.

But numerous Latinas have demonstrated that rejection of their culture is not a prerequisite for pursuing professional and personal ambitions. U.S. Latinas have consistently described themselves as being caught between two worlds, that of their particular communities and that of the dominant society. And it is precisely because of this that Latinas can challenge the idea of an “authentic” Latina or American femininity. Latinas that resist the dichotomies imposed upon them understand that “culture” is not fixed and that they can create new cultural meanings and practices. For instance, some Latinas do not interpret their professional goals and their family as mutually exclusive. Instead, they sometimes link them together as a strategy for success. This way, a desire to “give back” to their families and communities fuels their motivation to persist despite the structural barriers they encounter, such as racist-sexist workplace practices.

In my interviews with 2nd generation working-class Mexican and Puerto Rican girls about their understandings of and approaches to safe sex, I found that the mystique that Latinas’ “culture” impedes their progress was also a condition that shaped how they made sense of their choices and those of other young Latinas. For instance, they interpreted the predicament of teen mothers to be caused by their willingness to adhere to cultural expectations of femininity that had prevented them from enacting sexual self-protective behaviors, such as condom use. The teen women I interviewed saw themselves as being more critical of aspects of their culture and therefore, “not like those girls.” Nevertheless, they still identified as Latinas, rejecting the notion that their sexual behavior reflected their Americanization. Their negotiations of their culture and future goals were connected to their awareness of the damaging stereotypes about Latina women.

There is no denying that culture plays a role in defining Latinas’ lives, but it is not the only factor. We must also pay attention to how misrepresentations of “Latino culture” are utilized to produce this contemporary mystique facing Latinas because of the misrepresentations’ power lies in shifting responsibility for success or failure solely onto Latinas, obscuring the social forces restricting their opportunities.

Lorena Garcia is in the department of sociology at the University of Illinois at Chicago. She is the author of Respect Yourself, Protect Yourself: Latina Girls and Sexual Identity.

To mark the fiftieth anniversary of The Feminine Mystique, CCF hosted an online symposium reflecting on where we are today. Judy Howard offered this short essay on Lesbian Mystiques.

Betty Friedan highlighted the many ways that cultural images and expectations of gender in the 1950s and 60s held women back.  The expectations derived most obviously from patriarchy, which Friedan recognized, but also from white supremacy, capitalism, and heterosexism, which she did not.  In Friedan’s time the feminine mystique certainly constrained women’s senses of themselves and their possibilities, but at least it recognized women as a group.  The “lesbian mystique,” by contrast, denied lesbians even existed.  The concept was literally inconceivable.  In the 19th century, Queen Victoria is rumored to have flatly proclaimed: “Women don’t do that.”

Of course there were lesbian subcultures and activism throughout the ages, even during the heyday of the feminine mystique. A group of us living in Madison WI at the time, not exactly Friedan’s suburban middle America, organized what we rather inflatedly called a national conference of the National Lesbian Feminist Organization.  And there were the womyn’s music festivals, at least one of which continues to this day.  

But through most of the 20th century, to the extent that lesbians were recognized at all, they were viewed as masculine, butch, man-hating (ironically) dykes. Femmes were not regarded as similarly lesbian, since they looked like “normal women.”  Lesbians were also assumed to be working class – out of the middle class mainstream.

These assumptions were held not only by the larger culture, but also by heterosexual feminists, who were worried that recognition of lesbians would endanger the feminist movement.  Friedan herself is infamous for coining the phrase, the “lavender menace” in the late 1960s, when the National Organization for Women excluded lesbians.

National Lesbian Feminist Organization group at an ERA March, Washington, D.C., July 9, 1978 Photograph by Joan E. Biren (JEB), from Joan E. Biren Papers. Sophia Smith Collection, Smith College, Northampton, MA.
National Lesbian Feminist Organization group at an ERA March, Washington, D.C., July 9, 1978
Photograph by Joan E. Biren (JEB), from Joan E. Biren Papers. Sophia Smith Collection, Smith College, Northampton, MA.

Perhaps in reaction to this invisibility and intolerance, lesbians in the ’70s held images and self-definitions that were also limited in some ways. There was an essentialism about 1970s lesbians, evident in an assumption that lesbian behavior predicted a lifetime of lesbian preference and identity. Other even more profoundly unrecognized identities, especially trans identities, were conflated within lesbianism, complicating the presumed “essences” all the more.

These essentialisms have changed markedly in the 21st century.  A recent New York Times essay by Michael Schulman, “Generation LGBTQIA” (January 9, 2013) makes clear that today we recognize a far broader and more fluid dimension of sexual possibilities.  One’s sexual partners are not assumed to always fit one gender profile: they change, they play. Whether or not this fluidity will grow into more stable patterns as these women (and men) age is an open question.

More generally, there has been an astonishingly rapid transformation in public opinion about gay men and lesbians in recent years. In November, for the first time, three U.S. states approved same-sex marriage by popular vote.  Meanwhile, Minnesota defeated the same kind of anti same-sex marriage measure that had passed everywhere it was introduced in the previous 15 years. We can now marry in a number of states, including my own.  We can give birth to children; we can adopt children.  We can serve openly as Presidents and Provosts of major institutions of higher education.  We can serve openly in the military.

I do not mean to suggest that discrimination against lesbians is a thing of the past.  Still, the degree of prejudice and ignorance has been dramatically reduced (in the U.S., certainly not in all global regions), through exactly the kind of consciousness-raising and collective action that Friedan helped pioneer for the women’s movement as a whole.

Judith A. Howard is in the sociology department and is the divisional dean of social sciences at the University of Washington. She is the coauthor of Gendered Situations, Gendered Selves: A Gender Lens on Social Psychology, now in its second edition.

The Civil Rights Act of 1964 not only ushered in stronger federal protections for racial and ethnic minorities and women, but also for religious minorities. Antipathy toward Catholics and Jews in the US was a persistent and prevalent theme through much of American history. It was common for these groups to be labeled “un-American” and even categorized as “non-white.” Members of these religions were often discriminated against in hiring and in admission to institutions of higher learning (this was especially common for Jewish applicants) and excluded from many neighborhoods, clubs, and political positions. From the late 19th through the mid-20th century, organized hate groups, most notably the Ku Klux Klan, used the threat of violence to intimidate not only African-Americans but Jews and Catholics as well.

After World War II, these restrictions and prejudices eased somewhat. By 1955 the now-classic essay Protestant Catholic Jew could proclaim that although these three religions were the primary sources of identity in America, they were now “alternative ways of being an American” rather than two of them being seen as Un-American.

Still, anti-Semitism and anti-Catholicism persisted. In the 1960s, some commentators worried that President Kennedy, a Catholic, would take orders from the Pope. In the 1970s, President Richard Nixon was recorded making several anti-Semitic comments. And even today nativist hate groups continue to perpetuate centuries-old hostilities against Catholic and Jewish Americans. But the Civil Rights Act did give these minorities protection against outright exclusion and discrimination, and other religious minorities have also looked to it for security as the American religious landscape has diversified.

American Religious Belonging Today

Religion scholars consider the United States to be an anomaly on the modern religious scene. Compared to other nations at similar levels of modernization, the United States stands out as highly religious. For example, in Western Europe about three-quarters of the population profess a belief in a God or higher power (with this proportion significantly lower in some individual nations). In America, by contrast, 90 percent of adults profess such a belief. These American numbers have remained fairly stable, with only small long-term declines, over the past fifty years.

However, one major measure of religiosity has changed significantly over that time period: religious belonging, or identifying with a particular religion rather than simply holding religious beliefs.

Click to enlarge.
Click to enlarge.

Currently 80 percent of the U.S. adult population identifies as belonging to one of the 3,500 groups that make up the American religious landscape. Religion scholars categorize these groups in different ways, but one of the most popular classifications divides them into six major American religious traditions: Evangelical Protestants, Mainline Protestants, Black Protestants, Catholics, Jews, and Other Religions. Twenty percent of Americans fall into a seventh category, which sociologists call the ‘religious Nones’ – those who identify with no religious tradition even if they do believe in God or a higher being.

The distribution of Americans among these various groups has fluctuated and changed over the past 50 years. Figure 1 shows these trends in affiliation from 1957-1971 using Gallup polling data and from 1972-2012 using data from the General Social Survey (GSS).

Click to enlarge.
Click to enlarge.


We draw attention to six specific trends:

1)    The Protestant share of the American population has shrunk from more than 70 percent of the population in the late 1950s to less than 50 percent today. This is primarily due to the precipitous decline of Mainline Protestants (e.g. Methodists, Lutheran and Episcopalians), from more than 30 percent of the U.S. population in the 1970’s to around 15 percent today.

2)    Evangelical Protestants (e.g. Baptists, Pentecostals) have increased their representation in the population from less than a quarter of the population in the 1960s to 31 percent in the early 1990s. However, this was the period of their peak membership. Contrary to popular impression, their share of the religious market has since declined to 24 percent.

3)    Catholics have sustained their share of the religious market, remaining at approximately 25 percent throughout the latter half of the 20th century. But this is primarily due to the influx of Latino immigrants to the United States. The share of native born (primarily white) Catholics has declined.

4)    Despite the large percentage of Americans who profess a belief in a higher power, there has been a recent meteoric rise of the religious Nones, from about 3 percent of the population in the mid-20th century, to 10 percent in 2000, to 20 percent today. One in every 5 Americans does not identify with a particular religious tradition.

5)    The proportion of Americans who identify with “Other” religious traditions has doubled, an increase that is closely tied to the increased immigration of Asian populations who brought non-western religions (e.g. Buddhism, Hinduism, Islam) with them. While still a small proportion of the overall population, they contribute greatly to the increased religious diversity of the American religious landscape. In 20 states,scattered in the Midwest and South, Islam is the largest non-Christian religion. Judaism is the largest non-Christian religion in 15 states, mostly in the Northeast, and Buddhism is the largest religion in 13 western states. In Delaware and Arizona, Hinduism is the largest non-Christian religion, while in South Carolina it is the Baha’i. For more details visit here.

6)    According to the Pew Research Centers, “the percentage of US adults who say they are Jewish when asked about their religion has declined by about half since the late 1950s.” It is currently is a little less than two percent.

Religion and Socio Economic Status 

Religious groups differ not only in their beliefs but in their place in the socioeconomic and educational hierarchy. Some groups have been upwardly mobile during this time period while others have experienced more limited progress.

  • In the 19th century, white Catholics, especially Irish immigrants, were over-represented among the poor. But in the 20th century, especially since the 1960s, white Catholics have experienced unprecedented upward mobility. They now closely resemble Mainline Protestants on socioeconomic measures, with a median net worth of $156,000 compared to Mainline Protestant’s $146,000. Latino Catholics, by contrast, have a net worth of $51,500, substantially below their white Catholic counterparts. White Catholics have also spent more time in school (14 years on average) than their Latino counterparts (12.5 years).
  •  Jews have the highest median net worth of any U.S. religious tradition, at $423,500, Black Protestants have the lowest, at around $22,800. On average, Jews have 16 years of education while Black Protestants have 12.7 years of education.
  • Evangelical Protestants remain near the bottom of the economic ladder with a median net worth of $82,400. They average 13.2 years of education, above Latino Catholics but below the national average.
  • The Non-Affiliated (or religious Nones) are also below the U.S. median net worth and median education level, with a median of only 12.7 years of education. Less than 10 percent of this group holds an advanced degree. Only Black Protestants and Hispanic Catholics have lower levels of educational attainment than “Nones.” 

Religion and Union Formation and Dissolution

Religion is popularly thought of as a social institution that encourages marriage and family growth, and conservative religious traditions are especially supportive of “traditional” family forms and values. But there are some interesting and not always predictable variations among and within different religious groups.

  • Cohabitation is now the most common path toward marriage, and it is on the rise among religious groups as well. But non–affiliated young people are the most likely group to cohabit. Overall Catholics are the least likely to cohabit. Across all religious traditions, teens who attend religious worship services more often and say that religion is more important to them are less likely to cohabit than less observant teens.
  • Overall, couples who have higher levels of religious service attendance, especially if the couple attends together, have lower rates of divorce. But there are big variations among religious groups. White Catholics and Mainline Protestants are less likely than the average American to be divorced, with 12.4 percent and 12.5 percent of their populations being currently divorced, respectively, compared to an overall average of 14.2 of Americans currently divorced.
  • But white Conservative Protestants and Black Protestants are more likely than the average American to be divorced, with 17.2 percent and 15.7 percent of their populations being currently divorced, respectively. Indeed, Evangelical Protestants are more likely to be divorced than Americans who claim no religion.

Thus the common conservative argument that strong religion leads to strong families does not hold up. Some have argued that evangelical Protestantism (the typical example of “strong religion”) is correlated with low socioeconomic status, and that this explains the increased risk of divorce. However, new research by Jennifer Glass and Philip Levchak suggests that evangelical Protestants’ cultural encouragement of early marriage and discouragement of birth control and higher education attainment explain the higher divorce rate in counties with a larger proportion of evangelical Protestants. In fact, living in such counties increases the likelihood of divorce for all couples, regardless of whether they themselves are evangelicals.

Religion and Fertility

The most dependable way for religious groups to maintain or grow their membership is through sexual reproduction. Differences in fertility rates among religious groups are a large part of this story.

  • On average, women from Evangelical Protestant traditions have one more child over their lifetime than their mainline Protestant counterparts. In fact, it is estimated that the fertility practices of evangelical women explain more than 75 percent of the growth these groups have experienced over time.
  • Fertility rates among religious groups vary considerably, generally correlating with their social fortunes over time. Lower SES religious groups (who also more highly value and encourage childbearing) tend to have higher fertility rates. As groups become upwardly mobile, increasing in educational and income attainment, fertility tends to decline. For example, fertility among American White Catholics has dropped slightly below replacement rates (approximately 2.1 children per woman is considered replacement fertility) as they became upwardly mobile. But the rapid growth of new immigrant (post 1964) Latino Catholics has offset this decline. Today, Latino Catholics have fertility rates above replacement, upholding the Catholic share of the American adult population at a steady twenty-five percent. It is possible that these fertility rates will fall as immigrants live longer in the U.S.

Religious Switching

The ability of religions to retain the affiliation of individuals as they age is another key to maintaining or growing their share of the United States population. Nearly three-quarters of American adults have the same religious affiliation as their parents, but this means that more than a quarter of American adults have left the religious tradition in which they were raised.

  • The most common path for young adults leading away from the religion of their childhood is non-affiliation. This is starkly illustrated by the divergent fortunes of the Mainline Protestants and religious Nones, whose trend lines pass each other somewhere around 2004 (see Figure 1). Overall, Catholics and Evangelical Protestants are somewhat better at retention than Mainline Protestants, who see a third of each generation leave the tradition.
  • Latino Catholics are twice as likely as White Catholics to remain Catholic as they age, another way in which this subpopulation has upheld the Catholic share of the American religious market.
  • In the past it was common for young people who grew up with no religious affiliation to join a religious tradition as they transitioned into adulthood. Today, by contrast, most youths raised as religious Nones remain so as they age.
  • No matter what the religious tradition, the greatest predictor of whether a person switches at some point in the life is whether or not their parents match each other religiously. This leads to another dimension of religion and family: the marriage of individuals of different religious faiths, described in the McClendon’s “Interfaith Marriage and Romantic Unions in the United States” briefing report in this Council on Contemporary Families Civil Rights Symposium.

Conclusion

Since the passage of the Civil Rights Act of 1964, religious minorities, particularly Catholic and Jewish Americans, have gained greater acceptance as part of the American religious mainstream. At the same time, America’s religious landscape, like its racial-ethnic one, has diversified over the past half century. The many varieties of Protestants are part of an ever-expanding religious mosaic that includes Jews, Catholics and a growing presence of Buddhists, Hindus, Jains, Mormons, Muslims and Sikhs, along with increasing numbers of individuals whose spiritual beliefs are not anchored in any particular religious affiliation. Americans have certainly become more tolerant of a wide range of beliefs, but in this diverse environment the Civil Rights Act remains an important source of protection for religious (and non-religious) minorities.

For more information, contact Jerry Z. Park, PhD (University of Notre Dame, Sociology), Dept. of Sociology, Baylor University; Jerry_park@baylor.edu; 254 710 3150

Joshua Tom, PhD candidate, Dept. Of Sociology, Baylor University; Joshua_tom@baylor.edu; 254 710 7073

Brita Andercheck, MA, Dept of Sociology, Baylor University; Brita_anderheck@baylor.edu; 254 710 7073

References:

Chaves, Mark. 2011. American Religion: Contemporary Trends. Princeton University Press.

Chokshi, Niraj 2013. “Religion in America’s States and Counties in 6 Maps.” The Washington Post. http://www.washingtonpost.com/blogs/govbeat/wp/2013/12/12/religion-in-americas-states-and-counties-in-6-maps/

European Commision. 2010. “Special Eurobaromter: Biotechnology Report.” http://ec.europa.eu/public_opinion/archives/ebs/ebs_341_en.pdf

Glass, Jennifer and Philip Levchak 2014. “Red States, Blue States, and Divorce: Understanding Regional Variation in Divorce Rates.” American Journal of Sociology. Summary: http://www.contemporaryfamilies.org/impact-of-conservative-protestantism-on-regional-divorce-rates/

Hout, Michael, Andrew Greeley, and Melissa J. Wilde. 2001. “The Demographic Imperative in Religious Change in the United States.” American Journal of Sociology 107(2):468–500.

Keister, Lisa A. 2011. Faith and Money: How Religion Contributes to Wealth and Poverty. Cambridge University Press.

Mahoney, Annette. 2010. “Religion in Families, 1999–2009: A Relational Spirituality Framework.” Journal of Marriage and Family 72(4):805–27.

Steensland, Brian et al. 2000. “The Measure of American Religion: Toward Improving the State of the Art.” Social Forces 79(1):291–318.

Jerry Park is in the sociology department at Baylor University. He studies religion, identity, and civic participation.

Joshua Tom is in the sociology program at Baylor University. He studies religion, race, deviance and the sociology of science.

Brita Andercheck is in the sociology program at Baylor University. She studies religion, family structure, and wealth.

This brief was part of the CCF Equal Pay Act 50th Anniversary Symposium, first published June 2013.

First the good news: Gender parity has already been reached in secondary educational enrollment rates in high-income countries and in Latin America and the Caribbean. From 1975 to 2010, the Arab region saw a remarkable rise in the ratio of female to male secondary enrollment rates, from 59 to 98 percent. In Asia and the Pacific region, there are 99 women in secondary education for every 100 men. Africa, too, has seen gains, with the ratio rising from 54 to 85 percent during this time period. And in 53 countries, ranging from Hong Kong to the Caribbean island of Dominica, women are now the majority of students enrolled in secondary schools.

There is also good news on the health front. Parity in life expectancy (taking into account men’s and women’s biological probabilities of long life) has been reached in all regions of the world. That means that in any region, on average, women’s life expectancy relative to the biological goalpost is on par with men’s, and in most regions, exceeds men’s. One caution is that regional averages obscure some disturbing inequalities in individual countries. Women’s relative life expectancy is less than 95 percent of men’s in 26 countries, including Israel and Bahrain.

But these gains in education and health have not translated into economic parity—or at least, not enough to significantly narrow gender gaps. The widest gaps in labor force participation are in several Middle Eastern countries—Syria, Algeria, Iran, Jordan, Saudi Arabia, for example—where men are five times more likely to be in the labor force than women. Compare this to several African countries where parity has been achieved—Rwanda, Burundi, Mozambique, and Malawi. Even in otherwise egalitarian Scandinavia, gender gaps in labor force participation rates persist — with only 88 Norwegian women in the labor force for every 100 men, followed by 87 per 100 in Finland.

One reason gender gaps in labor force participation persist is women’s greater responsibility for the care of children. (In African countries, where parity has been achieved, many women farm family land, making it easier to combine work with childcare). Without policies that support men’s shared role in childcare or that make it easier to combine paid work and family care, women are not in a position to spend as much time earning income as men.

Even among women and men who are in the labor force, women are more likely to experience unemployment than men. In the Caribbean, for instance, despite the fact that women comprise over 70 percent of students enrolled at the University of West Indies and, on average, have more education than men, they are twice as likely as men to be unable to find a job. The Great Recession that began in 2008 has been especially hard on women in the Euro area. In Greece, one of the worst hit countries in that region, women’s Depression-level unemployment rate is 31 percent, compared to 24 percent for men. And in the US, where the crisis was labeled a “mancession” because men were the first to lose jobs, married mothers have had a harder time finding a job after being laid off than married dads and earn less once they do find work.

Image via Council on Contemporary Families' website.
Image via Council on Contemporary Families’ website.

Nor have women’s educational gains wiped out the gender pay gap, even in countries where women earn more degrees than men. In South Korea, for example, despite the virtual elimination of educational achievement differences between men and women, the median earnings of full-time female employees are still 40 percent lower than men’s. Because of the wage gap in the US, women have to work 52 years to earn the same income men earn in 40 years.

Strong gains in educational equality have also failed to translate into equal voice in political decision-making. In only a handful of countries do women hold a share of parliamentary seats that comes close to representing their proportion of the population. The global average in 2010 was 19 percent, ranging from a low regional average of 8 percent in Arab countries to a high of 26 percent in rich countries. (Sweden stands out amongst rich countries at 45 percent, surpassed only by Rwanda at 56 percent)

It is clear that attaining educational parity – or even superiority – does not ensure economic and political parity for women. And one worrying trend is that in fully 96 of the 135 countries where gender employment gaps have narrowed since 1991, this convergence is partly accounted for by declines in men’s employment rates. In some countries, men’s access to work has declined precipitously (by as much as 23 percentage points in Moldova, for example). Equalizing men’s and women’s employment rates or wages through the erosion of male well-being is hardly a viable basis on which to achieve the benefits of gender equity.

Stephanie Seguino is in the department of economics at the University of Vermont. She is the author of Toward Gender Justice: Confronting Stratification and Power.

Fifty years ago, the United States adopted the Civil Rights Act, prohibiting discrimination on the basis of race, ethnic origin, religion, and gender. Women were a last-minute addition to the bill, and some legislators actually hoped that adding women would mobilize enough opposition to kill the entire act. But the court cases and public demonstrations that the Civil Rights Act enabled women to organize dramatically changed their status in the United States. We can assess the tremendous progress that has been made by comparing current figures to those collected the year before the passage of the act and published in the 1963 report of the President’s Commission on the Status of Women.

Leadership and occupations. In the 87th Congress, elected in 1960, women’s place was not in the House—or the Senate—but in the home. There were only two female senators and 17 female representatives, which meant that women constituted only two percent of the Senate and less than four percent of the House. Today, in the 113th Congress, women hold almost 20 percent of the total positions, including 20 seats in the Senate and 78 in the House of Representatives. This represents a tenfold increase in the Senate and a nearly fivefold increase in the House. And while we have not yet had a female president, attitudes have improved significantly: in 1963, a Gallup poll found that only 55 percent of Americans would vote for a woman for president. By 2011, that number had jumped to 95 percent.

In 1963, less than three percent of all attorneys were women, and out of 422 federal judges in the country, just three (0.7 percent) were women (Coontz 2011: 14). By 2010, women held almost a quarter of all federal judgeships and more than a quarter of state judgeships.

The law itself was grossly unfair to women 50 years ago. Sexual harassment was not forbidden anywhere. In only eight states did a female homemaker have any claim on the income earned by her husband (Mead & Kaplan 1965: 152). It was also perfectly legal for a man to force his wife to have sex against her will. According to the 1962 United States Model Penal Code, “A man who has sexual intercourse with a female not his wife is guilty of rape if . . . he compels her to submit by force or threat of force or threat of imminent death, serious bodily injury, extreme pain, or kidnapping.” Before the Civil Rights Act it was also legal to exclude women from many occupations, pay them less for doing the same work as men, and give men raises and promotions that were denied to equally qualified women. In the 1960s the Harvard Business Review was forced to cancel a report on female managers because “In the case of women the barriers are so great that there is scarcely anything to study” (Collins 2009: 22). Today, women occupy the majority (51.5 percent) of managerial, professional, and related positions. In 1963, not a single woman had served as CEO of a Fortune 500 company. Today, women run 23 of the Fortune 500 (4.6 percent) and almost 20 percent of Financial Post 500 Senior/Corporate officers are women.

In 1960, women constituted less than one percent of all engineers in the country. Only six percent of physicians were women (Collins 2009: 20). By 2007, women held 27 percent of science and engineering jobs, and by 2012, more than a third of physicians and surgeons were women.

Income 

Pew's most recent look at the Pay Gap.
Pew’s most recent look at the Pay Gap.

All this occupational upward mobility has improved women’s financial status relative to men. In 1963, full-time working women earned only 59 cents for every dollar men earned. In 2012, such women earned 77 cents on the dollar, a 30 percent increase. When we count part-time workers and control for hours worked, the progress looks even better. According to a recent Pew report on all working men and women ages 16 and older, women’s hourly wages are now 84 percent of men’s. The gains have been especially dramatic for younger women. Among workers aged 25 to 34, women’s hourly earnings are 93 percent of men’s.

A majority of wives now earn income of their own, something that has been shown to increase equality of decision-making in the family (Coontz 2011: 132). And growing numbers of women make as much or more than their male partners. In 1960, only 3.5 percent of all households with children had a mother who earned more than her husband. By 2011, over four times as many households (15 percent) belonged to this group. And as of 2009, more than 20 percent of all wives—and nearly 40 percent of working wives—earned more than their husbands.

Education

If educational trends continue, we can expect to see more breadwinner wives in the future. In 1962, only 42 percent of female high school graduates went on to college, compared to 58 percent of male graduates, and a larger percentage of female than male college students dropped out before completing their degrees (Mead & Kaplan: 1965). Today, not only do women enroll in college at a higher rate than men, but once enrolled they are less likely to drop out.

A 1970 survey of women under 45 who had been or were currently married found that 80 percent felt “it is much better for everyone involved if the man is the achiever outside the home and the woman takes care of the home and family” (Collins 2009: 17). As late as 1977, two-thirds of all Americans believed that it was the woman’s job to take care of the home. Today, that opinion has reversed: a 2007 study found that 62 percent of Americans believe sharing household chores is “very important” to marital success.

Among the recommendations of the 1963 President’s Commission were access to continuing education, better employment opportunities, and “equal pay for comparable work” (Mead & Kaplan 1965: 212). The gains made in each of these spheres have been tremendous. But there is, as ever, still work to be done.

Women have now outpaced men in educational attainment, and today—unlike 50 years ago—a woman with a college degree earns more than a man without one. Yet at every educational level, women still earn less than men with the same credentials.

Gender gaps in more detail

A 2014 Shriver Report revealed that women remain more likely to live in poverty than men.

Overall, women still earn only 84 cents for every dollar a man earns. (This Pew estimate is based on hourly earnings; the Bureau of Labor Statistics, which uses weekly earnings, reports 81 cents.) Part of this inequity is due to gendered employment differences: women are more likely to work in lower-paying occupations and to leave the workforce when they have children. But even controlling for these and other factors, women still earn only 91 cents for every dollar earned by men. In other words, nine cents are entirely unaccounted for, and likely due to discriminatory pay practices.

According to research prepared for The Shriver Report, released in January 2014, women remain more likely to be poor than men, and much more likely to experience extreme poverty—living on incomes less than 50 percent of the poverty level. And when gender interacts with race, women’s economic disadvantages mount, even though there is a lower gender pay gap among African Americans and Hispanics than among whites. On average, black women earn 90 percent of what black men earn, while Latinas net 88 percent of Latinos’ earnings. But black and Hispanic men earn so much less than white men that the lower gender gap for black woman and Latinas does not produce economic security. African-American women earn just 64 cents for every dollar earned by white, non-Hispanic men. And Hispanic women earn just 55 cents.

Conclusions

Many of the gains that women have made are not as impressive as they seem at first sight. More than a quarter of women’s progress in catching up with men is a result of men’s wage losses over the past three decades rather than women’s wage gains, notes Heidi Shierholz of the Economic Policy Institute. This is especially true for black Americans, as low-income black men in impoverished communities have not only experienced dramatic losses in real wages and job security but tremendous increases in incarceration rates. Between 1970 and 2005 the U.S. prison population rose 700 percent, and much of that increase was accounted for by growing disparities in the sentencing of black men.

Gender segregation in employment also continues to be a problem. After lessening in the 1970s and 1980s, some working-class occupations have become more segregated since 1990. Segregation has also worsened in STEM fields: in 1985, 37 percent of computer and information science degrees were earned by women, but by 2008, that had dropped to 18 percent.

In government, academia, finances, medicine, law, and many other realms, issues of access and unequal treatment still prevail. And pay inequities increase after women become parents, largely because the lack of parental-leave policies and affordable child care forces many women to leave jobs or cut back on work hours, even when they want or need to continue working. The Civil Rights Act has helped women make many impressive gains, but further changes in policy and attitudes are needed to address these remaining inequalities.


For further information, contact Max Coleman: m.elliott.coleman@gmail.com, (925)-787-1191. 


Online References:

Bls.gov, Catalyst.org, Cawp.rutgers.edu, Census.gov, Contemporaryfamilies.org, Familyinequality.wordpress.com, Gallup.com, Musc.edu, Nber.org, Nsf.gov, Pay-equity.org, Pewresearch.org, Pewsocialtrends.org, Pewtrusts.org, Shriverreport.org, Stanford.edu, Time.com, Trustwomenpac.org, Vanneman.umd.edu, Washingtonpost.com.

Print References:
Gail Collins, When Everything Changed: The Amazing Journey of American Women from 1960 to the Present (New York: Back Bay Books, 2009).

Stephanie Coontz, A Strange Stirring: The Feminine Mystique and American Women at the Dawn of the 1960s (New York: Basic Books, 2011).

Margaret Mead and Frances B. Kaplan (Eds.), American Women: The Report of the President’s Commission on the Status of Women and Other Publications of the Commission (New York: Charles Scribner’s Sons, 1963). 

Max Coleman is a former research intern with the Council on Contemporary Families. He studied sociology at Oberlin College and now works on the K-12 education team with John Wiley & Sons Publishing.

People often think of social change in the lives of American children since the 1950s as a movement in one direction – from children being raised in married, male-breadwinner families to a new norm of children being raised by working mothers, many of them unmarried. Instead, we can better understand this transformation as an explosion of diversity, a fanning out from a compact center along many different pathways.

The dramatic rearrangement of children’s living situations since the 1950s

At the end of the 1950s, if you chose 100 children under age 15 to represent all children, 65 would have been living in a family with married parents, with the father employed and the mother out of the labor force. Only 18 would have had married parents who were both employed. As for other types of family arrangements, you would find only one child in every 350 living with a never-married mother!

Today, among 100 representative children, just 22 live in a married male-breadwinner family, compared to 23 living with a single mother (only half of whom have ever been married). Seven out of every 100 live with a parent who cohabits with an unmarried partner (a category too rare for the Census Bureau to consider counting in 1960) and six with either a single father (3) or with grandparents but no parents (3).The single largest group of children – 34 – live with dual-earner married parents, but that largest group is only a third of the total, so that it is really impossible to point to a “typical” family.

With two-thirds of children being raised in male-breadwinner, married-couple families, it is understandable that people from the early 1960s considered such families to be the norm.* Today, by contrast, there is no single family arrangement that encompasses the majority of children.

The figure below illustrates this fanning out from a dominant category to a veritable peacock’s tail of work-family arrangements.

Source: Author calculations from the 1960 US Census and the 2012 American Community Survey, with data from IPUMS.org. Notes: The Census data only identify one parent per child, so married and cohabiting parent couples are identified by the relationship status of the parent (a married mother, for example, may be married to the biological, adopted, or step father of the child). Single fathers include never-married and formerly-married fathers who are not cohabiting or married. Click to expand.

To represent this diversity simply, we can calculate the chance that two children live in the same work-family structure (among the categories shown here). In 1960 you would have had an 80 percent chance that two children, selected at random, would share the same situation. By 2012, that chance had fallen to just a little more than 50-50.

The diversity shown here masks an additional layer of differences, which come from the expanding variety of pathways in and out of these arrangements, or transitions from one to another. For example, among the children living with cohabiting parents in 2012, the resident parent is divorced or separated in about a third of cases. In those cases, the cohabiting-parent family often is a blended family with complex relationships to adults and children outside the household. Many more parents have (or raise) children with more than one partner over their lives than in the past, and many more children cycle through several different family arrangements as they grow up.

The children in America’s classrooms today come from so many distinct family arrangements that we can no longer assume they share the same experiences and have the same needs. Likewise, policy-makers can no longer design family programs and regulations for a narrow range of family types and assume that they will pretty much meet the needs of all children.

The decline of married couples as the dominant household arrangement

The diversification of family life over time is also shown in the changing proportions of all household types, including ones without children. In the next figure I put each household into one of five types, using Census data from 1880 to 2010. The largest category is households composed of married couples living with no one except their own children. If there was any other relative living in a household, I counted it as an extended household. The third category is individuals who live alone. Fourth are single parents (most of them mothers) living with no one besides their own children. In the final category are households made up of people who are not related (including unmarried couples).

As this figure shows, the married-couple family peaked between 1950 and 1960, when this arrangement characterized two-thirds of households. This was also the peak of the nuclear family, because up until the 1940s, extended families were much more common than they became in the 1950s and 1960s. After that era, the pattern fans out.

By 2010, the proportion of married-couple households had dropped to less than half (45 percent) of the total. The proportion of individuals living alone rose from 13 to 27 percent between 1960 and 2010, and single-parent households rose from 6 to 12 percent. The result is that households composed of lone individuals and single parents accounted for almost 40 percent of all households by 2010. Extended households are less common than they were a century ago, mostly as a result of the greater independence of older people, but their numbers have increased again in the last several decades. In sum, the dominant married-couple household of the first half of the twentieth century was replaced not by a new standard, but rather by a general increase in family diversity.

Click to expand.
Click to expand.

How did we get here? Market forces, social welfare reform, and family rearrangements

As the market economy generated new products and services that can supplement or substitute for many of the core functional tasks that families had to perform in the past, people became more able to rearrange their family lives. For example, technological innovations made women’s traditional household tasks, such as shopping, preserving food, house-cleaning, and making clothes, far less time-consuming, while better birth control technology allowed them to control the timing or number of their births. After 1960, employment rates for both married and unmarried women rocketed upward in a 30-year burst that would finally move women’s work primarily from the home to the market.

The shift to market work reinforced women’s independence within their families, but also, in many cases, from their families. Women freed from family dependence could live singly, even with children; they could afford to risk divorce; and they could live with a man without the commitment of marriage.

In the aftermath of the Depression and World War II, social reformers increased their efforts to provide a social safety net for the elderly, the poor, and the disabled. The combination of pension and welfare programs that resulted also offered opportunities for more people to structure their lives independently.

For older Americans, Social Security benefits were critical. They helped reduce the effective poverty rates of older people from almost 60 percent in the 1960s to 15 percent by 2010, freeing millions of Americans from the need to live with their children in old age. At the beginning of the twentieth century, the Census counted only 1 in 10 people age 55 or older living with no relative. By the end of the century, the proportion was more than 1 in 4. Most of that change occurred between 1940 and 1980.

For younger adults, the combination of expanding work opportunities for women and greater welfare support for children made marriage less of a necessity. In the 1960s and 1970s, Aid to Families with Dependent Children grew rapidly, eventually supporting millions of never-married mothers and their children. Welfare did not create single-mothers – whose numbers rose partly in response to poverty, economic insecurity, and rising incarceration rates, and have continued to rise even after large cutbacks in public assistance– and it always carried a shameful stigma while providing a minimal level of monetary support. But it nevertheless allowed poor women to more easily leave abusive or dangerous relationships.

Market forces were most important in increasing the ability of middle-class and more highly educated women to delay, forego, or leave marriage. Poor women, especially African-American women, had long been more likely to work for pay, but their lower earnings did not offer the same personal independence that those with better jobs enjoyed, so welfare support was a bigger factor in the growing ability of poor women to live on their own. Nevertheless, the market has contributed to the growth of single mother families in a different way over the past 40 years, as falling real wages and increasing job insecurity for less-educated men have made them more risky as potential marriage partners.

As a result of these and other social trends such as women’s increasing educational attainment, diversity of family arrangements increased dramatically after the 1950s.

Changes in women’s work-family situations

The work-family situations of both women and children show the same pattern of increasing diversity replacing the dominant-category system that peaked in the 1950s. The next two figures describe women aged 30-34. The rise in education and employment is most dramatic, while marriage and motherhood have become markedly less universal.

Click to expand
Click to expand

Rather than simply see each of these as separate trends, we can create profiles by combining the four characteristics into 16 different categories – employed college graduates who are married mothers on one extreme; non-employed non-graduates who aren’t married or mothers on the other. In the final figure, I show the distribution across the 10 most common of these. These clearly show the decline in a single profile – the married, non-college educated, not-employed, mother – and the diversity in statuses that have replaced that single type.

In 1960, almost 80 percent of women in their early 30s and had not completed college and were married with children. Now such women comprise less than a third of the total – and no category includes more than 18 percent of women. In terms of diversity, in 1960 the chance that two women picked at random would be from from the same category was 40 percent. Today that chance has fallen to 11 percent.

Source: Author calculations from the 1960 US Census and the 2012 American Community Survey, with data from IPUMS.org. Click to expand.


Diversity and inequality

Some of the new diversity in work-family arrangements is a result of new options for individuals, especially women and older people, whose lives are less constrained than they once were. But some of the new diversity also results from economic changes that are less positive, especially the job loss and wage declines for younger, less-educated men since the late 1970s.

In and of itself, however, family diversity doesn’t have to lead to inequality. In the Nordic countries of Finland, Norway and Denmark, for example, unmarried-mother families have poverty rates that barely differ from those of married-couple families – all have poverty rates less than 10 percent. Similarly, many countries do a better job of minimizing the school achievement gap between children of single mothers versus children of married parents – a study of 11 wealthy countries found the gap is largest in the United States.

Different families have different child-rearing challenges and needs, which means we are no longer well-served by policies that assume most children will be raised by married-couple families, especially ones where the mother stays home throughout the children’s early years. As we debate social and economic policy, we need to consider the needs of children in many different family situations, and how they will be affected by policy changes, rather than privileging one particular family structure or arrangement.

***

For further information, contact Professor Cohen at pnc@umd.edu; (301) 405-6414. Most of the charts above were prepared especially for this paper, but much of the data can also be found in Professor Cohen’s new book, The Family: Diversity, Inequality, and Social Change, available now from W.W.Norton: http://books.wwnorton.com/books/978-0-393-93395-6/

*Interestingly, the dominance of the male breadwinner nuclear family was not always as great as it was at mid-century. As historian Stephanie Coontz has shown, up until the 1920s, most households contained more than one wage earner  – mothers working on the family farm or business, and/or children working for pay as well.


Philip N. Cohen is in the Sociology department at the University of Maryland. He is the author of the influential website Family Inequality.

As colleges across the country begin the new school year, we hear a chorus of warnings about a generation of young adults unable or unwilling to “leave the nest.” Phrases are bandied about: “Failure to launch”; “the Peter Pan syndrome”; “boomerang kids” who can’t seem to leave home and establish an independent life. Undergirding these warnings is a fear that the younger generation is growing soft, losing the pioneer independence and rugged individualism that once built this nation.

But a glance at the past suggests it may not be the behavior of youths that has changed so much as the response by adults. Only over the past 90 years did American culture come to define young adults’ continued reliance on parental guidance and their longing to return home as a sign of psychological maladjustment.

From Facebook, a photo of the Parents' Parting Ceremony at Morehouse College in fall 2013.
From Facebook, a photo of the Parents’ Parting Ceremony at Morehouse College in fall 2013.

These days, in an effort to help students develop more individual self-reliance, some colleges have developed “Parting Ceremonies,” designed to establish a decisive separation from their parents. At Morehouse College, the ceremony ends with the incoming freshmen marching through the campus gates, which then swing closed, shutting all parents outside. Other educational institutions have created formal “hit the road” departure rituals designed to hustle parents off campus and encourage students to start organizing their own lives. College counseling centers advise students to limit the time they spend thinking of home or talking with family and to combat unproductive feelings of homesickness by getting involved in new activities and making new friends.

Yet to the consternation of many, it is hard to break young people of their desire to “call home”-or actually return there. A recent study found that college students at Middlebury and University of Michigan were in touch with their parents an average of 13 times each week. One New York Times columnist lamented that this “alarmingly frequent” contact “significantly reduces independence.”  Others have described the cell phone as “the world’s longest umbilical cord,” inhibiting the ability of young people to stand on their own two feet.

According to social media expert Sherry Turkle, Director of MIT’s Initiative on Technology and Self, many young people today grow up “with the idea that they don’t have to separate from their parents,” a process that 20th century psychologists saw as an essential part of maturation. “Something has become the norm that was [once] considered pathological.”

In this postcard from 1906, Nellie Salyer says she's homesick---twice! Photo via Flickr CC, Wystan.
In this postcard from 1906, Nellie Salyer says she’s homesick—twice! Photo via Flickr CC, Wystan.

A look back at the history of homesickness, however, suggests that earlier generations had just as difficult a time leaving home as do modern Americans. But in the nineteenth century, homesickness was not seen as a symptom of poor adjustment or psychological imbalance. It was considered a serious medical condition that might strike any person who was separated from home and family. According to physicians of the era, symptoms of acute homesickness, then called nostalgia, included loss of appetite, “mental dejection,”  ”irregular action of the bowels,” hysterical weeping, “throbbing of the temporal arteries,” “incontinence,” “cerebral derangement,” and sometimes even death. Since love of home and mother were considered signs of a virtuous character, no shame was attached to being diagnosed with this potentially fatal condition.  The only known cure was to send the sufferer home.

Of course, this was not always possible. For example, soldiers who went off to war could not be sent home when they came down with a bout of nostalgia. So military officials often prohibited army bands from playing “Home, Sweet Home,” for fear it might touch off an epidemic of homesickness in the ranks. Despite such precautions, during the Civil War doctors diagnosed 5000 Union soldiers with serious clinical cases of nostalgia, and determined that 74 men had died from it.

Perhaps it is true that many young Americans today are too dependent on their parents. But a look back at the history of homesickness suggests that, long before e-mail and the cell phone, earlier generations also had a hard time leaving home and parents behind. Then, however, instead of blaming parents for not sufficiently preparing their children for independence, traditional American culture encouraged such interdependence between the generations.

This briefing paper was originally published September 11, 2011 by the Council on Contemporary Families.

Susan Matt is in the history department at Weber State University. She studies the social and cultural history of the U.S., including consumerism and emotions.

This briefing paper is based on the authors’ monograph (with Xue Wang), “Physical Attractiveness and the Accumulation of Social and Human Capital in Adolescence and Young Adulthood,” part of the peer-reviewed series, Monographs of the Society for Research in Child Development (Wiley-Blackwell).

Expert responses to this report are available online here.

How do your looks affect your life?

Is being attractive or unattractive a source of systematic social inequalities in people’s access to wealth, power and privilege? Should we add “beauty bias” to racism and sexism as a type of unacceptable discrimination? 

Other forms of inequality. We all know that people’s race and gender affect their chances of getting ahead in society. One recent experiment found that when equivalent resumes were mailed out, some with White-sounding and some with Black-sounding names, the callback rate was 50 percent higher for the white-sounding names.

Similarly, when faculty from top research universities evaluated the fictional portfolios of applicants for a laboratory management position, they rated applicants with female names as less competent and less desirable hires than otherwise identical applicants with male-sounding names. When they did recommend hiring one of the female applicants, they suggested a starting salary 12 percent lower than for the males.

Family economic status also affects people’s life prospects. One widely publicized study estimated that by preschool age poor children had heard 30 million fewer words and spoken 600 fewer than wealthier children, a disadvantage that has long-range consequences for their academic achievement.

Lookism’s inequality. But it is equally true that people’s personal appearance has powerful effects on their life chances. Economists find that women gain an eight percent wage bonus for above-average looks and pay a four percent wage penalty for below-average looks. For men, the bonus is four percent and the penalty 13 percent. Social psychologists find that people rate better-looking people higher in intelligence, personality, and potential for success.

In one experiment, young men were shown a photo of either an attractive or an unattractive woman before engaging in a phone conversation with her. The men who were shown the better-looking partner expected her to be more sociable and humorous than did men shown the less attractive partner. And in a self-fulfilling prophecy, they actually elicited such behavior from the people they assumed to be attractive. Independent judges listening to a phone call between two people rated both the woman and the man as warmer and more sociable when the caller had been portrayed as attractive rather than unattractive.

Photo by Benjamin Chun via Flickr Creative Commons.

High school matters. Our research shows that the critical period in which inequality on the basis of looks establishes itself is in high school. We find that looks operate in ways familiar through many of our personal experiences—the better looking being most popular in the social hierarchy of high school. Being considered good-looking is also associated with better mental health and feelings of belonging among teens.

While we may think that the superficiality of high school social hierarchies wears off as people age, we find that youth rated as better looking get higher grades and are more likely to attain a college degree than their peers, setting the stage for better economic outcomes through adulthood. In fact, the difference in GPA and college graduation rates between youth rated by others as attractive versus average in looks is similar to the differences in academic achievement between youth raised in two-parent versus single-parent families!

Bad looks vs. good looks. Importantly, different gradations of looks seem to matter in different ways. The advantage of good looks is not the same as the disadvantage of bad looks, and being the most beautiful is not as important as being above average during high school:

“Standing out from the crowd”—being rated as attractive rather than average in looks—is most important for adolescents. The attractive exceed the average in nearly every social and academic domain during high school. These advantages continue into young adulthood.

“Fairest of the fair”—being rated as very attractive rather than attractive in looks has fewer effects during high school. By young adulthood, however, the best looking rate themselves as more extroverted, report having more friends, and are more likely to attain a college degree.

Hard times for the good-looking. There are some disadvantages and risks associated with being attractive. Youth rated as more physically attractive are more likely to date, have sexual partners, and drink heavily. These factors, in turn, have negative consequences for immediate grades and later college completion. And in some circumstances, it’s possible that being very attractive can be a disadvantage, especially for women. A handful of studies of adults have identified a penalty of attractiveness for women in certain male-dominated occupations. And one study found that wearing a sexy dress reduced perceptions of women’s competence for managerial positions—though not for secretarial positions.

These trade-offs create an interesting paradox. Being better looking does not always give young people an advantage in the classroom and the workforce. And being seen as unattractive has some compensation.

Key West High's Homecoming Queen is coronated ca. 1960. Photo by Don Pinder via Flickr.
Key West High’s Homecoming Queen is coronated ca. 1960. Photo by Don Pinder via Flickr.

In high school, for those rated above average in looks, the negative consequences of being part of the dating and partying scene erode some of the positive gains, such as feeling better about oneself and feeling closer to teachers. Nevertheless, for most youths, the benefits outweigh the negatives; those rated as above-average looking had an overall advantage over their “average-looking” peers in grades.

By contrast, those who were rated below average in looks did not suffer an overall disadvantage in terms of grades compared to their “average” looking peers. The ill effect of having poorer mental health and fewer friends because of below average looks was completely neutralized by the other consequences of their below-average looks; they were less likely to be sexually active or involved in the heavy drinking party scene. One overweight young woman told us that she believed that she had an academic advantage over more conventionally attractive peers who have to deal with “guys, drinking, parties, and most of all freedom.”

Pervasive effects of looks. On the whole, looks’ effects are pervasive. Like race and gender, appearance is a highly visible aspect of ourselves that leads others to make assumptions about us—often unconsciously—and to treat us in particular ways, especially in initial interactions. Such treatment can create self-fulfilling prophecies.

Social scientists have not yet developed programs to address lookism. Taking a page from interventions aimed at reducing other prejudices, however, we anticipate that a wide array of strategies might help youth—and the adults and teachers that they interact with—circumvent assumptions based on looks. The large size and many different classes in high schools mean that teachers and students get to know one another less well than in elementary schools, yet a person’s looks are especially salient when we have little else to go on in forming an impression.  High school cliques also restrict interactions across groups, but one of the most successful strategies for reducing prejudice is cross-group contact. Educators therefore might try bringing students and teachers together for meaningful interactions that cut across social cliques, and assess the extent to which such strategies help level the playing field for youth who are more and less attractive.

Rachel A. Gordon is in the department of sociology and the Institute of Government and Public Affairs at the University of Illinois at Chicago. She studies early education and adolescent development.

Robert Crosnoe is in the department of sociology and the Population Research Center at the University of Texas at Austin. He is the author of Fitting In, Standing Out: Navigating the Social Challenges of High School to Get an Education.

This paper is part of the Council on Contemporary Families Gender Revolution Rebound Symposium

This look at sexual frequency among younger couples in equal marriages refutes recent claims that when a man shares the housework equally, it is bad for the couple’s sex life.

For several decades, research has suggested that attitudes and laws favoring gender equity have changed more quickly than people’s actual behavior in intimate relationships. One recent highly publicized article reported that married couples who split domestic chores in an egalitarian manner had sex less often, and reported less satisfaction with their sex lives, than couples who adhered to more to conventional gender behaviors. The depressing message heard round the world was that couples remain stalled in their attachment to old “gender scripts,” and that attempts to revise these scripts decrease sexual desire and satisfaction, even among couples who claim to hold egalitarian values.

But the underlying study, based on data gathered over a quarter of a century ago, was focused on the sexual behaviors of married couples in the late 1980s, many of whom had met and married in the 1960s and 1970s. My colleagues Dan Carlson, Amanda Miller, Sarah Hanson and I wondered if the apparent erotic resistance to gender equality still applied to more recent marriages and partnerships, so we turned to newer data (from 2006), examining a sample of low- to moderate-income young married and cohabiting couples with minor children.

When couples divvy up household tasks, they both have to remember to put sex on the list! Photo via TSP.

Like Cotter and his colleagues, we found evidence that things have changed significantly in more recent years. Couples who shared domestic labor had sex at least as often, and were at least as satisfied with the frequency and quality of their sex, as couples where the woman did the bulk of the housework. In fact, these egalitarian partners were ranked slightly higher in all these categories, reporting more frequent sex and greater satisfaction with the frequency and quality of that sex than conventional couples, although these differences did not reach the level of statistical significance. This suggests that it is good news for couples, not bad, that men have more than doubled the amount of housework they do since the 1960s.

The one group that did score significantly lower than both egalitarian and conventional couples?   Couples where men did the bulk of the domestic labor. Apparently, completely reversing gender roles in housework was not a sexual turn-on to either the men or women involved. But such couples accounted for only a small share (less than 5 percent) of those in our sample.

Although it is very clear that progress toward gender equality in Americans’ attitudes and behaviors has not come to a standstill, it is true that some areas remain stubbornly resistant to change. For example, only about three out of ten couples in our sample reported that housework was equally shared (and men were more likely to report they share things more equitably than were their female partners). The majority of our sample couples (63 percent) practiced rather conventional divisions of domestic labor, where the woman did approximately two-thirds of the housework. Perhaps if more men realized that sexual frequency was higher when the domestic load was more equitably shared they would grab that Swiffer more often.

Another area that seems especially resistant to change, despite being perceived by many men as an onerous responsibility, is the tradition that men are responsible for initiating relationships. In heterosexual marriage, for example, it is still usually the man who is expected to propose. In my research with Amanda Miller on cohabiting couples in the U.S., we find that even though such couples are egalitarian in many ways, with the women often having more schooling than their partners or contributing the same amount of income, the vast majority of both men and women view proposing as the right and responsibility of the man. It will be interesting to see if this pattern also changes in coming decades or if it will remain one of the last bastions of traditional gender arrangements.

July 30, 2014

Sharon Sassler is in the department of policy analysis and management at Cornell University. Her research includes examining cohabiting unions, the pace of relationship progression among young adults, and how relationships are shaped by gender, nativity, and whether relationships are interracial.