National surveys and other studies continuously tell us that work is a major source of stress for Americans. A 2005 Work and Families Institute study found that almost 90 percent of workers felt they either never had enough time in the day to do their job or that their job required them to work very hard. A Pew Report from 2013 found that more than half of all working moms and working dads experience work-family conflict. One-third of working moms and dads feel rushed on work-days, and almost 50 percent of working dads (and 25 percent of working moms) say they don’t have enough time with their children. And in a recently completed research project I helped conduct, we found that people report feeling less stressed out on non-work days than on work-days. Home, most of us believe, is where we recover from the stress of the work day.
Regardless of the job, full-time, continuous work seems to lower stress levels. Photo by gadgetgirl via flickr CC.
But actually, when my fellow Penn State researchers, Joshua Smyth, Matthew Zawadzki, and I measured people’s cortisol levels, a major biological marker of stress, we found that people have significantly lower levels of stress at work than at home. These low levels of cortisol may help explain a long-standing finding that has always been hard to reconcile with the idea that work is a major source of stress: People who work have better mental and physical health than their non-working peers, according to research published in the Journal of Health and Social Behavior, Social Science Research, the American Sociological Review, and the Handbook of the Sociology of Mental Health. Mothers who work full time and steadily across their twenties and thirties report better mental and physical health at age 45 than mothers who work part-time, who stay at home, or who experience repeated bouts of unemployment.
Further contradicting conventional wisdom, we found that women as well as men have lower levels of stress at work than at home. In fact, women may get more renewal from work than men, because unlike men, they report themselves happier at work than at home. It is men, not women, who report being happier at home than at work.People who work have better mental and physical health than their non-working peers. Women may even get more renewal from work: they report themselves happier at work than at home.
We were surprised to find that even parents—both mothers and fathers—had lower stress at work than at home. However, parents did not experience as big a decrease in their stress levels as non-parents.
Our findings suggest that telling people to quit or cut back on work in order to resolve their work-family conflicts may not be the best long-run advice. Rather, companies should consider adopting family friendly policies that allow workers to continue getting the health benefits of employment while still being able to meet their family responsibilities. One model is the “results only work environments,” a policy adopted by Gap, Inc., which allows workers more flexibility in the time and place of their schedules, as long as they are getting their work done. Telecommuting, paid sick days, paternity and maternity leaves, are all policies that make it easier for workers to retain the health benefits of employment and for companies to retain the financial benefits of having loyal employees rather than having to deal with constant job turnover.
To view this report on the Council on Contemporary Families website, click here.
Sarah Damaske is in the labor and employment relations, sociology, and women’s studies departments and in the Population Research Institute at The Pennsylvania State University. She is the author of For the Family?
Jerry Park, Joshua Tom, and Brita Andercheck on July 9, 2014
Click for image source.
The following is a re-post in honor of the (2014) 50th Anniversary of the Civil Rights Act.
Greater Acceptance, Persisting Antipathy:
Catholic and Jewish Americans Since The Civil Rights Era
The Civil Rights Act of 1964 not only ushered in stronger federal protections for racial and ethnic minorities and women, but also for religious minorities. Antipathy toward Catholics and Jews in the US was a persistent and prevalent theme through much of American history. It was common for these groups to be labeled “un-American” and even categorized as “non-white.” Members of these religions were often discriminated against in hiring and in admission to institutions of higher learning (this was especially common for Jewish applicants) and excluded from many neighborhoods, clubs, and political positions. From the late 19th through the mid-20th century, organized hate groups, most notably the Ku Klux Klan, used the threat of violence to intimidate not only African-Americans but Jews and Catholics as well.
After World War II, these restrictions and prejudices eased somewhat. By 1955 the now-classic essay Protestant Catholic Jew could proclaim that although these three religions were the primary sources of identity in America, they were now “alternative ways of being an American” rather than two of them being seen as Un-American.
Still, anti-Semitism and anti-Catholicism persisted. In the 1960s, some commentators worried that President Kennedy, a Catholic, would take orders from the Pope. In the 1970s, President Richard Nixon was recorded making several anti-Semitic comments. And even today nativist hate groups continue to perpetuate centuries-old hostilities against Catholic and Jewish Americans. But the Civil Rights Act did give these minorities protection against outright exclusion and discrimination, and other religious minorities have also looked to it for security as the American religious landscape has diversified.Even today, nativist hate groups perpetuate hostilities against Catholic and Jewish Americans.
American Religious Belonging Today
Religion scholars consider the United States to be an anomaly on the modern religious scene. Compared to other nations at similar levels of modernization, the United States stands out as highly religious. For example, in Western Europe about three-quarters of the population profess a belief in a God or higher power (with this proportion significantly lower in some individual nations). In America, by contrast, 90 percent of adults profess such a belief. These American numbers have remained fairly stable, with only small long-term declines, over the past fifty years.
However, one major measure of religiosity has changed significantly over that time period: religious belonging, or identifying with a particular religion rather than simply holding religious beliefs.
Currently 80 percent of the U.S. adult population identifies as belonging to one of the 3,500 groups that make up the American religious landscape. Religion scholars categorize these groups in different ways, but one of the most popular classifications divides them into six major American religious traditions: Evangelical Protestants, Mainline Protestants, Black Protestants, Catholics, Jews, and Other Religions. Twenty percent of Americans fall into a seventh category, which sociologists call the ‘religious Nones’ – those who identify with no religious tradition even if they do believe in God or a higher being.
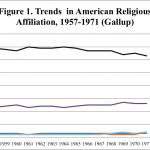
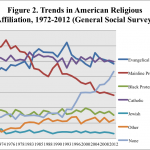
The distribution of Americans among these various groups has fluctuated and changed over the past 50 years. Figure 1 shows these trends in affiliation from 1957-1971 using Gallup polling data and from 1972-2012 using data from the General Social Survey (GSS).
Gallup data
GSS Data
We draw attention to six specific trends:
The Protestant share of the American population has shrunk from more than 70 percent of the population in the late 1950s to less than 50 percent today. This is primarily due to the precipitous decline of Mainline Protestants (e.g. Methodists, Lutheran and Episcopalians), from more than 30 percent of the U.S. population in the 1970’s to around 15 percent today.
Evangelical Protestants (e.g. Baptists, Pentecostals) have increased their representation in the population from less than a quarter of the population in the 1960s to 31 percent in the early 1990s. However, this was the period of their peak membership. Contrary to popular impression, their share of the religious market has since declined to 24 percent.
Catholics have sustained their share of the religious market, remaining at approximately 25 percent throughout the latter half of the 20th century. But this is primarily due to the influx of Latino immigrants to the United States. The share of native born (primarily white) Catholics has declined.
Despite the large percentage of Americans who profess a belief in a higher power, there has been a recent meteoric rise of the religiousNones, from about 3 percent of the population in the mid-20th century, to 10 percent in 2000, to 20 percent today. One in every 5 Americans does not identify with a particular religious tradition.
The proportion of Americans who identify with “Other” religious traditions has doubled, an increase that is closely tied to the increased immigration of Asian populations who brought non-western religions (e.g. Buddhism, Hinduism, Islam) with them. While still a small proportion of the overall population, they contribute greatly to the increased religious diversity of the American religious landscape. In 20 states,scattered in the Midwest and South, Islam is the largest non-Christian religion. Judaism is the largest non-Christian religion in 15 states, mostly in the Northeast, and Buddhism is the largest religion in 13 western states. In Delaware and Arizona, Hinduism is the largest non-Christian religion, while in South Carolina it is the Baha’i. For more details visit here.
According to the Pew Research Centers, “the percentage of US adults who say they are Jewish when asked about their religion has declined by about half since the late 1950s.” It is currently is a little less than twopercent.
Religion and Socio-Economic Status
Religious groups differ not only in their beliefs but in their place in the socioeconomic and educational hierarchy. Some groups have been upwardly mobile during this time period while others have experienced more limited progress.Religious groups differ not only in their beliefs but in their place in the socioeconomic and educational hierarchy.
In the 19th century, white Catholics, especially Irish immigrants, were over-represented among the poor. But in the 20th century, especially since the 1960s, white Catholics have experienced unprecedentedupwardmobility. They now closely resemble Mainline Protestants on socioeconomic measures, with a median net worth of $156,000 compared to Mainline Protestant’s $146,000. Latino Catholics, by contrast, have a net worth of $51,500, substantially below their white Catholic counterparts. White Catholics have also spent more time in school (14 years on average) than their Latino counterparts (12.5 years).
Jews have the highest median networth of any U.S. religious tradition, at $423,500, Black Protestants have the lowest, at around $22,800. On average, Jews have 16 years of education while Black Protestants have 12.7 years of education.
Evangelical Protestants remain nearthebottom of the economic ladder with a median net worth of $82,400. They average 13.2 years of education, above Latino Catholics but below the national average.
The Non-Affiliated (or religious Nones) are also below the U.S. median net worth and median education level, with a median of only 12.7 years of education. Less than 10 percent of this group holds an advanced degree. Only Black Protestants and Hispanic Catholics have lower levels of educational attainment than “Nones.”
Religion and Union Formation and Dissolution
Religion is popularly thought of as a social institution that encourages marriage and family growth, and conservative religious traditions are especially supportive of “traditional” family forms and values. But there are some interesting and not always predictable variations among and within different religious groups.
Cohabitation is now the most common path toward marriage, and it is on the rise among religious groups as well. But non–affiliated young people are the most likely group to cohabit. Overall Catholics are the least likely to cohabit. Across all religious traditions, teens who attend religious worship services more often and say that religion is more important to them are less likely to cohabit than less observant teens.
Overall, couples who have higher levels of religious service attendance, especially if the couple attends together, have lower rates of divorce. But there are big variations among religious groups. White Catholics and Mainline Protestants are less likely than the average American to be divorced, with 12.4 percent and 12.5 percent of their populations being currently divorced, respectively, compared to an overall average of 14.2 of Americans currently divorced.
But white Conservative Protestants and Black Protestants are more likely than the average American to be divorced, with 17.2 percent and 15.7 percent of their populations being currently divorced, respectively. Indeed, Evangelical Protestants are more likely to be divorced than Americans who claim no religion.
Thus the common conservative argument that strong religion leads to strong families does not hold up. Some have argued that evangelical Protestantism (the typical example of “strong religion”) is correlated with low socioeconomic status, and that this explains the increased risk of divorce. However, new research by Jennifer Glass and Philip Levchak suggests that evangelical Protestants’ cultural encouragement of early marriage and discouragement of birth control and higher education attainment explain the higher divorce rate in counties with a larger proportion of evangelical Protestants. In fact, living in such counties increases the likelihood of divorce for all couples, regardless of whether they themselves are evangelicals.
Religion and Fertility
The most dependable way for religious groups to maintain or grow their membership is through sexual reproduction. Differences in fertility rates among religious groups are a large part of this story.
On average, women from Evangelical Protestant traditions have one more child over their lifetime than their mainline Protestant counterparts. In fact, it is estimated that the fertility practices of evangelical women explain more than 75 percent of the growth these groups have experienced over time.
Fertility rates among religious groups vary considerably, generally correlating with their social fortunes over time. Lower SES religious groups (who also more highly value and encourage childbearing) tend to have higher fertility rates. As groups become upwardly mobile, increasing in educational and income attainment, fertility tends to decline. For example, fertility among American White Catholics has dropped slightly below replacement rates (approximately 2.1 children per woman is considered replacement fertility) as they became upwardly mobile. But the rapid growth of new immigrant (post 1964) Latino Catholics has offset this decline. Today, Latino Catholics have fertility rates above replacement, upholding the Catholic share of the American adult population at a steady twenty-five percent. It is possible that these fertility rates will fall as immigrants live longer in the U.S.
Religious Switching
Door to Door Jesus by Sean Bonner via Flickr CC
The ability of religions to retain the affiliation of individuals as they age is another key to maintaining or growing their share of the United States population. Nearly three-quarters of American adults have the same religious affiliation as their parents, but this means that more than a quarter of American adults have left the religious tradition in which they were raised.
The most common path for young adults leading away from the religion of their childhood is non-affiliation. This is starkly illustrated by the divergent fortunes of the Mainline Protestants and religious Nones, whose trend lines pass each other somewhere around 2004 (see Figure 1). Overall, Catholics and Evangelical Protestants are somewhat better at retention than Mainline Protestants, who see a third of each generation leave the tradition.
Latino Catholics are twice as likely as White Catholics to remain Catholic as they age, another way in which this subpopulation has upheld the Catholic share of the American religious market.
In the past it was common for young people who grew up with no religious affiliation to join a religious tradition as they transitioned into adulthood. Today, by contrast, most youths raised as religious Nones remain so as they age.
No matter what the religious tradition, the greatest predictor of whether a person switches at some point in the life is whether or not their parents match each other religiously. This leads to another dimension of religion and family: the marriage of individuals of different religious faiths, described in the McClendon’s “Interfaith Marriage and Romantic Unions in the United States” briefing report in this Council on Contemporary Families Civil Rights Symposium.
Conclusion
Since the passage of the Civil Rights Act of 1964, religious minorities, particularly Catholic and Jewish Americans, have gained greater acceptance as part of the American religious mainstream. At the same time, America’s religious landscape, like its racial-ethnic one, has diversified over the past half century. The many varieties of Protestants are part of an ever-expanding religious mosaic that includes Jews, Catholics and a growing presence of Buddhists, Hindus, Jains, Mormons, Muslims and Sikhs, along with increasing numbers of individuals whose spiritual beliefs are not anchored in any particular religious affiliation. Americans have certainly become more tolerant of a wide range of beliefs, but in this diverse environment the Civil Rights Act remains an important source of protection for religious (and non-religious) minorities.
References:
Chaves, Mark. 2011. American Religion: Contemporary Trends. Princeton University Press.
Hout, Michael, Andrew Greeley, and Melissa J. Wilde. 2001. “The Demographic Imperative in Religious Change in the United States.” American Journal of Sociology 107(2):468–500.
Keister, Lisa A. 2011. Faith and Money: How Religion Contributes to Wealth and Poverty. Cambridge University Press.
Mahoney, Annette. 2010. “Religion in Families, 1999–2009: A Relational Spirituality Framework.” Journal of Marriage and Family 72(4):805–27.
Steensland, Brian et al. 2000. “The Measure of American Religion: Toward Improving the State of the Art.” Social Forces 79(1):291–318.
July 2, 2014 marked the 50th anniversary of the enactment of the Civil Rights Act of 1964. In February 2014, CCF convened an online Civil Rights Symposium. To read or download the entire symposium, visit here.
Jerry Park is in the sociology department at Baylor University. He studies religion, identity, and civic participation.
Joshua Tom is in the sociology program at Baylor University. He studies religion, race, deviance and the sociology of science.
Brita Andercheck is in the sociology program at Baylor University. She studies religion, family structure, and wealth.
The following is a re-post in honor of the 50th Anniversary of the Civil Rights Act. Click any chart or figure to expand.
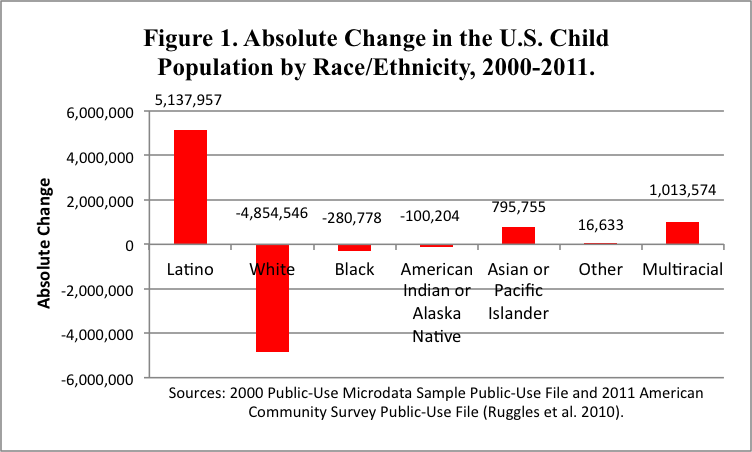
Latinos are increasingly driving the demographic fortunes of the United States. Between 2000 and 2011, the number of white children in the country declined by 4.9 million, a decrease of 11%. Blacks and American Indians and Alaska Natives also saw their child populations decline. The nation’s total child population, however, increased by 1.7 million in the same period, largely due to the growth in the Latino child population. The number of Latino children rose by 5.1 million during this period (Figure 1), an increase of 42%. The number of multiracial and Asian and Pacific Islander children also expanded, but much less than the increase of Latino youth.
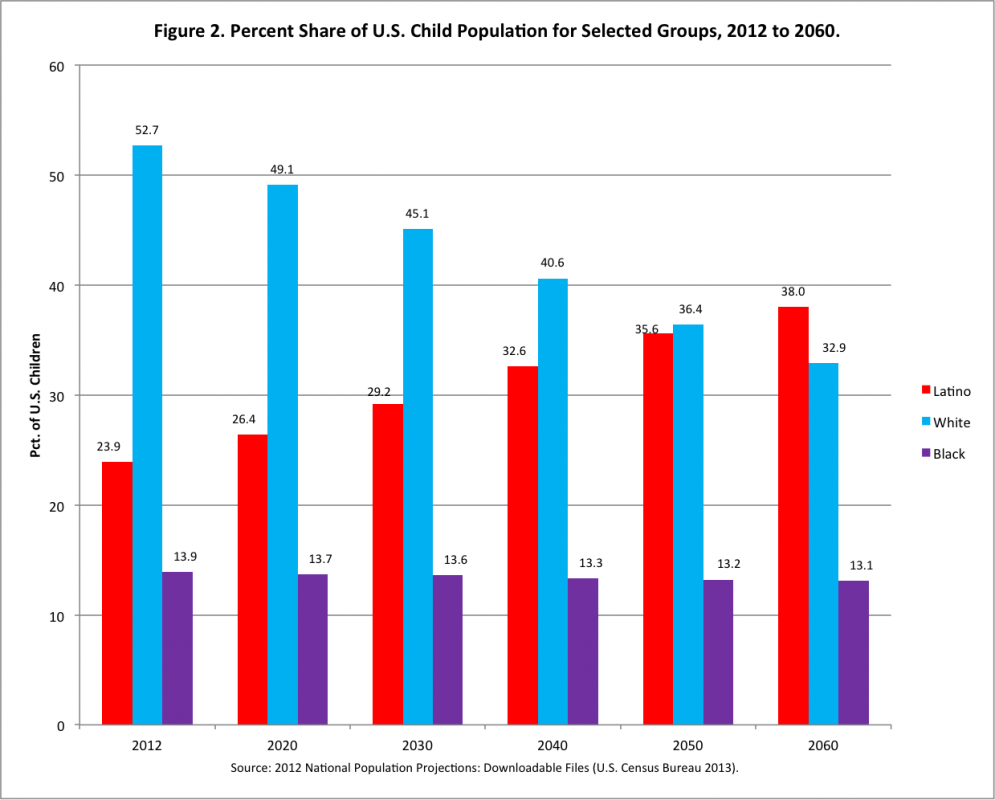
By 2060 it is projected that the proportion of white children will fall from 53% in 2012 to barely a third—just 33% (Figure 2). Latinos will have replaced whites as the nation’s largest child population, comprising almost 40% of the total. The black share of children is expected to decrease slightly from 14% to 13% during the period. The remaining 16% of children in 2060 will be largely Asian and multiracial youth.
Figure 1
Figure 2
Figure 3
Who are these Latino children? From Different Strands, But Deeply Rooted in the United States
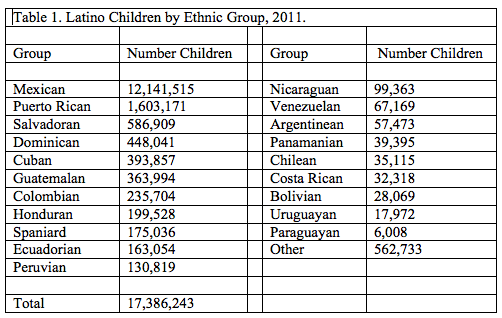
Approximately 70% of Latino children, 12.1 million, are of Mexican origin (Table 1). Next in order are Puerto Ricans (1.6 million), Salvadorans (587,000), Dominicans (448,000), Cubans (394,000), Guatemalans (363,000), and Colombians (236,000).
Despite the multitude of their countries of origin, more than 90% of Latino children were born in the United States or born abroad to U.S. citizens. Although the overwhelming majority are U.S. citizens, many Latino children have strong connections to the immigrant experience. Almost 54% of U.S.-born Latino children have at least one parent who was born outside of the United States. In addition, many Latino children live in mixed-status families and households, where some members are U.S.-born, others are naturalized U.S. citizens, and still others are undocumented immigrants. In this living arrangement some family members have access to resources—such as food stamps, healthcare, and so forth—while others do not.
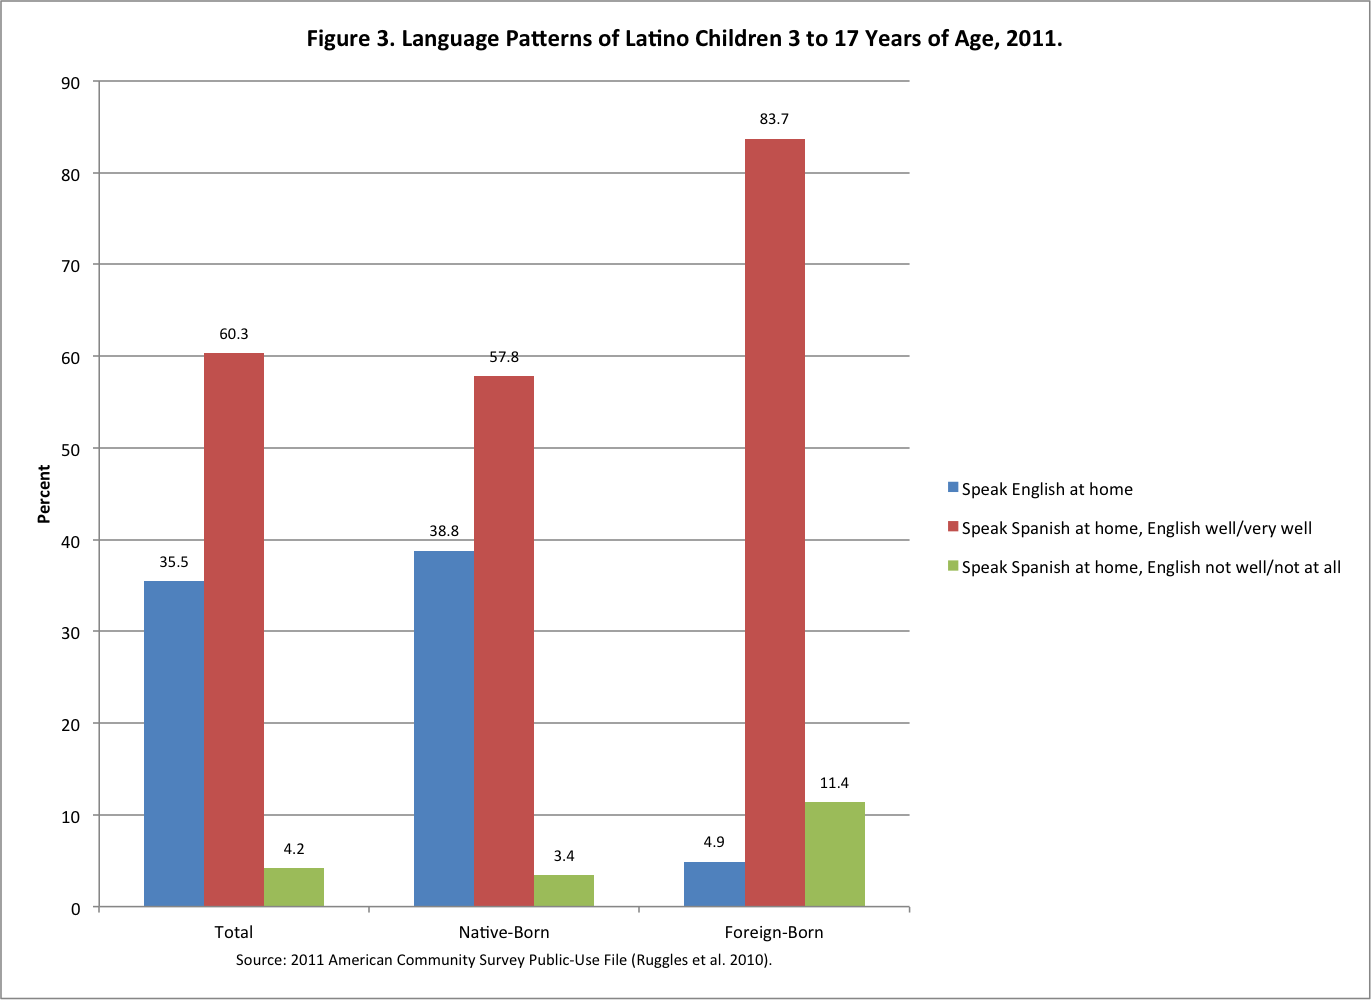
The language patterns of Latino children reflect their deep roots in the United States but also the strong ties of many to their ancestral roots. Latino youth three to 17 years of age tend to be bilingual, with three-fifths speaking Spanish at home and being fluent in English, and slightly more than one-third speaking English at home (Figure 3). Only a small fraction (four% of all Latino children and less than 12% even of foreign-born ones) cannot converse adequately in English.
Family and Household Arrangements of Latino Children
Figure 4
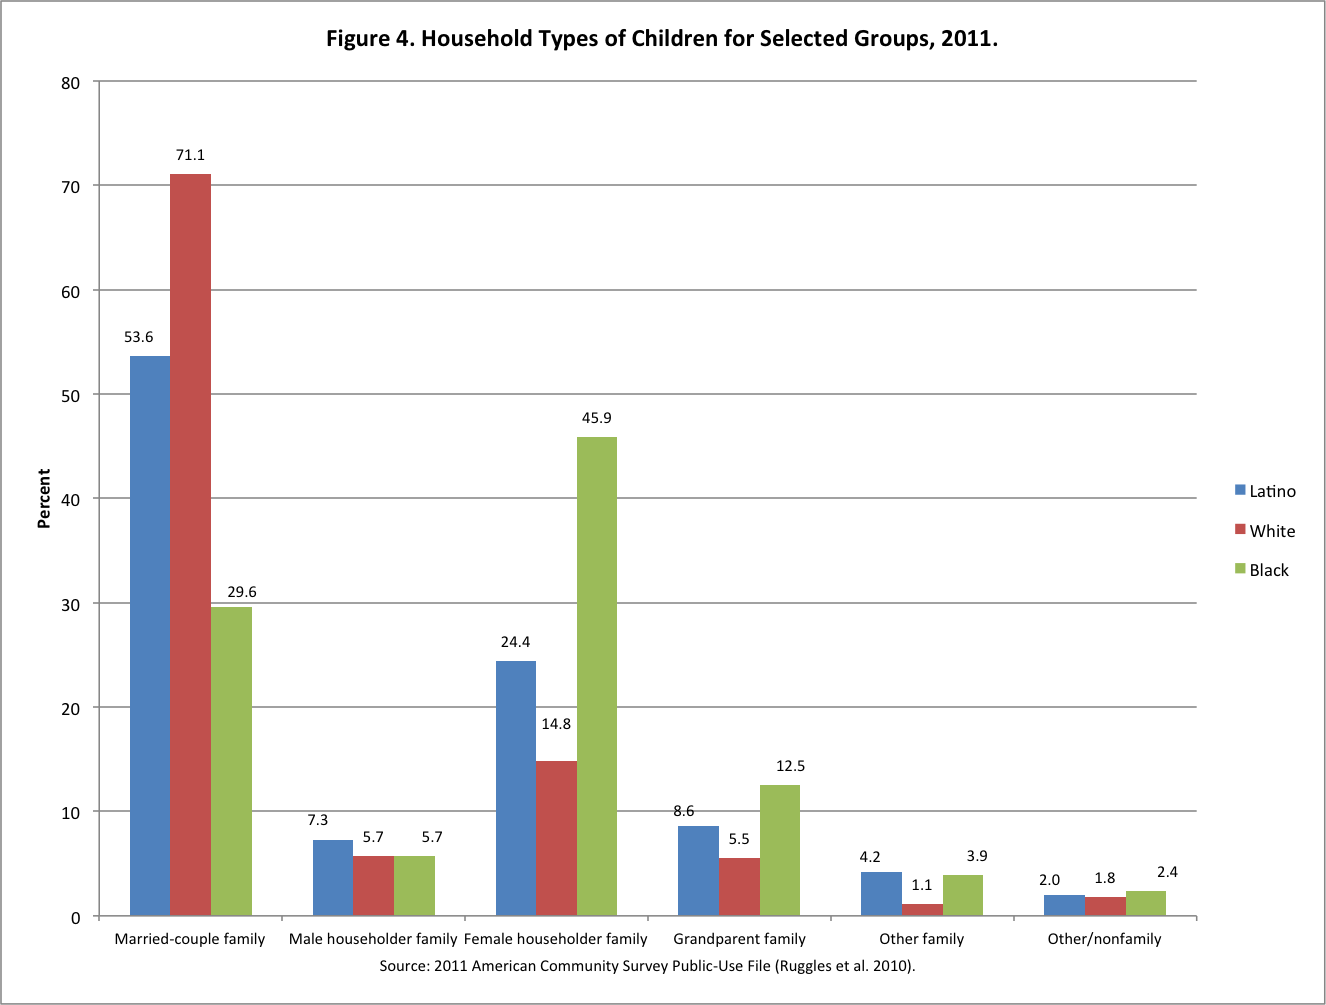
The majority of Latino children (54%) live in married-couple family households (Figure 4). Nearly a quarter live in family households headed by a single female and about one-sixth live either with a grandparent or with a single father.
One of the household strategies that families utilize to deal with limited financial resources is doubling up in the homes of relatives and friends. One-tenth of Latino children live as part of subfamilies in the home of another family.
Educational Challenges
Latinos have consistently lagged behind other racial and ethnic groups in educational achievement, in part because of their low pre-school enrollment, which means they often enter kindergarten behind other students. Only about one-fourth of Latino three-year-olds and a little more than half of four-year-olds are enrolled in school (Figure 5). Their white and black counterparts are much more likely to be enrolled in school at these ages, with nearly two-fifths and close to two-thirds of three- and four-year-olds, respectively, attending school.
Figure 5
Although high school completion rates have been improving for Latinos in the past decade, nearly 15% of Latinos 16 to 24 years of age do not have a high school diploma or GED and are not currently enrolled in school. Not all of these are high school dropouts, because some of these individuals may have come to the United States to work and never did “drop in” to school. But both U.S.-born Latinos and blacks 16 to 24 are twice as likely as their white counterparts to be dropouts, and Latinos overall are still three times more likely than whites to lack a high school diploma.
Work and Latino Youth
Historically, youth from minority and poor families were much more likely than whites, especially middle-class whites, to hold jobs. Over the past half century, that pattern has been reversed. Among Latino and black youngsters 16 and 17 years of age, only one-sixth are in the labor force, compared to more than a quarter of white youth. And among white youth, those from more economically secure families are more likely to be employed or actively seeking employment than those from poor families. It appears that today the high labor force participation rate of white youth may be part of constructing an extracurricular profile, the lack of which may add to the disadvantages of poorer youth.
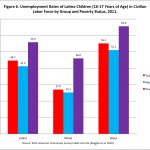
However, once in the labor force, youth of color have much higher rates of unemployment than whites. Here Latinos are in the middle, with 45% unemployment rates compared to 55% for blacks and 27% for whites (Figure 6). These figures partly reflect different levels of poverty in these different racial-ethnic groups. Poor white youngsters also have a high unemployment rate (46%). Nevertheless, youth of color who are poor have particularly high unemployment rates (blacks, 66%; Latinos, 56%).
Thus, youth of color, especially the poor, are at a disadvantage in gaining employment experience, especially during the recent economic crisis. The lower labor participation rates of youth of color may reflect a higher prevalence of discouraged workers who exit the labor force after numerous attempts to secure employment.
Economic and Family Matters
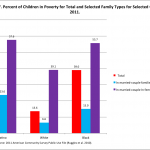
More than one-third of Latino children are living in poverty, a rate that is slightly lower than the poverty rate of blacks and significantly higher than that of whites (Figure 7).
In general, children in female-headed family households are much more likely to be poor than children in married-couple households. Interestingly, however, the gap by household type is not as great among Latinos as among whites or blacks. Nearly a quarter of Latino children in married-couple families are poor, which suggests that marriage is not the solution to poverty issues in Latino communities. Latino families do not appear to receive the same degree of premium for having both parents at home that black and, especially, white families receive.
Figure 6
Figure 7
Figure 8
The Mortality Paradox of Latino Children
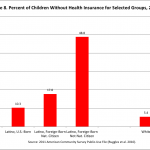
Latino children have many characteristics that are typically associated with problematic health and mortality outcomes. They tend to have low levels of educational attainment and high levels of poverty. In addition, Latino children are less than half as likely as white and black children to have health insurance. Approximately one in eight Latino youngsters lacks insurance (Figure 8). These indicators should predict significant health problems and relatively high levels of mortality among Latino children.
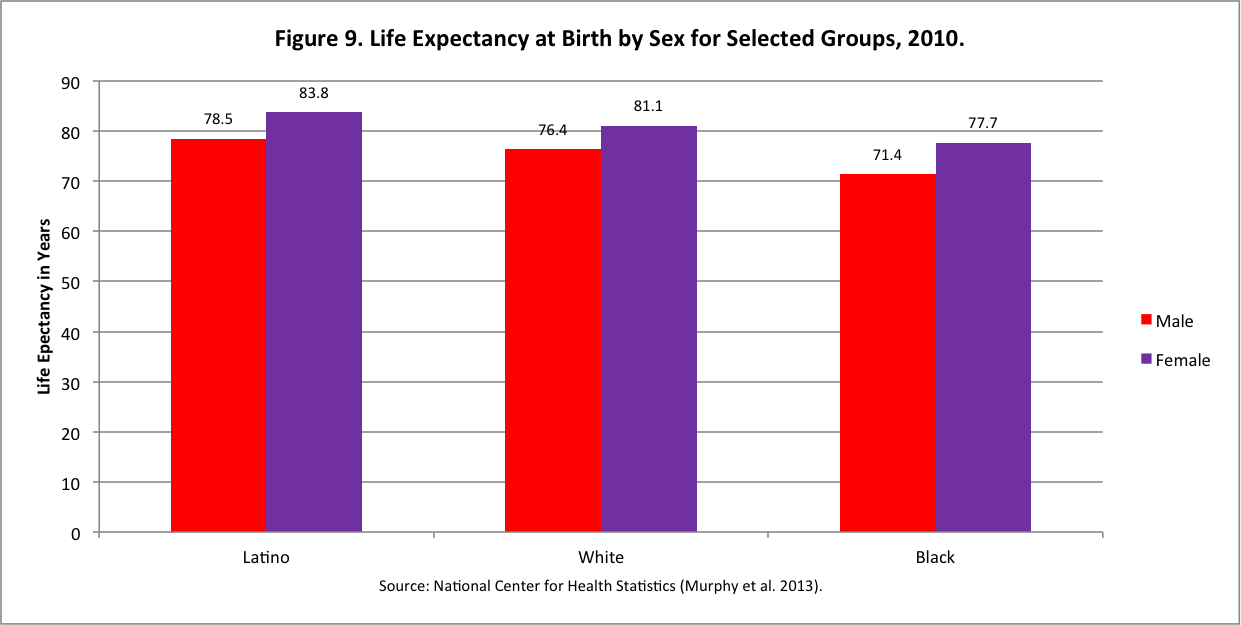
In fact, however, Latino children are quite healthy. Regardless of age, Latino children are less likely to die than white children and considerably less likely to die than black children (Table 2). Black infants, for example, are 2.3 times more likely than Latino children to die before reaching their first birthday. White youth between the ages of five and nine are 30% more likely to die than their Latino counterparts. Among both boys and girls, the life expectancy at birth of Latinos is higher than for their black or white counterparts.
Figure 9
Latino baby boys born in 2010 are estimated to live, on average, 2.1 more years than white baby boys and 7.1 more years than black baby boys (Figure 9). Latina baby girls born in 2010 are expected to live an average of 2.7 more years than white baby girls and 6.1 more years than black baby girls.
These favorable mortality patterns of Latino children exemplify the epidemiological paradox (also referred to as the Latino paradox) that was first observed approximately three decades ago. Despite having higher levels of poverty and lower access to health insurance, Latino infants and children tend to die at relatively low levels even compared to more advantaged white children.
The epidemiological paradox involving infant mortality is due primarily to foreign-born Latinas who, in particular, tend to give birth to healthy babies. Why do foreign-Latinas, despite their low socioeconomic status, have healthy babies? Several hypotheses have been proposed to explain this epidemiological paradox. For example, Alberto Palloni and Jeffrey Morenoff (2001) suggest that women who migrate to the United States tend to be healthy and therefore have healthy babies.
Happy, healthy kids in Guatemala, as photographed by David Amsler (photo via flickr creative commons; click for original).
In addition, Dolores Acevedo-Garcia and her colleagues (2007) argue that Latina immigrant women hold on to more traditional and healthy cultural practices—e.g., high levels of family support, low levels of smoking and drinking, and so forth—leading to healthier babies. Alternatively, Palloni and Morenoff (2001) suggest that the paradox may be a statistical artifact: If immigrant women give birth along the border and return to Mexico after the baby is born, any deaths of such infants are recorded in Mexico, resulting in an undercounting of the actual death rate in the United States. While the verdict is still out on the explanation of the epidemiological paradox, I suspect that while these all hypotheses carry some weight, cultural practices associated with low levels of smoking and drinking are especially important in producing healthy babies. Yet the health advantage of immigrants, including Latinos, diminishes with increasing time in the United States, as they adopt American lifestyles and diets.
Conclusion
By 2020, nonwhite children as a whole will outnumber white children, with Latinos replacing whites as the nation’s single largest child population sometime between 2050 and 2060. It is already clear that Latinos are become an increasingly larger share of American students, workers, consumers, and voters. For this reason, it is crucial that policymakers develop policies and programmatic initiatives to ensure that Latino children succeed educationally and reach their full potential. While this report points to a need to improve access to education, health insurance, and jobs for Latinos, it also suggests that Latinos may offer a model for other Americans in protecting children from premature death. It is essential that Latino children be viewed as an asset rather than a liability, as children who are our children and our future. An investment in the future of these children—upwards of 90% born in the United States—will yield major returns in the form of an educated and competitive workforce and engaged citizenry.It is essential that Latino children be viewed as an asset rather than a liability, as our children and our future. An investment in them will yield major returns in the form of an educated and competitive workforce and engaged citizenry.
References:
Acevedo-Garcia, Mah-J. Soobader, and Lisa F. Berkman. 2007. “Low Birthweight among U.S. Hispanic/Latino Subgroups: The Effect of Maternal Foreign-Born Status and Education.”Social Science & Medicine 65:2503-2516.
Antecol, Heather and Kelly Bedard. 2006. “Unhealthy Assimilation: Why Do Immigrants Converge to American Health Status Levels?”Demography 43 (2):337-360.
King, Miriam, Steven Ruggles, J. Trent Alexander, Sarah Flood, Katie Genadek, Matthew B. Schroeder, Brandon Trampe, and Rebecca Vick. 2010. Integrated Public Use Microdata Series, Current Population Survey: Version 3.0. [Machine-readable database]. Minneapolis: University of Minnesota.Accessed online on 16 December 2013 at https://cps.ipums.org/cps/.
Murphy, Sherry L., Jiaquan Xu, and Kenneth D. Kochanek. 2013. Deaths: Final Data for 2010.National Vital Statistics Reports 61 (4).Hyattsville, MD: National Center for Health Statistics.Accessed online on 19 December 2013 at http://www.cdc.gov/nchs/data/nvsr/nvsr61/nvsr61_04.pdf.
Palloni, Alberto and Jeffrey Morenoff. 2001. “Interpreting the Paradoxical in the Hispanic Paradox: Demographic and Epidemiological Approaches.”Annals of the New York Academy of Sciences 954 (1):140-174.
Ruggles, Steven, J. Trent Alexander, Katie Genadek, Ronald Goeken, Matthew B. Schroeder, and Matthew Sobek. 2010. Integrated Public Use Microdata Series: Version 5.0 [Machine-readable database]. Minneapolis: University of Minnesota. Accessed online on 16 December 2013 at https://usa.ipums.org/usa/index.shtml.
Contact Rogelio Sáenz, Dean for the College of Public Policy, University of Texas-San Antonio.
July 2, 2014 marks the 50th anniversary of the signing of the Civil Rights Act of 1964. In February 2014, CCF convened an online Civil Rights Symposium. To read or download the entire symposium, visit here.
The following is a repost in honor of the 51st anniversary of the Equal Pay Act.
The Equal Pay Act is often presumed to be an accomplishment of the feminist movement of the 1960s. In fact, it was spearheaded by female trade unionists, who first introduced the bill in 1945 as an amendment to the 1938 Fair Labor Standards Act. The bill was defeated, largely because of staunch opposition from business interests, but a coalition of labor activists reintroduced it every year until it finally passed in 1963.
The bill originally required “equal wage rates for work of comparable character on jobs the performance of which requires comparable skills,” wording that would have forced employers to pay women in traditionally sex-segregated jobs as much as men with comparable skills in traditionally male occupations. The 1963 act that finally passed was a compromise that instead required equal pay for “equal work.” Given the pervasiveness of job segregation by gender, this weakened requirement for equity ensured that the law had a far more limited impact.
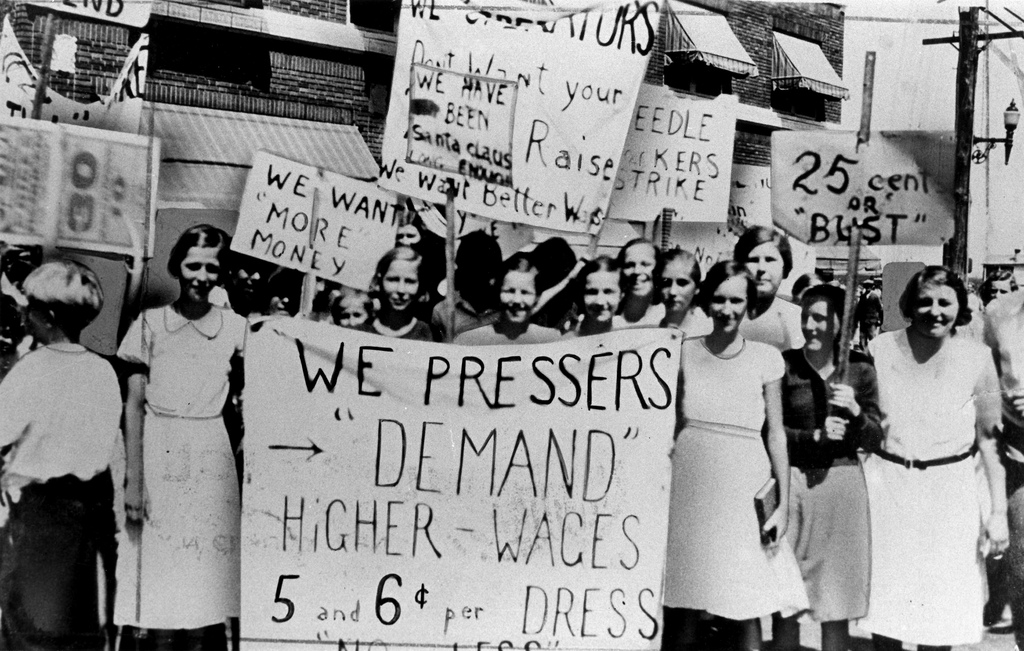
Historic photo via Cornell University Kheel Center.
Had the unionists gotten their way, the gains for women workers since 1963 would have been more evenly distributed along class lines. Whereas for elite professionals and many other college-educated workers, job segregation by gender has been substantially reduced in the past half-century, the extent of segregation in working-class jobs is just as high as it was in 1963.
Most non-college educated women remain trapped in the pink-collar ghetto, working as waitresses, child care and eldercare workers, or as clerical and retail sales workers. In such jobs women are typically paid at or near the minimum wage, often without even basic benefits like paid sick days, and with few opportunities for advancement. If the Equal Pay Act required equal pay for comparable work, child care workers, a traditionally female-dominated job, could not be paid less than zookeepers, for example.
Although female unionists led the campaign for the Act, at the time they were woefully underrepresented in the organized labor movement. In 1960, 24 percent of U.S. workers were unionized, but women made up only 18.3 percent of union members. Half a century later, in 2012, women make up nearly half (48.3 percent) of the U.S. workforce and nearly as large a proportion (45.0 percent) of all union members. Yet at the same time, the power and reach of unions have declined dramatically. Today, only 11 percent of American workers are union members, and in the private sector, the figure is below seven percent.
The simultaneous decline in union power and rise in female representation among unions reflects the massive expansion – starting in the 1960s and 1970s – of public-sector unionism, alongside the massive contraction of private-sector unionism over the same period. Women are overrepresented in public sector employment, making up a large majority of workers in fields like education, health care, and government administration- all now highly unionized sectors. In contrast, private-sector union membership is far more male-dominated, with strongholds in sectors like construction, utilities, transportation and manufacturing.
Employers have successfully attacked private-sector unionism in the past few decades, and unionization rates have fallen apace. By contrast, until very recently public-sector unions remained largely intact. But starting in 2011, a wave of state-level legislation weakening collective bargaining rights for public sector workers has directly targeted teachers and other unionized female-dominated occupations. These attacks will roll back many of the gains women made since the 1960s. In 2012, the average hourly earnings of unionized women stood at $24.18, compared to $18.74 for nonunion women workers. Unionized workers also are much more likely than their nonunion counterparts to have access to benefits like employer-sponsored health insurance, paid sick days, and pensions. And union workers have more job security as well.The labor movement has fought to improve women workers’ situation throughout American history. Today, women have a bigger stake than ever in the survival of unions.
The labor movement has fought to improve women workers’ situation throughout American history. And today, women have a bigger stake than ever before in the survival of unions – which now face unprecedented attacks and are virtually threatened with extinction. As we commemorate the 50th anniversary of the Equal Pay Act, we should not only recall the history of women in unions but also consider the potential impact of ongoing union decline on women working today.
Ruth Milkman is in the sociology department at the City University of New York. She studies past and present labor and labor movements.
About Council on Contemporary Families
The Council on Contemporary Families is a non-profit, non-partisan organization dedicated to providing the press and public with the latest research and best-practice findings about American families. CCF seeks to enhance the national understanding of how and why families are changing, what needs and challenges they face, and how these needs can best be met.