Originally posted at Reports from the Economic Front.

Defenders of capitalism in the United States often choose not to use that term when naming our system, preferring instead the phrase “market system.”  Market system sounds so much better, evoking notions of fair and mutually beneficial trades, equality, and so on.  The use of that term draws attention away from the actual workings of our system.

In brief, capitalism is a system structured by the private ownership of productive assets and driven by the actions of those who seek to maximize the private profits of the owners.  Such an understanding immediately raises questions about how some people and not others come to own productive wealth and the broader social consequences of their pursuit of profit.

Those are important questions because it is increasingly apparent that while capitalism continues to produce substantial benefits for the largest asset owners, those benefits have increasingly been secured through the promotion of policies – globalization, financialization, privatization of state services, tax cuts, attacks on social programs and unions – that have both lowered overall growth and left large numbers of people barely holding the line, if not actually worse off.

The following two figures come from a Washington Post article by Jared Bernstein in which he summarizes the work of Thomas Piketty, Emmanuel Saez and Gabriel Zucman. The first set of bars shows the significant decline in US pre-tax income growth.  In the first period (1946-1980), pre-tax income grew by 95 percent.  In the second (1980-2014), it grew by only 61 percent.

income-trends

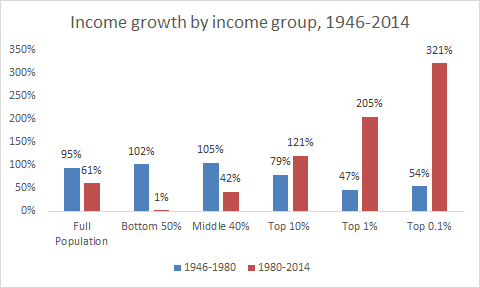
This figure also shows that this slower pre-tax income growth has not been a problem for those at the top of the income distribution.  Those at the top more than compensated for the decline by capturing a far greater share of income growth than in the past.  In fact, those in the bottom 50 percent of the population gained almost nothing over the period 1980 to 2014.

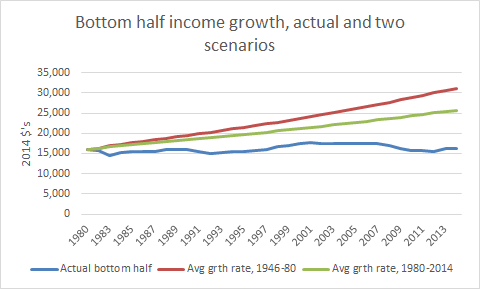
The next figure helps us see that the growth in inequality has been far more damaging to the well-being of the bottom half than the slowdown in overall income growth.  As Bernstein explains:

The bottom [blue] line in the next figure shows actual pretax income for adults in the bottom half of the income scale. The top [red] line asks how these folks would have done if their income had grown at the average rate from the earlier, faster-growth period. The middle [green] line asks how they would have done if they experienced the slower, average growth of the post-1980 period.

The difference between the top two lines is the price these bottom-half adults paid because of slower growth. The larger gap between the middle and bottom line shows the price they paid from doing much worse than average, i.e., inequality… That explains about two-thirds of the difference in endpoints. Slower growth hurt these families’ income gains, but inequality hurt them more.

inequality-versus-growth

A New York Times analysis of pre-tax income distribution over the period 1974 to 2014 reinforces this conclusion about the importance of inequality.  As we can see in the figure below, the top 1 percent and bottom 50 percent have basically changed places in terms of their relative shares of national income.

changing-places

The steady ratcheting down in majority well-being is perhaps best captured by studies designed to estimate the probability of children making more money than their parents, an outcome that was the expectation for many decades and that underpinned the notion of “the American dream.”

Such research is quite challenging, as David Leonhardt explains in a New York Times article, “because it requires tracking individual families over time rather than (as most economic statistics do) taking one-time snapshots of the country.”  However, thanks to newly accessible tax records that go back decades, economists have been able to estimate this probability and how it has changed over time.

Leonhardt summarizes the work of one of the most important recent studies, that done by economists associated with the Equality of Opportunity Project. In summary terms, those economists found that a child born into the average American household in 1940 had a 92 percent chance of making more than their parents.  This falls to 79 percent for a child born in 1950, 62 percent for a child born in 1960, 61 percent for a child born in 1970, and only 50 percent for a child born in 1980.

The figure below provides a more detailed look at the declining fortunes of most Americans.   The horizontal access shows the income percentile a child is born into and the vertical access shows the probability of that child earning more than their parents.   The drop-off for children born in 1960 and 1970 compared to the earlier decade is significant and is likely the result of the beginning effects of the changes in capitalist economic dynamics that started gathering force in the late 1970s, for example globalization, privatization, tax cuts, union busting, etc.  The further drop-off for children born in 1980 speaks to the strengthening and consolidation of those dynamics.

american-dream

The income trends highlighted in the figures above are clear and significant, and they point to the conclusion that unless we radically transform our capitalist system, which will require building a movement capable of challenging and overcoming the power of those who own and direct our economic processes, working people in the United States face the likelihood of an ever-worsening future.

Martin Hart-Landsberg, PhD is a professor emeritus of economics at Lewis and Clark College. You can follow him at Reports from the Economic Front.

Originally posted at Reports from the Economic Front.

For years now the wealthy and their media have hammered on the need for lower taxes on their income, arguing that this would encourage investment, job creation, and growth.  The tax burden on the wealthy has indeed been lowered in one way or the other, but only the wealthy have benefited. In particular, our public sector and the activities it supports — public infrastructure, education, health care and human services, etc. — have suffered.

Apparently, people are starting to draw the right lesson from this experience.  As the Washington Post reports:

The results from the Public Religion Research Institute and the Brookings Institution [survey] show that 54 percent of Republicans support increasing taxes on those with incomes over $250,000 a year, an increase of 18 percentage points since the last presidential election in 2012. Among Americans as a whole, 69 percent support an increase.

tax increase

While the change in opinion was greatest for Republicans, as the figure above shows, the survey also found increased support for greater taxes on the rich among both Democrats and Independents.  The fact that this support began spiking early in the year suggests that the change is tied to the election process, although it is unclear whether the campaigns are driving the growing support for higher taxes on the wealthy or people are just taking advantage of the process to express their desire for change.

Martin Hart-Landsberg is a professor of economics at Lewis and Clark College. You can follow him at Reports from the Economic Front.

The Wall Street Journal’s Real Time Economics recently looked at wealth inequality.  The first chart taken from the post shows wealth differences by race and age of head of family.

wealth gap

Racial differences (white versus black and Hispanic) dominate whether looking at average or median net worth, and the gap grows as the head of the family ages.  Median figures are especially sobering, showing the limited wealth generation of representative black and Hispanic heads of families regardless of age.

So, do these advantages and disadvantages transfer to the next generation? Yes, and not just laterally. This second chart looks at the relationship between inheritance and wealth generation.

Inheritance

Inheritance was divided into ten groups.  WARNING: THE TENTH GROUP, WHICH RECEIVED THE LARGEST INHERITANCE, IS NOT SHOWN.

As Josh Zumrun, the author of the blog, explains:

The bottom 10% of inheritors received an inheritance averaging only about $2,000. Families receiving this much inheritance aren’t that wealthy.

But among families that received a $35,000 inheritance, their net worth is over half a million. Families that received a $125,000 inheritance are worth $780,000 on average and those that receive a $200,000 inheritance are, on average, millionaires. (The top 10% of inheritors, not pictured in this chart, inherit $1.6 million on average and have a net worth of $4.2 million.)

The take-away is pretty simple: Wealth inequality is real, with strong racial determinants, and is also, to a significant degree, self-reinforcing.

Originally posted at Reports from the Economic Front.

———————————

Martin Hart-Landsberg is a professor of economics at Lewis and Clark College. You can follow him at Reports from the Economic Front.

2 (1)It seems certain that the political economy textbooks of the future will include a chapter on the experience of Greece in 2015.

On July 5, 2015, the people of Greece overwhelmingly voted “NO” to the austerity ultimatum demanded by what is colloquially being called the Troika, the three institutions that have the power to shape Greece’s future: the European Commission, the International Monetary Fund, and the European Central Bank.

The people of Greece have stood up for the rights of working people everywhere.

Background

Greece has experienced six consecutive years of recession and the social costs have been enormous.  The following charts provide only the barest glimpse into the human suffering:

Infographics / Unemployment
Infographics / Social Impact
Infographics / Poverty

While the Troika has been eager to blame this outcome on the bungling and dishonesty of successive Greek governments and even the Greek people, the fact is that it is Troika policies that are primarily responsible. In broad brush, Greece grew rapidly over the 2000s in large part thanks to government borrowing, especially from French and German banks.  When the global financial crisis hit in late 2008, Greece was quickly thrown into recession and the Greek government found its revenue in steep decline and its ability to borrow sharply limited. By 2010, without its own national currency, it faced bankruptcy.

Enter the Troika. In 2010, they penned the first bailout agreement with the Greek government. The Greek government received new loans in exchange for its acceptance of austerity policies and monitoring by the IMF. Most of the new money went back out of the country, largely to its bank creditors. And the massive cuts in public spending deepened the country’s recession.

By 2011 it had become clear that the Troika’s policies were self-defeating. The deeper recession further reduced tax revenues, making it harder for the Greek government to pay its debts. Thus in 2012 the Troika again extended loans to the Greek government as part of a second bailout which included . . . wait for it . . . yet new austerity measures.

Not surprisingly, the outcome was more of the same. By then, French and German banks were off the hook. It was now the European governments and the International Monetary Fund that worried about repayment. And the Greek economy continued its downward ascent.

Significantly, in 2012, IMF staff acknowledged that the its support for austerity in 2010 was a mistake. Simply put, if you ask a government to cut spending during a period of recession you will only worsen the recession. And a country in recession will not be able to pay its debts. It was a pretty clear and obvious conclusion.

But, significantly, this acknowledgement did little to change Troika policies toward Greece.

By the end of 2014, the Greek people were fed up. Their government had done most of what was demanded of it and yet the economy continued to worsen and the country was deeper in debt than it had been at the start of the bailouts. And, once again, the Greek government was unable to make its debt payments without access to new loans. So, in January 2015 they elected a left wing, radical party known as Syriza because of the party’s commitment to negotiate a new understanding with the Troika, one that would enable the country to return to growth, which meant an end to austerity and debt relief.

Syriza entered the negotiations hopeful that the lessons of the past had been learned. But no, the Troika refused all additional financial support unless Greece agreed to implement yet another round of austerity. What started out as negotiations quickly turned into a one way scolding. The Troika continued to demand significant cuts in public spending to boost Greek government revenue for debt repayment. Greece eventually won a compromise that limited the size of the primary surplus required, but when they proposed achieving it by tax increases on corporations and the wealthy rather than spending cuts, they were rebuffed, principally by the IMF.

The Troika demanded cuts in pensions, again to reduce government spending. When Greece countered with an offer to boost contributions rather than slash the benefits going to those at the bottom of the income distribution, they were again rebuffed. On and on it went. Even the previous head of the IMF penned an intervention warning that the IMF was in danger of repeating its past mistakes, but to no avail.

Finally on June 25, the Troika made its final offer. It would provide additional funds to Greece, enough to enable it to make its debt payments over the next five months in exchange for more austerity.  However, as the Greek government recognized, this would just be “kicking the can down the road.” In five months the country would again be forced to ask for more money and accept more austerity. No wonder the Greek Prime Minister announced he was done, that he would take this offer to the Greek people with a recommendation of a “NO” vote.

The Referendum

Almost immediately after the Greek government announced its plans for a referendum, the leaders of the Troika intervened in the Greek debate. For example, as the New York Times reported:

By long-established diplomatic tradition, leaders and international institutions do not meddle in the domestic politics of other countries. But under cover of a referendum in which the rest of Europe has a clear stake, European leaders who have found [Greece Prime Minister] Tsipras difficult to deal with have been clear about the outcome they prefer.

Many are openly opposing him on the referendum, which could very possibly make way for a new government and a new approach to finding a compromise. The situation in Greece, analysts said, is not the first time that European politics have crossed borders, but it is the most open instance and the one with the greatest potential effect so far on European unity…

Martin Schulz, a German who is president of the European Parliament, offered at one point to travel to Greece to campaign for the “yes” forces, those in favor of taking a deal along the lines offered by the
creditors.

On Thursday, Mr. Schulz was on television making clear that he had little regard for Mr. Tsipras and his government. “We will help the Greek people but most certainly not the government,” he said.

European leaders actively worked to distort the terms of the referendum. Greeks were voting on whether to accept or reject Troika austerity policies yet the Troika leaders falsely claimed the vote was on whether Greece should remain in the Eurozone. In fact, there is no mechanism for kicking a country out of the Eurozone and the Greek government was always clear that it was not seeking to leave the zone.

Having whipped up popular fears of an end to the euro, some Greeks began talking their money out of the banks. On June 28, the European Central Bank then took the aggressive step of limiting its support to the Greek financial system.

This was a very significant and highly political step. Eurozone governments do not print their own money or control their own monetary systems. The European Central Bank is in charge of regional monetary policy and is duty bound to support the stability of the region’s financial system. By limiting its support for Greek banks it forced the Greek government to limit withdrawals which only worsened economic conditions and heightened fears about an economic collapse. This was, as reported by the New York Times, a clear attempt to influence the vote, one might even say an act of economic terrorism:    

Some experts say the timing of the European Central Bank action in capping emergency funding to Greek banks this week appeared to be part of a campaign to influence voters.

“I don’t see how anybody can believe that the timing of this was coincidence,” said Mark Weisbrot, an economist and a co-director of the Center for Economic and Policy Research in Washington. “When you restrict the flow of cash enough to close the banks during the week of a referendum, this is a very deliberate move to scare people.”

Then on July 2, three days before the referendum, an IMF staff report on Greece was made public. Echos of 2010, the report made clear that Troika austerity demands were counterproductive. Greece needed massive new loans and debt forgiveness. The Bruegel Institute, a European think tank, offered a summary and analysis of the report, concluding that “the creditors negotiated with Greece in bad faith” and used “indefensible economic logic.”

The leaders of the Troika were insisting on policies that the IMF’s own staff viewed as misguided.  Moreover, as noted above, European leaders desperately but unsuccessfully tried to kill the report. Only one conclusion is possible: the negotiations were a sham.

The Troika’s goals were political: they wanted to destroy the leftist, radical Syriza because it represented a threat to a status quo in which working people suffer to generate profits for the region’s leading corporations. It apparently didn’t matter to them that what they were demanding was disastrous for the people of Greece. In fact, quite the opposite was likely true: punishing Greece was part of their plan to ensure that voters would reject insurgent movements in other countries, especially Spain.

The Vote

And despite, or perhaps because of all of the interventions and threats highlighted above, the Greek people stood firm. As the headlines of a Bloomberg news story proclaimed: “Varoufakis: Greeks Said ‘No’ to Five Years of Hypocrisy.”

The Greek vote was a huge victory for working people everywhere.

Now, we need to learn the lessons of this experience. Among the most important are: those who speak for dominant capitalist interests are not to be trusted. Our strength is in organization and collective action. Our efforts can shape alternatives.

Cross-posted at Reports from the Economic Front.

Martin Hart-Landsberg is a professor of economics at Lewis and Clark College. You can follow him at Reports from the Economic Front.

They hold the same amount of wealth.

We all know that wealth is unequally distributed in the US. But, the results of a new study by the Institute for Policy Studies, authored by Chuck Collins and Josh Hoxie, are still eye popping.

Collins and Hoxie find that the wealthiest 0.1 percent of US households, an estimated 115,000 households with a net worth starting at $20 million, own more than 20 percent of total US household wealth. That is up from 7 percent in the 1970s. This group owns approximately the same total wealth as the bottom 90 percent of US households.

Moving up the wealth ladder, they calculate that the top 400 people—yes, people not households, each with a net worth starting at $1.7 billion, have more wealth than the bottom 61 percent of the US population, an estimated 70 million households or 194 million people.

Finally, we get to the top 20 people, those sitting at the pinnacle of the US wealth distribution. As the authors explain:

The wealthiest 20 individuals in the United States today hold more wealth than the bottom half of the U.S. population combined. These 20 super wealthy — a group small enough to fly together on one Gulfstream G650 private jet — have as much wealth as the 152 million people who live in the 57 million households that make up the bottom half of the U.S. population.

2

Although obvious, it is still worth emphasizing, as Collins and Hoxie do, that great wealth translates into great power, the power to shape economic policies. And, in a self-reinforcing cycle, the resulting policies, by design, create new opportunities for the wealthy to capture more wealth. Think: free trade agreements, privatization policies, tax policy, and labor and environmental laws and regulations.

Oh yes, also think presidential politics. As a New York Times study points out:

They are overwhelmingly white, rich, older and male . . . . Across a sprawling country, they reside in an archipelago of wealth, exclusive neighborhoods dotting a handful of cities and towns… Now they are deploying their vast wealth in the political arena, providing almost half of all the seed money raised to support Democratic and Republican presidential candidates. Just 158 families, along with companies they own or control, contributed $176 million in the first phase of the campaign, a New York Times investigation found (emphasis added).

And yet, one still hears some people say that class analysis has no role to play in explaining the dynamics of the US political economy. Makes you wonder who pays their salary.

Originally posted at Reports from the Economic Front.

Martin Hart-Landsberg is a professor of economics at Lewis and Clark College. You can follow him at Reports from the Economic Front.

The Federal Reserve has announced that it is holding off on an interest rate hike; the last time it raised rates was in 2006.  The reason for the lack of action: the Federal Reserve believes the economy remains fragile and, since inflation remains low, it doesn’t want to do anything that might bring the expansion to a halt.

In reality our economic problems go much deeper than slow growth and economic fragility.  Bluntly said, most workers are losing ground regardless of whether the economy is in recession or expansion.

The following chart, from a New York Times article, shows the movement in real, inflation adjusted, median household income from 1999 to 2014.

2

The median household income was $53,657 in 2014.  That was 1.5 percent below what it was in 2013.  Perhaps even more disturbing, as the Times article notes:

The 2014 real median income number is 6.5 percent below its 2007, pre-crisis level. It is 7.2 percent below the number in 1999.

A middle-income American family, in other words, makes substantially less money in inflation-adjusted terms than it did 15 years ago. And there is no evidence that is reversing…

The depressing data on middle-class wages is true across almost all groups based on race and age. (One exception is a 5.3 percent gain in median wages among Hispanics in 2014, though that is within the statistical margin of error and so may not be meaningful).

And there is good reason for believing that things are unlikely to improve in the near future.  As a recent study by the National Employment Law Project makes clears, real wages are continuing to fall for most workers.

The authors of the National Employment Law Project study “calculated the percentage change in real median hourly wages from 2009 to 2014 for 785 occupations, which were grouped into quintiles, each representing approximately one-fifth of total employment in 2014.”  Figure 1 shows the change in real wages for each of the five quintiles over the period.  As we can see, real median hourly wages fell across the board, with the overall median wage falling by 4 percent.

3

Figure 2 keeps the same wage groupings but shows the change in wages for both the highest (90th percentile) and lowest (10th percentile) earners in each wage quintile. As we can see, with the exception of occupations in the lowest paid quintile, the fall in wages was greater for those in the bottom percentile than for those in the top percentile.  That said, the most striking fact is that all suffered declines in real wages.

4

Steady as she goes, which seems to be the strategy of most policy-makers, is unlikely to turn things around.

Originally posted at Reports from the Economic Front.

Martin Hart-Landsberg is a professor of economics at Lewis and Clark College. You can follow him at Reports from the Economic Front.

President Obama continues to press for a form of fast track approval to ensure Congressional support for two major trade agreements: the Trans-Pacific Trade Partnership Agreement (with 11 other countries) and the Trans-Atlantic Trade and Investment Partnership Agreement (with the entire European Union).

Both agreements, based on leaks of current negotiating positions, have been structured to promote business interests and will have negative consequences for working people relative to their wages and working conditions, access to public services, and the environment.

These agreements are being negotiated in secret: even members of Congress are locked out of the negotiating process.  The only people that know what is happening and are in a position to shape the end result are the U.S. trade representative and a select group of 566 advisory group members selected by the U.S. trade representative.

Thanks to a recent Washington Post post we can see who these advisory group members are and, by extension, whose interests are served by the negotiations.  According to the blog post, 480 or 85% of the members are from either industry or trade association groups.  The remaining 15% are academics or members of unions, civil society organizations, or government committees.  The blog post includes actual names and affiliations.

Here we can see the general picture of corporate domination of U.S. trade policy as illustrated by the Washington Post.
3
9 10

In short, corporate interests are well placed to directly shape our trade policies.  No wonder drafts of these treaties include chapters that, among other things, lengthen patent protection for drugs, promote capital mobility and privatization of public enterprises, and allow corporations to sue governments in supra-national secret tribunals if public policies reduce expected profits.

Cross-posted at Reports from the Economic Front and Pacific Standard.

Martin Hart-Landsberg is a professor of economics at Lewis and Clark College. You can follow him at Reports from the Economic Front.

Americans have become increasingly critical of public policy as a means of addressing social problems.  Many believe that these policies don’t work; the reality is that public policies are often subverted in ways that make them ineffective or even counterproductive.

Take taxes and inequality.  As Danny Vinik, writing in the New Republic explains:

The vast majority of Americans—both liberals and conservatives—believe that state and local taxes should also be progressive. That’s the finding of a new report released by WalletHub Monday. The researchers surveyed 1,050 Americans on what they thought the combined rate of state and local taxes should be at various income levels. Not surprisingly, liberals want the rate structure to be a bit more progressive than conservatives do, but their responses [as the following chart shows] were relatively similar:

1 (3)

However the reality is quite different.  State and local taxes are actually quite regressive.  The Institute for Taxation and Economic Policy studied the “fairness of state and local tax systems by measuring the state and local taxes that will be paid in 2015 by different [non-elderly] income groups as a share of their incomes.”  They did this state by state and, as presented below, on an overall basis.  As we can see, the lower the income, the greater the state and local tax burden.

1 (4)

Here are some of the report’s key findings:

  • Virtually every state tax system is fundamentally unfair, taking a much greater share of income from low- and middle-income families than from wealthy families. The absence of a graduated personal income tax and overreliance on consumption taxes exacerbate this problem.
  • In the 10 states with the most regressive tax structures (the Terrible 10) the bottom 20 percent pay up to seven times as much of their income in taxes as their wealthy counterparts. Washington State is the most regressive, followed by Florida, Texas, South Dakota, Illinois, Pennsylvania, Tennessee, Arizona, Kansas, and Indiana.
  • Heavy reliance on sales and excise taxes are characteristics of the most regressive state tax systems. Six of the 10 most regressive states derive roughly half to two-thirds of their tax revenue from sales and excise taxes, compared to a national average of roughly one-third . Five of these states do not levy a broad-based personal income tax (four do not have any taxes on personal income and one state only applies its personal income tax to interest and dividends) while four have a personal income tax rate structure that is flat or virtually flat.
  • States commended as “low tax” are often high tax states for low-and middle-income families. The 10 states with the highest taxes on the poor are Arizona, Arkansas, Florida, Hawaii, Illinois, Indiana, Pennsylvania, Rhode Island, Texas, and Washington. Seven of these are also among the “terrible ten” because they are not only high tax for the poorest, but low tax for the wealthiest.

In short, we know how to construct tax policies that can lessen inequality, but we’re not using state and local taxes to do it.

Cross-posted at Reports from the Economic Front and Pacific Standard.

Martin Hart-Landsberg is a professor of economics at Lewis and Clark College. You can follow him at Reports from the Economic Front.