work

We’re celebrating the end of the year with our most popular posts from 2013, plus a few of our favorites tossed in.  Enjoy!

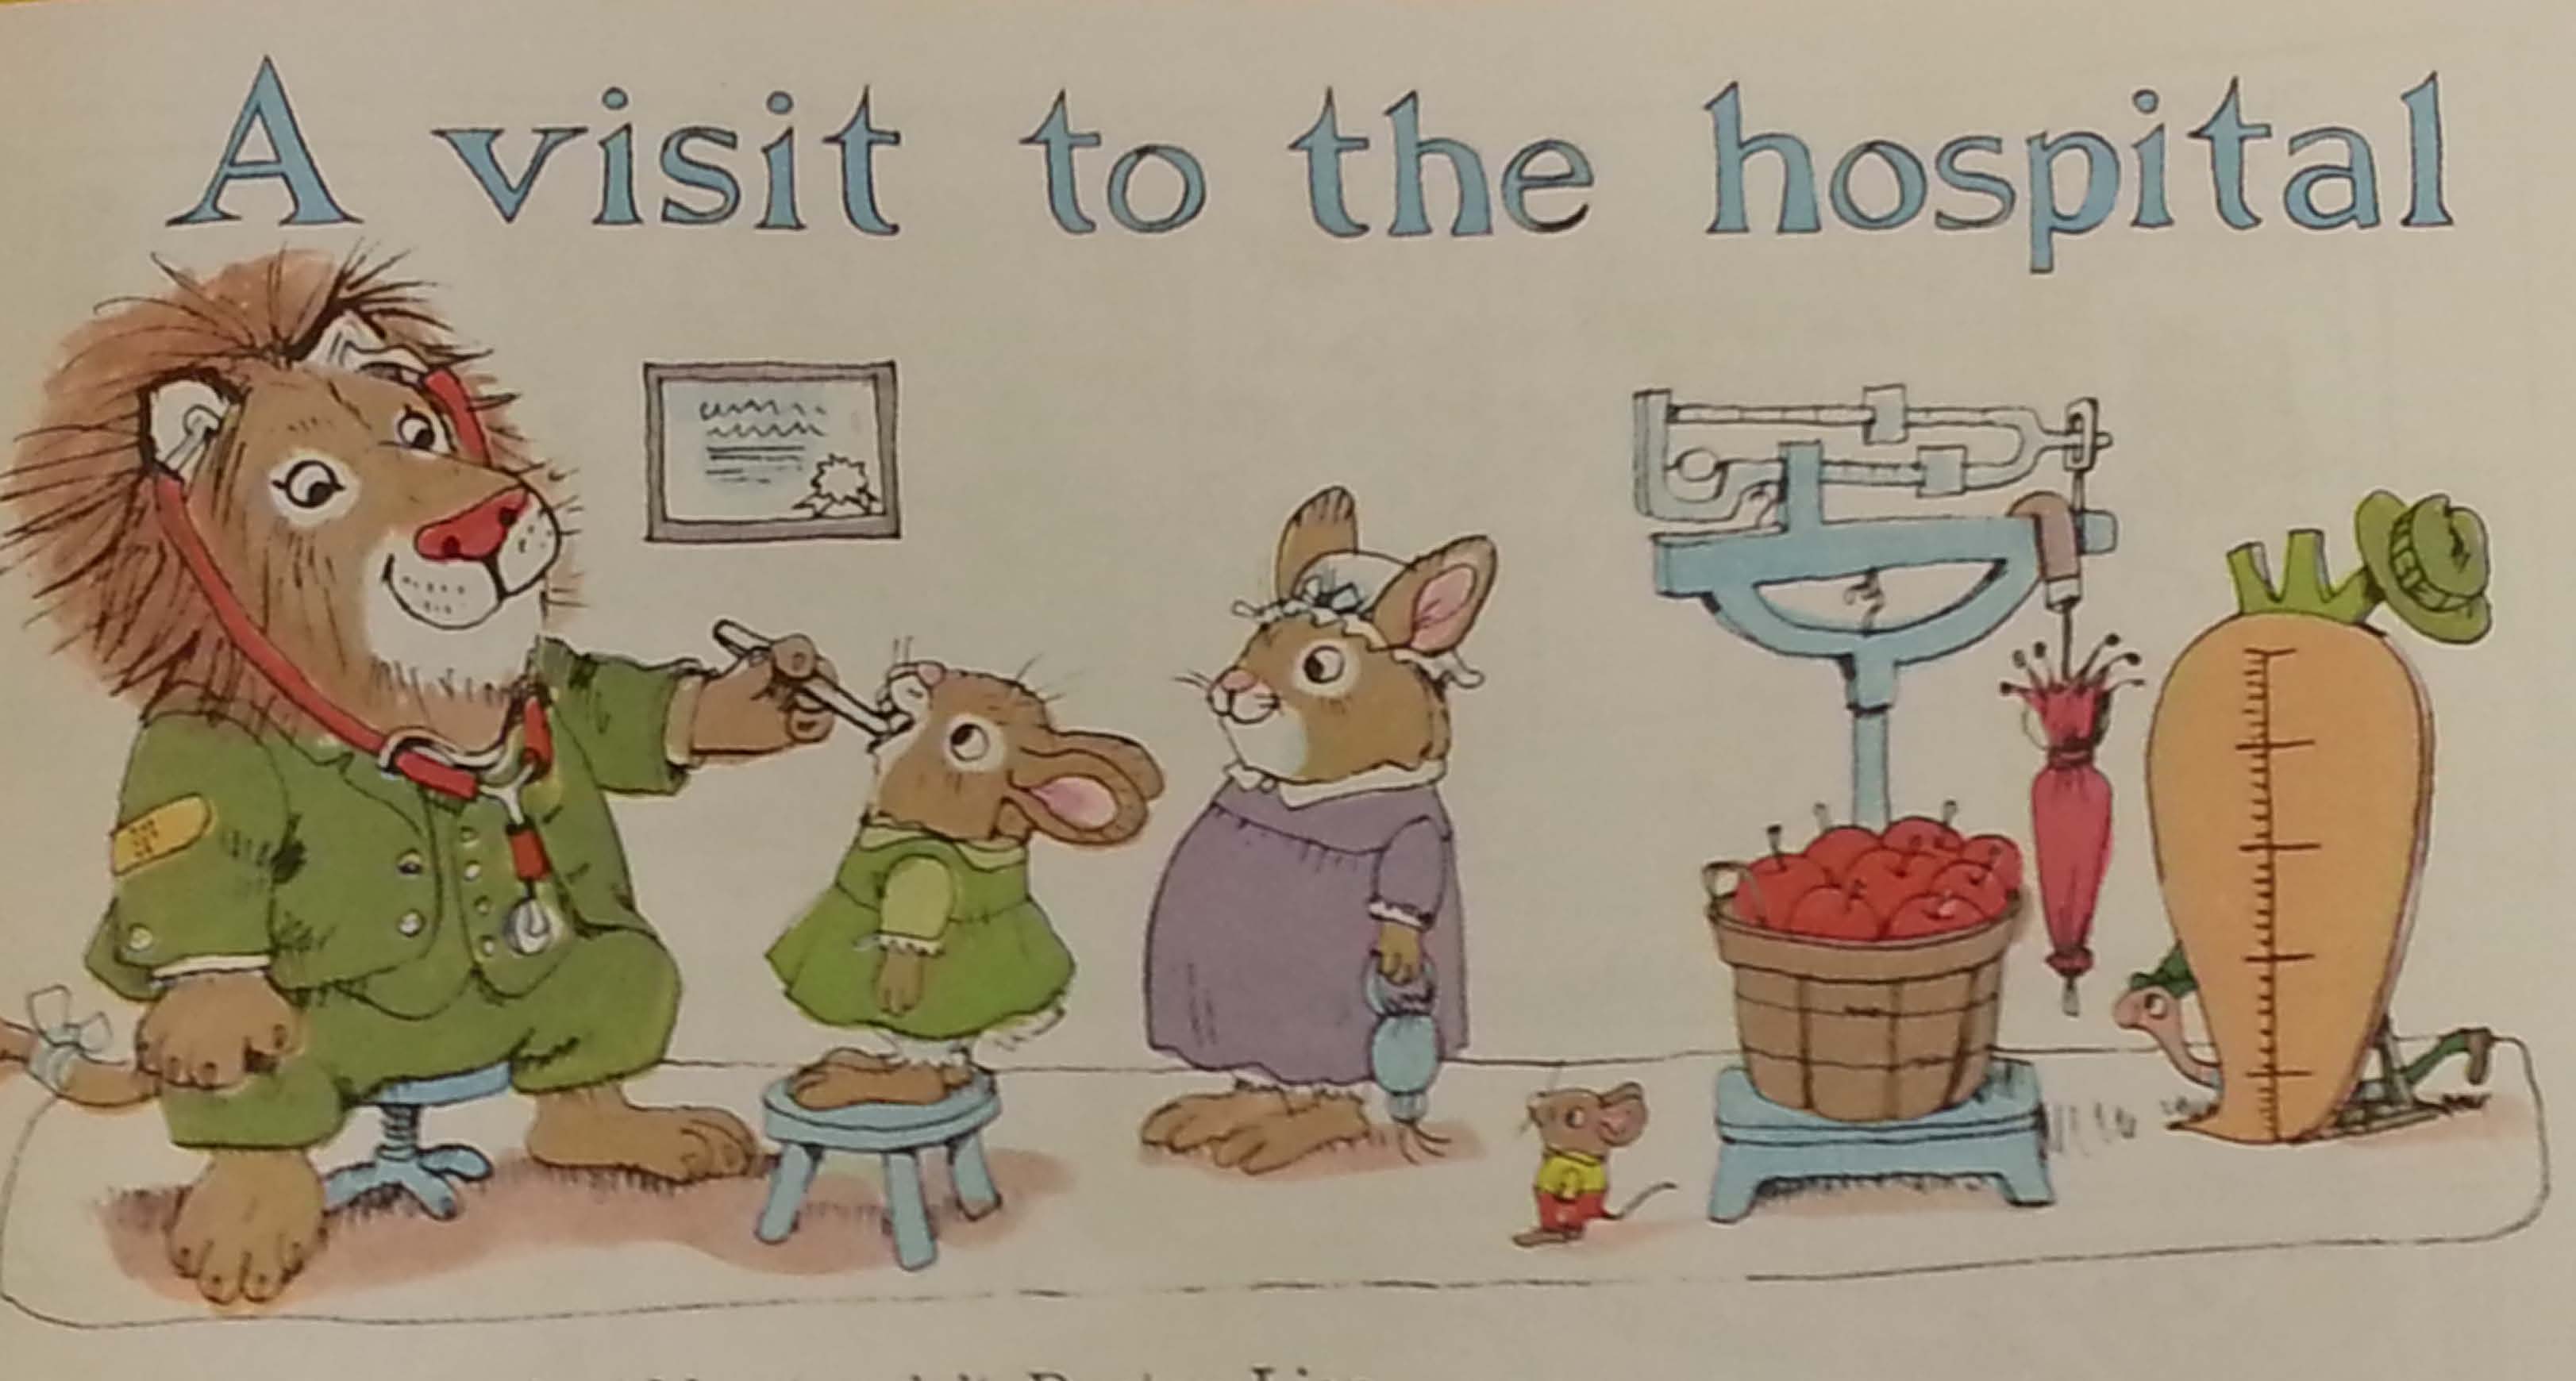
As children, many of us encountered Richard Scarry’s book, What Do People Do all Day?  A classic kid’s book, it uses animals to represent the division of labor that exists in “Busytown.”  The book is an example of a brilliant piece of analysis by sociologist John Levi Martin.

To oversimplify greatly: Martin analyzes nearly 300 children’s books and finds that there is a marked tendency for these texts to represent certain animals in particular kinds of jobs. Jobs that allow the occupant to exercise authority over others tend to be held by predatory animals (especially foxes), but never by “lower” animals (mice or pigs).

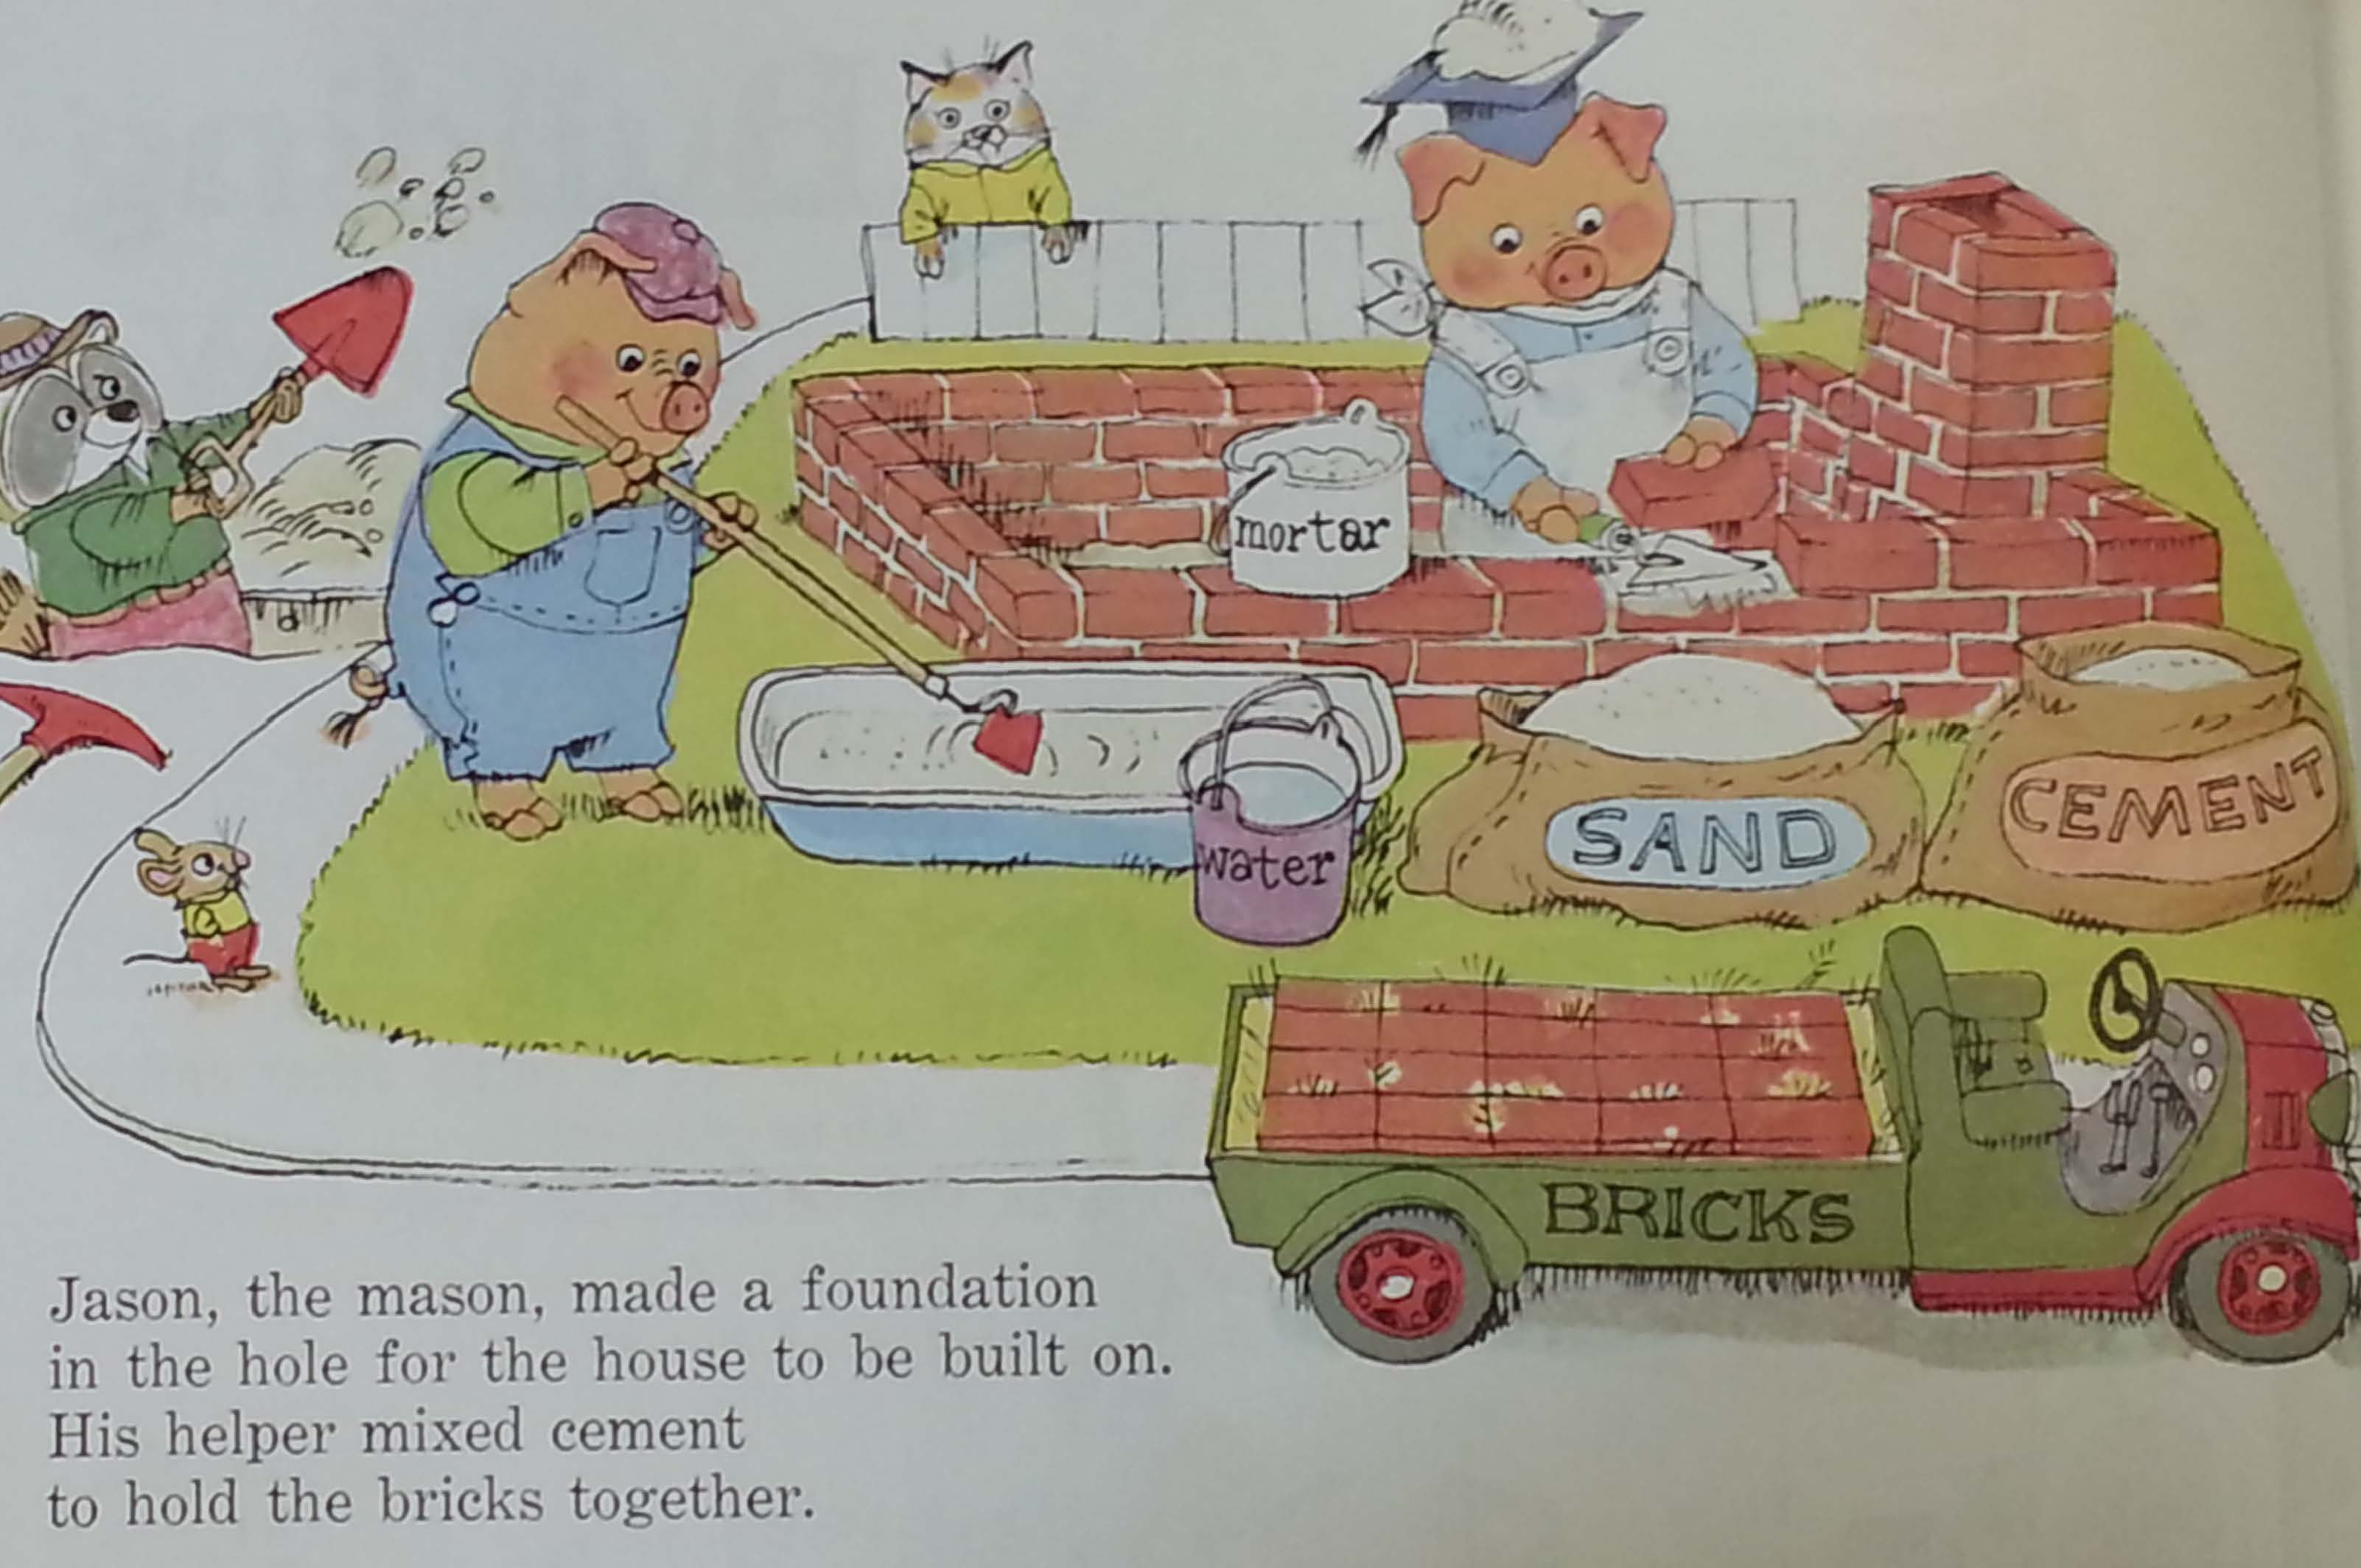
Pigs in particular are substantially over-represented in subordinate jobs (those with low skill and no authority), where their overweight bodies and (judging from the plots of these books) congenital stupidity seems to “naturally” equip them for subservient jobs. Here, see this additional image from Scarry’s book, showing construction work being performed by the above-mentioned swine.

In effect, Martin’s point is that there is a hidden language or code inscribed in children’s books, which teaches kids to view inequalities within the division of labor as a “natural” fact of life  — that is, as a reflection of the inherent characteristics of the workers themselves.  Young readers learn (without realizing it, of course) that some species-beings are simply better equipped to hold manual or service jobs, while other creatures ought to be professionals. Once this code is acquired by pre-school children, he suggests, it becomes exceedingly difficult to unlearn.  As adults, then, we are already predisposed to accept the hierarchical, caste-based system of labor that characterizes the American workplace.

Steven Vallas is a professor of sociology at Northeastern University.  He specializes in the sociology of work and employment.  His most recent book, Work: A Critique, offers an overview and discussion of the sociological literatures on the topic.  You can follow Steven at the blog Work in Progress.

Cross-posted at Work in Progress.

We’re celebrating the end of the year with our most popular posts from 2013, plus a few of our favorites tossed in.  Enjoy!

Like many people, I’ve been following news about the crash landing in San Francisco. It’s a frightening reminder of the risks that come with air travel, but an uplifting one thanks to the small number of casualties.  The Mayor of San Francisco was quoted saying: “We’re lucky we have this many survivors.”  And the Chief of the San Francisco Fire Department said that it was “nothing short of a miracle…”  At CNN, after mentioning the two confirmed fatalities, the reporter writes, “Somehow, 305 others survived.” Sheryl Sandberg, COO of Facebook, wrote that it was a “serious moment to give thanks.”  But to whom?

Screenshot_1

There’s a kind of person who is trained to maximize survival in the case of a plane crash: the flight attendant.  Airlines don’t advertise the intense training their flight attendants receive because it reminds potential passengers that air travel is risky.  As a result, most people seriously underestimate the skills flight attendants bring on board and the dedication they have to the safety of their passengers.

Flight attendants have to learn hundreds of regulations and know the safety features of all of the aircraft in their airline’s fleet. They must know how to evacuate the plane on land or sea within 90 seconds; fight fires 35,000 feet in the air; keep a heart attack or stroke victim alive; calm an anxious, aggressive, or mentally ill passenger; respond to hijackings and terrorist attacks; and ensure group survival in the jungle, sea, desert, or arctic.

It isn’t just book learning; they train in “live fire pits” and “ditching pools.”As one flight attendant once said:

I don’t think of myself as a sex symbol or a servant. I think of myself as somebody who knows how to open the door of a 747 in the dark, upside down and in the water (source).

This is why I’m surprised to see almost no discussion of the flight attendants’ role in this “miracle.” Consider the top five news stories on Google at the time I’m writing: CNNFoxCBS, the Chicago Tribune, and USA Today.  These articles use passive language to describe the evacuation: “slides had deployed”; all passengers “managed to get off.”  When the cabin crew are mentioned, they appear alongside and equivalent to the passengers: the crash forced “dozens of frightened passengers and crew to scamper from the heavily damaged aircraft”; “passengers and crew were being treated” at local hospitals.

Only one of these five stories, at Fox, acknowledges that the 16 cabin crew members worked through the crash and its aftermath.  The story mentions that, while passengers who could were fleeing the plane, crew remained behind to help people who were trapped, slashing seat belts with knives supplied by police officers on the ground.  The plane was going up in flames; they risked their lives to save others.

I don’t know what the flight attendants on this plane did or didn’t do to minimize injuries or save lives, but I would like to know.  Instead, they are invisible in these news stories as workers, allowing readers and future passengers to remain ignorant of the skills and dedication they bring to their work.

Cross-posted at JezebelPolicyMic, Huffington Post, and BlogHer.

Lisa Wade, PhD is an Associate Professor at Tulane University. She is the author of American Hookup, a book about college sexual culture; a textbook about gender; and a forthcoming introductory text: Terrible Magnificent Sociology. You can follow her on Twitter and Instagram.

We’re celebrating the end of the year with our most popular posts from 2013, plus a few of our favorites tossed in.  Enjoy!

 You know all those badass ladies out there that are inexplicably single? Well, maybe it’s not so inexplicable.

In a study contending for most-depressing-research-of-the-year, psychologists Kate Ratliff and Shigehiro Oishi tested how a romantic partner’s success or failure affects the self-esteem of people in heterosexual relationships.  The short story: men feel bad about themselves when good things happen to their female partners.  Women’s self-esteem is unaffected.  Here’s some of the data.

The vertical axis represents self-esteem. In this experiment, respondents were told that their partner scored high on a test of intelligence (“positive feedback”) or low (“negative feedback”).  The leftmost bars show that men who were told that their partners were smart reported significantly lower self-esteem than those who heard that their partners weren’t so smart.

Screenshot_1

In the second condition, respondents were asked to imagine a partner’s success or failure.  Doing so had no effect on women’s self-esteem (rightmost bars).  For men, however, imagining their partners’ success made them feel bad about themselves, whereas imagining their failure made them feel good.Screenshot_2

The various experiments were conducted with American and Dutch college students as well as a diverse Internet sample.  The findings were consistent across populations and were particularly surprising in the context of the Netherlands, which is generally believed to be more gender egalitarian.

We’ve got a long way to go.

Cross-posted at The Huffington Post and Pacific Standard.

Lisa Wade, PhD is an Associate Professor at Tulane University. She is the author of American Hookup, a book about college sexual culture; a textbook about gender; and a forthcoming introductory text: Terrible Magnificent Sociology. You can follow her on Twitter and Instagram.

The federal minimum wage is $7.25 an hour.  Several states mandate a higher minimum wage; the state of Washington has the highest, at $9.19.

President Obama recently voiced his support for efforts to increase the minimum wage to $10.10.  The federal minimum wage was last raised in 2009 and certainly needs to be increased again.  The fact is that the federal minimum wage has not kept up with inflation.  As the New York Times graphic below shows, the current minimum wage is, when adjusted for inflation, 32% below what it was in 1968.  It is 8% below what it was in 2010.  In other words, those earning the minimum wage are suffering a real decline in income.

1

As for the appropriate value, why not $22.62?  That, as the graphic illustrates, is what the minimum wage would be if it grew at the same rate as the income of the top 1%. Alan Pyke explains:

[Such a large increase] may seem outlandish, but previous research indicates American workers have just about earned it. Worker productivity has more than doubled since 1968, and if the minimum wage had kept pace with productivity gains it would have been $21.72 last year. From 2000 to 2012 alone workers boosted their productivity by 25 percent yet saw their earnings fall rather than rise, leading some economists to label the early 21st century a lost decade for American workers.

Looked at from that perspective the current movement for a $15 hourly wage at fast food restaurants sounds reasonable.  

Martin Hart-Landsberg is a professor of economics at Lewis and Clark College. You can follow him at Reports from the Economic Front.

This 1 minute commercial for Pantene, running in the Philippines, is getting a lot of praise.  It does a powerful job of pointing out the way that women are disadvantaged in corporate contexts.  The men and women in the ad are portrayed similarly, but the women are judged for the behavior while the men are praised.

32

1Pretty neat.

But then the end.  Oh Pantene.  The answer to this systemic double bind that damns women if they do and damns them if they don’t is, apparently, to “be strong and shine.”

1

I suppose we shouldn’t expect much more from a shampoo ad, but I lament the ending anyway.  It resonates with a wider cultural trend in which feminist empowerment has been conflated with individual gain within a patriarchal system, not a collective effort to end patriarchy once and for all.

This is the lesson of Sheryl Sandberg’s Lean In: the system’s all set up to fuck you over, she acknowledges, but then she whispers: I will try to help you get to the top anyway.  No matter if you have to step all over lots of other women on the way.  That’s not feminism, that’s self-interest.  And it’s certainly not progressive change.

Thanks to @yassmin_a at Redefining the Narrative, Keely W., and Jacob R. for the link!  Cross-posted at the Huffington Post.

Lisa Wade, PhD is an Associate Professor at Tulane University. She is the author of American Hookup, a book about college sexual culture; a textbook about gender; and a forthcoming introductory text: Terrible Magnificent Sociology. You can follow her on Twitter and Instagram.

According to an article at the Wall Street Journal,  the average income for the bottom 90% of families fell by over 10% from 2002 – 2012 while the average income for families in all the top income groups grew.  The top 0.01% of families actually saw their average yearly income grow from a bit over $12 million to over $21 million over the same period.  And that is adjusted for inflation and without including capital gains.

MI-BZ607_UNEQUA_G_20131110150005

What was most interesting about the article was its discussion of the dangers of this trend and the costs of reversing it.  In brief, the article noted that many financial analysts now worry that inequality has gotten big enough to threaten the future economic and political stability of the country.  At the same time, it also pointed out that doing anything about it will likely threaten profits.  As the article notes:

But if inequality has risen to a point in which investors need to be worried, any reversal might also hurt.

One reason U.S. corporate profit margins are at records is the share of revenue going to wages is so low. Another is companies are paying a smaller share of profits on taxes. An economy where income and wealth disparities are smaller might be healthier. It would also leave less money flowing to the bottom line, something that will grab fund managers’ attention.

Any bets how those in the financial community will evaluate future policy choices?

Martin Hart-Landsberg is a professor of economics at Lewis and Clark College. You can follow him at Reports from the Economic Front.

The current economic recovery officially began June 2009 and is one of the weakest in the post-World War II period.  This is true by almost every indicator, except growth in profits.

One reason it has offered working people so little is the contraction of government spending and employment.  This may sound strange given the steady drumbeat of articles and speeches demanding a further retrenchment of government involvement in the economy, but the fact is that this drumbeat is masking the reality of the situation.

The figure shows the growth in real spending by federal, state, and local governments in the years before and after recessions.  The black line shows the average change in public spending over the six business cycles between 1948 and 1980.  Each blue line shows government spending for a different recent business cycle and the red line does the same for our current cycle.  As you can see, this expansionary period stands out for having the slowest growth in public spending.  In fact, in contrast to other recovery periods, public spending is actually declining.

government spending

According to Josh Bivens:

…public spending following the Great Recession is the slowest on record, and as of the second quarter of 2013 stood roughly 15 percent below what it would have been had it simply matched historical averages… if public spending since 2009 had matched typical business cycles, this spending would be roughly $550 billion higher today, and more than 5 million additional people would have jobs (and most of these would be in the private sector).

The basic stagnation in government spending has actually translated into a significant contraction in public employment.  This figure highlights just how serious the trend is by comparing public sector job growth in the current recovery to the three prior recovery periods.

figure21

As Josh Bivens and Heidi Shierholz explain:

…the public sector has shed 737,000 jobs since June 2009. However, this raw job-loss figure radically understates the drag of public-sector employment relative to how this sector has normally performed during economic recoveries… [P]ublic-sector employment should naturally grow as the overall population grows. Between 1989 and 2007, for example, the ratio of public employment to overall population was remarkably stable at roughly 7.3 public sector workers for each 100 members of the population. Today’s ratio is 6.9, and if it stood at the historic average of 7.3 instead, we would have 1.3 million more public sector jobs today.

In short, the challenge we face is not deciding between alternative ways to further shrink the public sector but rather of designing and building support for well financed public programs to restructure our economy and generate living wage jobs.

Martin Hart-Landsberg is a professor of economics at Lewis and Clark College. You can follow him at Reports from the Economic Front.

The Federal Reserve Bank has said it will maintain its stimulus policy as long as the economy remains weak. One of its key indicators for the strength of the economy is the unemployment rate, which has been steadily falling for several years, from 10% in October 2009 to 7.3% in August 2013.  However, this decline in the official unemployment rate gives a misleading picture of economic conditions, at least as far as the labor market is concerned.

The reason, as the Economy Policy Institute explains, is because of the large number of “missing workers.”  These missing workers are…

…potential workers who, because of weak job opportunities, are neither employed nor actively seeking a job. In other words, these are people who would be either working or looking for work if job opportunities were significantly stronger. Because jobless workers are only counted as unemployed if they are actively seeking work, these “missing workers” are not reflected in the unemployment rate.

We are seeing many more missing workers now than in recent history.  The chart below shows the Economic Policy Institute estimate for the number of missing workers.

missing workers_Page_1

 The next chart compares the estimated unemployment rate including missing workers (in orange) with the official unemployment rate (in blue).

unemployment rates_Page_1

As you can see, while the official unemployment rate continues to decline, the corrected unemployment rate remains stuck at a rate above 10%. In other words labor market conditions remain dismal. And here we are only talking about employment.  If we consider the quality of the jobs being created, things are even worse.

Martin Hart-Landsberg is a professor of economics at Lewis and Clark College. You can follow him at Reports from the Economic Front.