race/ethnicity

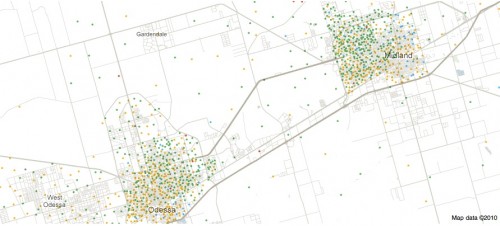
Back in September, I posted about some maps put together by Eric Fischer, using 2000 Census data, showing the racial/ethnic makeup of selected cities. As Jeff H., Eluned J., and Dmitriy T.M. pointed out, the NYT now has up an interactive map where you can see the racial/ethnic composition of any Census tract, using more updated Census Bureau data from 2005 to 2009. For instance, here’s a map of the neighboring cities of Midland and Odessa, Texas, which I picked for no reason other than that I just watched an episode of Friday Night Lights, which is set in a fictionalized version:

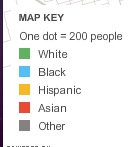
Color key:

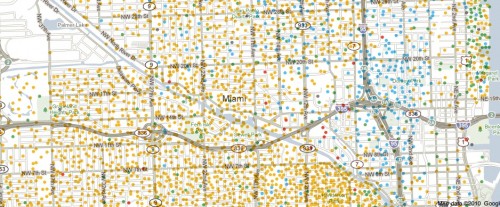
You can zoom in to get quite detailed information about individual neighborhoods. I zoomed in as far as I could on Miami (each dot now represents 50 people):

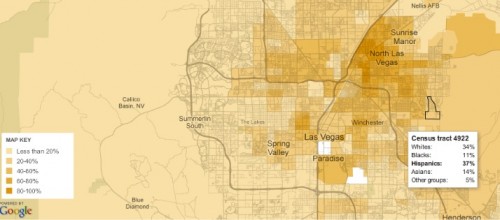
There’s also a tab that says “View More Maps.” It allows you to select to see just the distribution of Whites, Blacks, Hispanics, Asians, or the foreign-born population. Here’s the map of the Hispanic population of Las Vegas:

As you can see, if you hover over a Census tract, you can get specific data on its racial/ethnic makeup.

The foreign-born population of Seattle (if you hover over a tract, it will tell you the % foreign-born, as well as the % increase in the foreign-born population since 2000):

A great resource. Although I tried to look up my home town, and even zooming in to the smallest scale, it’s too small to have any data available.

Jordan B. sent in an interesting observation about the current advertising at Diesel.  Many of the ads feature varying skin tones, but the darker-skinned models appear to always be male, while the women appear to always be lighter-skinned.  Two ads:

Jordan thinks that Diesel is following American cultural rules that gender race and racialize gender.  For example, if I may quote myself:

According to American cultural stereotypes, black people, both men and women, are more masculine than white people. Black men are seen as, somehow, more masculine than white men: they are, stereotypically, more aggressive, more violent, larger, more sexual, and more athletic. Black women, too, as seen as more masculine than white women: they are louder, bossier, more opinionated and, like men, more sexual and more athletic.

I’ll let Jordan finish the thought:

This is why Diesel’s selection of a black man and light skinned women makes sense for their ads.  By choosing a black man, men everywhere will want to identify with the hyper-masculinity our society has attributed to them. Similarly, by choosing a light-skinned woman, Diesel is selecting the type of women our society has put on a pedestal.

For more, see our posts on asymmetry in interracial marriagehow Asian women are marketed to white men, and data on race and response rates on a dating website.

Lisa Wade, PhD is an Associate Professor at Tulane University. She is the author of American Hookup, a book about college sexual culture; a textbook about gender; and a forthcoming introductory text: Terrible Magnificent Sociology. You can follow her on Twitter and Instagram.

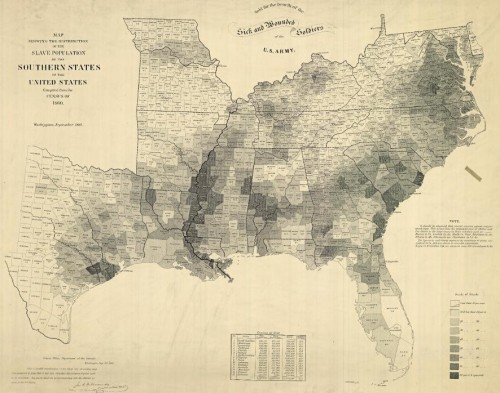
The NYT has posted an interesting interactive map showing the results of the last slave Census taken in the U.S., in 1860, which I discovered via Jessica Brown and Jim Yocom. The map, which shows county-level data, illustrates how slave ownership varied throughout the South

The shading (a new technique at the time, according to the NYT article) indicates what percent of the entire county’s population was enslaved:

You can see the percentage for each county, which is listed on the map, more easily if you zoom in on the pdf version. The cotton-belt area along the Mississippi River clearly stands out, as does Beaufort County, South Carolina, all with over 80% of the population enslaved. The highest rate I could pick out (the map got a little blurry as I zoomed) is in Issaquena County, Mississippi, where slaves appear to have made up 92.5% of the population.

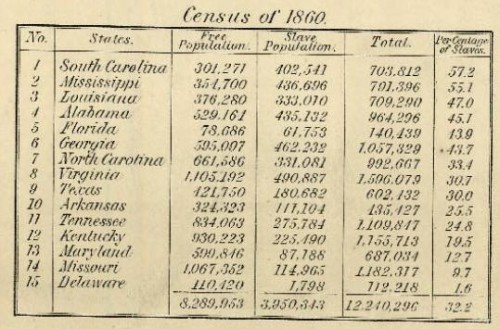
The map also included information on the overall population and % enslaved at the state level; in South Carolina and Mississippi, over half of the total state population was made up of slaves:

Also check out Lisa’s post on geology, the economy, and the concentration of slavery in the U.S.

As the NYT post points out, the map doesn’t show the dramatic increases in slavery in some areas. For instance, while Texas ranked fairly low in terms of the overall slave population, the number of slaves in the state had tripled between 1850 and 1860. The number had doubled in Mississippi between 1840 and 1860. Those growth rates make it rather hard to swallow the argument sometimes presented by those romanticizing the Confederacy that slavery was actually on the wane and would have soon been ended in the South anyway, without any need for federal interference, and wasn’t why the South seceded at all.

Jon Stewart and Larry Wilmore discussed this effort to frame discourses about the Civil War to erase the issue of slavery on The Daily Show:

Allegra K. suggested that we take a look at Palin-based pro-conservative message from PalinPAC for this past November’s election. The nearly-two-minute commercial is an excellent example of a gender-specific populism. We recently discussed populism in response to Christine O’Donnell’s “I’m Not a Witch, I’m You” commercial.  Populism is, by definition, in opposition to elitism.  Political populists believe that the average person is better suited to lead than the exceptional person.  In this ad, Palin attempts to personify not just the average person, but the average mom.  Allegra writes:

Throughout the video, numerous women are pictured. However, they are a specific type: they are the “real” women; not models, or especially good-looking, dressed up, or even business or political figures. They are “average moms”…

The average woman, according to Palin, is the American hockey mom (just like her), who is (supposedly) middle class, an at-home mom, who cooks and cleans, takes her multiple children to school, and then to after school sports, probably drives a mini van, and uses Clorox on her sons’ jerseys after they get muddy at practice.  Palin puts the power of change in their hands because, she says, “moms just kinda know when somethin’s wrong.”

A “just kinda know” kind of knowledge (based on the notion of female intuition) is a great example of Palin’s gendered populist message.

Lisa Wade, PhD is an Associate Professor at Tulane University. She is the author of American Hookup, a book about college sexual culture; a textbook about gender; and a forthcoming introductory text: Terrible Magnificent Sociology. You can follow her on Twitter and Instagram.

Tim Wise answers just this question in this 2 1/2 minute clip featured on his website.  Sneak peak: His answer begins with “No. You should feel angry.”

Laurie J graciously pasted the transcript in the comments; I’ve added it after the jump.

more...


For years biologists, anthropologists, and sociologists have all agreed that racial categories are social constructs.  Recently, however, new genetic information about human evolution has required that scientists re-think the biological reality of race.  In this 6-minute video, sociologist Alondra Nelson describes this re-thinking:

Lisa Wade, PhD is an Associate Professor at Tulane University. She is the author of American Hookup, a book about college sexual culture; a textbook about gender; and a forthcoming introductory text: Terrible Magnificent Sociology. You can follow her on Twitter and Instagram.

Prolific sender-inner Dmitriy T.M. sent in a link to a story at Slate showing increases in rates of U.S. adults of diabetes between 2004 and 2008, as well as the distinct regional variations. You can look at maps individually or watch a time-lapse slide show.

Percent of adults diagnosed with diabetes in 2004:

2008:

The change is pretty dramatic for such a short time period. I presume differences in poverty rates, access to health care, and nutritional differences all play a part. Any demographers or public health scholars out there with insights?

The CDCP has the data available for download, and you can play around with different maps (# of adults instead of % and so on).

UPDATE: Reader Arielle says,

Please clarify the type of diabetes this graph is discussing (I assume it’s Type 2). As it stands, you’re perpetuating two myths: one, that all types of diabetes are affected by “poverty rates, access to health care, and nutritional differences” (Type 1 is an autoimmune disease and has nothing to do with lifestyle), and two, that only children are diagnosed with (or have) Type 1 diabetes.

Here’s a problem: neither the CDCP nor the Salon Slate article specify. They say “adult diabetes,” meaning individuals over the age of 18 who are diagnosed with diabetes (so not necessarily adult onset diabetes). I think that would mean either Type 1 or Type 2. But I’d take the data with a little caution since the source doesn’t make that absolutely clear.

UPDATE 2: Chris points out an important element of what might be going on here:

More significantly one of the comments on Slate (not Salon) said that the diagnostic standard for diabetes recently dropped from 140 to 124.  That’s going to add a LOT of people to the second map if the transition occurred between 2004 and 2008.

That would make a lot of sense, because quite honestly, I just couldn’t figure out how the overall numbers had increased so rapidly in just 4 years. This is a great example of the social construction of health and disease: we are constantly defining and redefining what does and doesn’t count as unhealthy, which can dramatically affect statistics on the topic without there necessarily being a large change in the overall state of the population.

After Gwen posted her fascinating discussion of the way that people who are reliant on public transportation are inconvenienced or isolated (based on photos sent in by Lynne Shapiro), David F. sent a link to an article in The Columbus Dispatch about the public transportation in downtown Columbus.   Downtown developers, it reports, oppose a plan by the Central Ohio Transit Authority (COTA) to build a transfer station.  The reporter writes:

Downtown developers have complained that COTA passengers waiting for transfers near Broad and High streets, and buses lining the curbs make the area less attractive for retail stores and their customers.

Translation: no one wants to see buses and the people who ride them.

Because, you see, when the buses stop there, those kind of people are there waiting for the bus:

(Image at Google)

One of these developers, Cleve Ricksecker, explains:

Transit-dependent riders who are going through Downtown, for whatever reason, don’t shop… Large numbers of people waiting for a transfer can be intimidating for someone walking down the sidewalk.

Translation: People who buy things want to be protected from knowing about and interacting with people who are too poor to buy things.

Much better to make life more difficult for people who ride the bus.

Lisa Wade, PhD is an Associate Professor at Tulane University. She is the author of American Hookup, a book about college sexual culture; a textbook about gender; and a forthcoming introductory text: Terrible Magnificent Sociology. You can follow her on Twitter and Instagram.