politics

In general, married couples are homogamous.  That is, they are more likely than not to match on a whole host of characteristics: age, income, education level, race, religion, immigration history, attractiveness level, and more.

But, does homogamy really translate into compatibility?  Or, do we just think it does?

OKCupid set about to find out.  This is the second of two posts about recent revelations that they, like Facebook, have been doing experiments on users. The last one was a depressing look at the role of attractiveness on the site. This one is about the impact of match ratings.  Yep, they lied to see what would happen.

OkCupid users answer a series of questions and the site then offers a “match rating” between any two users.  The idea is that people with a higher match rating are more homogamous — by some measure not identical to those that sociologists typically use, to be clear — and, therefore, more likely to get along.

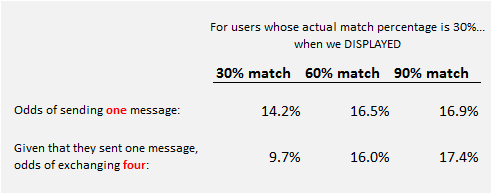
The first thing they did was artificially alter the match rating for couples whose true match was only 30%.  Users could read the profile, look at the pictures, reviews answers to questions, and see a match rating.  In other words, they had a lot of information and one summary statistic that might be true or false.

People were slightly more likely to send a message and continue a conversation  if they thought they were a 60% match or better.  This is interesting since all these couples were poorly matched and it shouldn’t have been too difficult to discover that this was so.

1

Rudder’s interpretation of the data is that you can make two people like each other by just telling them that they should.

Or maybe, he considered, their algorithm was just terrible. So, they took couples who matched at the 30, 60, and 90% rating and displayed a random match rating that was wrong two-thirds of the time.  Then, they waited to see how many couples got to exchanging four messages (their measure of a “conversation”).

2

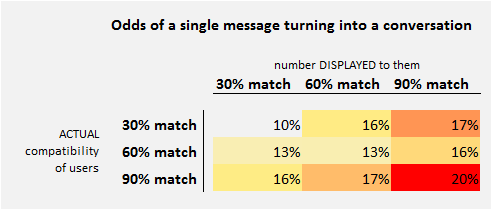
The lower right corner suggests that the ideal situation is to be a good match and know it.  Likewise, if you’re a bad match and you know it things probably won’t get very far. But the difference between actually being a good match and just thinking you are isn’t as big as we might think it would be.  At least, not in the space of four messages.

So, does homogamy really translate into compatibility?  Or, do we just think it does?  Maybe a little of both.

Cross-posted at Pacific Standard.

Lisa Wade, PhD is an Associate Professor at Tulane University. She is the author of American Hookup, a book about college sexual culture; a textbook about gender; and a forthcoming introductory text: Terrible Magnificent Sociology. You can follow her on Twitter and Instagram.

Citing the immigration scholar, Francesca Pizzutelli, Fabio Rojas explains that the phrase “illegal immigrant” wasn’t a part of the English language before the 1930s.  More often, people used the phrase “irregular immigrant.”   Instead of an evaluative term, it was a descriptive one referring to people who moved around and often crossed borders for work.

1

Rojas points out that the language began to change after anti-immigration laws were passed by Congress in the 1920s.  The graph above also reveals a steep climb in both “illegal immigrant” and “illegal alien” beginning in the ’70s.

Lisa Wade, PhD is an Associate Professor at Tulane University. She is the author of American Hookup, a book about college sexual culture; a textbook about gender; and a forthcoming introductory text: Terrible Magnificent Sociology. You can follow her on Twitter and Instagram.

We refer to Senators and Congressional representatives as “lawmakers.” We democratically elect these people so that they can write and enact laws. But every so often the curtain parts, and we get a glimpse of who’s writing the laws, though these are usually laws that don’t make headlines. There was that time during the Bush years when corporate lobbyists were sitting right next to elected representatives — mostly Republican — at a committee hearing, telling them what to say.  The GOP defenders got all huffy at those who had pointed out who was really running the legislation show.

Last week’s New York Times has an article (here) about efforts to close loopholes in corporate tax laws.  Three-quarters of the way through the story, we get this paragraph (emphasis added):

Elaine C. Kamarck, the co-chairwoman of a bipartisan coalition of businesses and organizations that support a tax overhaul, says the only way a tax bill will pass is to use any savings derived from closing corporate loopholes solely to lower the overall corporate tax rate. The companies that have joined the coalition, which include Boeing, AT&T, Verizon, Walmart and Walt Disney, have agreed to put every loophole on the table, she said, because they believe “a low enough basic tax rate is worth giving up exemptions.”

The message is clear: our elected representatives can change the law only if a handful of corporations agree. Ms. Kamarck tells us that these corporations have selflessly allowed their tax dodges to be put “on the table.” Presumably, had they not been so magnanimous,  these corporations would not allow Congress to change the law.  She also implies that if the tradeoff — fewer exemptions but lower rates — doesn’t benefit the corporations, they’ll take their loopholes off the table and stop our elected representatives from changing the law.

Nice. I think that educators are so valuable to society that their income should not be taxed. But that table Ms. Kamarck mentions — the one where you tell Congress which tax rules you’ll accept — I can’t get anywhere near it.  So I pay my taxes. In fact, last year, I paid more in taxes than did Verizon and Boeing combined.  They, and several other huge corporations, paid zero.

I am, of course, naive to think that it was really Congress that wrote the laws that allow these corporations to pay nothing, and not the corporations themselves. How else?

Jay Livingston is the chair of the Sociology Department at Montclair State University. You can follow him at Montclair SocioBlog or on Twitter.

According to the Stockholm International Peace Institute, the United States remains the world’s top military spender. In fact, U.S. military spending equals the combined military spending of the next ten countries.  And most of those are U.S. allies.

1 (2) - Copy

Although declining in real terms, the U.S. military budget remains substantial and a huge drain on our public resources.  As the following chart shows, military spending absorbs 57% of our federal discretionary budget.

1 (2)

 Notice that many so-called non-military discretionary budget categories also include military related spending. For example: Veteran’s Benefits, International Affairs, Energy and the Environment, and Science.   We certainly seem focused on a certain kind of security.

Martin Hart-Landsberg is a professor of economics at Lewis and Clark College. You can follow him at Reports from the Economic Front.

This year tens of thousands of Central American children, fleeing violence and poverty, have been arriving in the U.S. seeking refuge.  It’s a stunning story that has been covered widely in the media and Americans’ opinions about immigration have taken a hit.

The Pew Research Center collected data regarding American leniency toward undocumented immigrants in February and July, before and after media coverage of this crisis began.  The results show that members of all political parties, on average, are less inclined to allow “immigrants living in U.S. who meet certain requirements” to stay legally (see far right column).

The strongest opponents are Republicans and members of the Tea Party.  These groups were more opposed to enabling undocumented immigrants to stay legally to begin with and they showed the greatest change in response to this new crisis.

1

Republicans and Independents are also more likely than Democrats to think that we should speed up the deportation process, even if it means deporting children who are eligible for asylum.

2

Lisa Wade, PhD is an Associate Professor at Tulane University. She is the author of American Hookup, a book about college sexual culture; a textbook about gender; and a forthcoming introductory text: Terrible Magnificent Sociology. You can follow her on Twitter and Instagram.

There is one similarity between the Israel/Gaza crisis and the U.S. unaccompanied child immigrant crisis: National borders enforcing social inequality. When unequal populations are separated, the disparity creates social pressure at the border. The stronger the pressure, the greater the military force needed to maintain the separation.

To get a conservative estimate of the pressure at the Israel/Gaza border, I compared some numbers for Israel versus Gaza and the West Bank combined, from the World Bank (here’s a recent rundown of living conditions in Gaza specifically). I call that conservative because things are worse in Gaza than in the West Bank.

Then, just as demographic wishful thinking, I calculated what the single-state solution would look like on the day you opened the borders between Israel, the West Bank, and Gaza. I added country percentiles showing how each state ranks on the world scale (click to enlarge).

1

Israel’s per capita income is 6.2-times greater, its life expectancy is 6 years longer, its fertility rate is a quarter lower, and its age structure is reversed. Together, the Palestinian territories have a little more than half the Israeli population (living on less than 30% of the land). That means that combining them all into one country would move both populations’ averages a lot. For example, the new country would be substantially poorer (29% poorer) and younger than Israel, while increasing the national income of Palestinians by 444%. Israelis would fall from the 17th percentile worldwide in income, and the Palestinians would rise from the 69th, to meet at the 25th percentile.

Clearly, the separation keeps poor people away from rich people. Whether it increases or decreases conflict is a matter of debate.

Meanwhile

Meanwhile, the USA has its own enforced exclusion of poor people.

3
Photo of US/Tijuana border by Kordian from Flickr Creative Commons.

The current crisis at the southern border of the USA mostly involves children from Guatemala, Honduras, and El Salvador. They don’t actually share a border with the USA, of course, but their region does, and crossing into Mexico seems pretty easy, so it’s the same idea.

To make a parallel comparison to Israel and the West Bank/Gaza, I just used Guatemala, which is larger by population than Honduras and El Salvador combined, and also closest to the USA. The economic gap between the USA and Guatemala is even larger than the Israeli/Palestinian gap. However, because the USA is 21-times larger than Guatemala by population, we could easily absorb the entire Guatemalan population without much damaging our national averages. Per capita income in the USA, for example, would fall only 4%, while rising more than 7-times for Guatemala (click to enlarge):

4

This simplistic analysis yields a straightforward hypothesis: violence and military force at national borders rises as the income disparity across the border increases. Maybe someone has already tested that.

The demographic solution is obvious: open the borders, release the pressure, and devote resources to improving quality of life and social harmony instead of enforcing inequality. You’re welcome!

Cross-posted at Family Inequality.

Philip N. Cohen is a professor of sociology at the University of Maryland, College Park, and writes the blog Family Inequality. You can follow him on Twitter or Facebook.

Flashback Friday.

I have borrowed the information and images below from Jeff Fecke at Alas A Blog.  His discussion, if you’re interested, is more in depth.

There is a winding line of counties stretching from Louisiana to South Carolina, a set of states that largely voted for McCain in 2008, that went for Obama.  The map below shows how counties voted in blue and red and you can clearly see this interesting pattern.


These counties went overwhelmingly for Obama in part because there is large black population.  Often called the “Black Belt,” these counties more so than the surrounding ones were at one time home to cotton plantations and, after slavery was ended, many of the freed slaves stayed.  This image nicely demonstrates the relationship between the blue counties and cotton production in 1860:


But why was there cotton production there and not elsewhere?  The answer to this question is a geological one and it takes us all the way back to 65 million years ago when the seas were higher and much of the southern United States was under water.  This image illustrates the shape of the land mass during that time:

I’ll let Jeff take it from here:

Along the ancient coastline, life thrived, as usually does. It especially thrived in the delta region, the Bay of Tennessee, if you will. Here life reproduced, ate, excreted, lived, and died. On the shallow ocean floor, organic debris settled, slowly building a rich layer of nutritious debris. Eventually, the debris would rise as the sea departed, becoming a thick, rich layer of soil that ran from Louisiana to South Carolina.

65 million years later, European settlers in America would discover this soil, which was perfect for growing cotton.

So there you have it: the relationship between today’s political map, the economy, and 65 million years ago.

Lisa Wade, PhD is an Associate Professor at Tulane University. She is the author of American Hookup, a book about college sexual culture; a textbook about gender; and a forthcoming introductory text: Terrible Magnificent Sociology. You can follow her on Twitter and Instagram.

When my primary care physician, a wonderful doctor, told me he was retiring, he said, “I just can’t practice medicine anymore the way I want to.” It wasn’t the government or malpractice lawyers. It was the insurance companies.

This was long before Obamacare.  It was back when President W was telling us that “America has the best health care system in the world”; back when “the best” meant spending twice as much as other developed countries and getting health outcomes that were no better and by some measures worse. (That’s still true).

Many critics then blamed the insurance companies, whose administrative costs were so much higher than those of public health care, including our own Medicare. Some of that money went to employees whose job it was to increase insurers’ profits by not paying claims.  Back then we learned the word “rescission”  — finding a pretext for cancelling the coverage of people whose medical bills were too high.   Insurance company executives, summoned to Congressional hearings, stood their ground and offered some misleading statistics

None of the Congressional representatives on the committee asked the execs how much they were getting paid. Maybe they should have.

Health care in the U.S. is a $2.7 trillion dollar business, and the New York Times has an article about who’s getting the big bucks.  Not the doctors, it turns out.  And certainly not the people who have the most contact with sick people — nurses, EMTs, and those further down the chain.  Here’s the chart from the article, with an inset showing those administrative costs.

1

As fine print at the top of the chart says, these are just salaries — walking-around money an exec gets for showing up.  The real money is in the options and incentives.

In a deal that is not unusual in the industry, Mark T. Bertolini, the chief executive of Aetna, earned a salary of about $977,000 in 2012 but a total compensation package of over $36 million, the bulk of it from stocks vested and options he exercised that year.

The anti-Obamacare rhetoric has railed against a “government takeover” of medicine. It is, of course, no such thing. Obama had to remove the “public option”; Republicans prevented the government from fielding a team and getting into the game. Instead, we have had an insurance company takeover of medicine. It’s not the government that’s coming between doctor and patient, it’s the insurance companies. Those dreaded “bureaucrats” aren’t working for the government of the people, by the people, and for the people. They’ve working for Aetna and Well-Point.

Even the doctors now sense that they too are merely working for The Man.

Doctors are beginning to push back: Last month, 75 doctors in northern Wisconsin [demanded] . . . health reforms . . . requiring that 95 percent of insurance premiums be used on medical care. The movement was ignited when a surgeon, Dr. Hans Rechsteiner, discovered that a brief outpatient appendectomy he had performed for a fee of $1,700 generated over $12,000 in hospital bills, including $6,500 for operating room and recovery room charges.

That $12,000 tab, for what it’s worth, is slightly under the U.S. average.

Cross-posted at Pacific Standard.

Jay Livingston is the chair of the Sociology Department at Montclair State University. You can follow him at Montclair SocioBlog or on Twitter.