nation: Mexico

Dolores R. sent in a flubbed opportunity to represent Mexicans positively and reach out to the expanding Mexican market in the U.S.  In “honor” of Cinco de Mayo, Mike’s Hard Lemonade hired five men —  in fake mustaches and sombreros — to pretend to be a Mariachi band.  They then improvised songs in response to submissions from viewers.  The stunt is self-conscious, along the lines of the “ironic” “hipster racism” we now see so much of.

The fake band may have been making fun of themselves, but they did so by engaging in something that they had already decided was ridiculous, Mariachi music.  Happy Cinco de Mayo, everyone.

A better approach, Latino Rebels suggests, would have been to spotlight some of the actual awesome Mariachi music out there.  They wouldn’t have even had to be traditional.  They could have hired a real band to improvise, or they could have drawn on the existing Mariachi cover bands, bands that do really neat stuff!  Here’s, for example, is a band covering Hotel California:

Lisa Wade, PhD is an Associate Professor at Tulane University. She is the author of American Hookup, a book about college sexual culture; a textbook about gender; and a forthcoming introductory text: Terrible Magnificent Sociology. You can follow her on Twitter and Instagram.

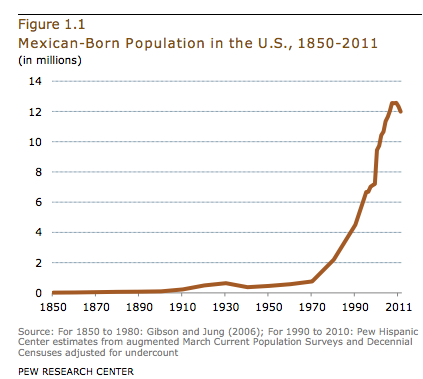
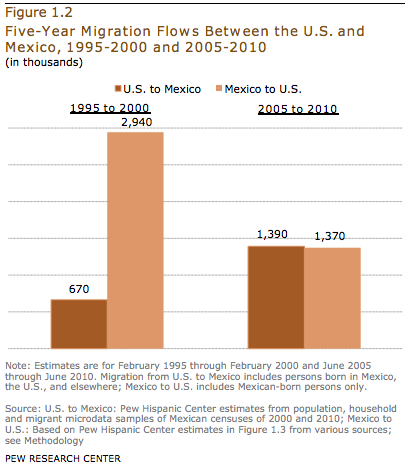
The Pew Hispanic Center has released a new report on trends in migration from Mexico. For the first time in 40 years, immigration from Mexico has slowed:

This is a notable change, as Mexican immigration has been the single largest immigrant flow to the U.S. form a single country, in overall numbers (though in the late 1800s, German and Irish immigrants made up a larger percent of all immigrants annually than Mexicans make up today). The report attributes this change to a range of factors, from changing economic conditions in Mexico, the recession’s effects on the U.S. economy, border enforcement, and the dangers of border crossings.

Indeed, we may now be seeing more people moving from the U.S. to Mexico than vice versa:

The change is due primarily to a drop in undocumented immigration, which peaked around 2007 and has dropped off significantly since:

There’s a lot more information available on changes in border enforcement and socio-economic changes in Mexico, so check out the full report.

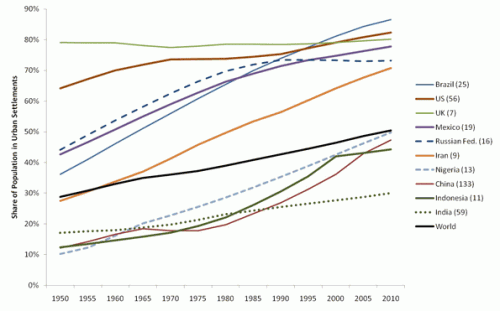
Urban Demographics posted some graphs from the UN’s State of the World’s Cities 2010/2011 report on global urbanization trends. A snapshot of urbanization in 11 countries:

You can see a few other notable trends here that illustrate various national trajectories, as Phil McDermott at Cities Matter points out. For instance, notice that while Russia underwent rapid urbanization between 1950 and 1980, it has leveled off since then. Similarly, Indonesia’s urbanization slowed significantly in the late ’90s and has continued at a much slower pace since then. We also see quite different patterns between the world’s two most populous nations: While China’s urbanization rate sped up in the early ’90s (after urbanization actually dipped in the ’70s), India has experienced fairly slow urbanization.

Credit Suisse released a report on urbanization and emerging markets, if you’re interested in the impacts of urbanization on a wide array of economic development indicators, from electricity and steel consumption to projections of future housing needs to incomes and standards of living.

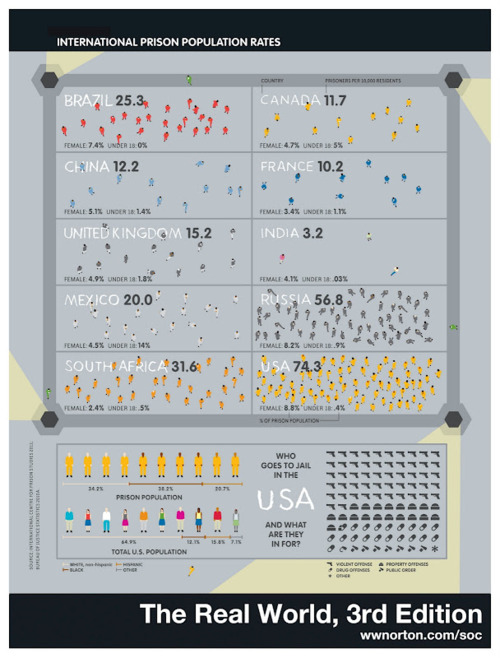
Norton Sociology recently posted an image that illustrate differences in rates of imprisonment in a number of countries. Imprisonment rates are influenced by a number of factors — what is made illegal, how intense law enforcement efforts are, preference for prison time over other options, etc. The U.S. does not compare favorably, with 74.3 per 100,000 10,000 of our population behind bars (click here for a version you can zoom in on, and sorry for the earlier typo!):

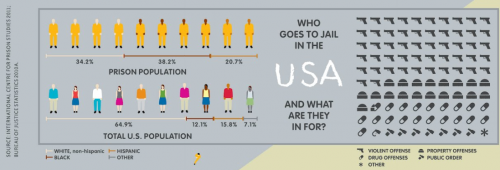
Here’s a close-up of the breakdown of the U.S. prison population:

Via Urban Demographics.

UPDATE:  Since posting this, I’ve discovered that the numbers do not accurately reflect the ratio of CEO vs. worker pay.  Writes PolitiFact:

We don’t doubt the chart’s underlying point that the ratio of CEO pay to worker pay is high in the United States, and is likely higher in our free-wheeling economy than it is in the historically more egalitarian nations of Europe.

But in its claim that the U.S. ratio is 475 to 1, the chart conveys a sense of certitude and statistical precision that simply isn’t warranted — and which is contradicted by the facts. The latest number for the U.S. is 185 to 1 in one study and 325 to 1 in another [though in previous years, those ratios have reached as high as 525 to 1] — and those numbers were not generated by groups that might have an ideological interest in downplaying the gaps between rich and poor. We rate the claim on the U.S. ratio False.

I apologize for not vetting this more carefully.

H/T KeepYourHopesUpHigh via GlobalSociologyBlog.

Lisa Wade, PhD is an Associate Professor at Tulane University. She is the author of American Hookup, a book about college sexual culture; a textbook about gender; and a forthcoming introductory text: Terrible Magnificent Sociology. You can follow her on Twitter and Instagram.
How does the U.S. compare to other developed countries on measures of social justice? According to the New York Times, not very well.  The visual below compares countries’ poverty rates, poverty prevention measures, income inequality, spending on pre-primary education, and citizen health.  The “overall” rating is on the far left and the U.S. ranks 27th out of 31.


Via Feministing.  See also how the U.S. ranks on measures of equality and prosperity(33 out of 33, for what it’s worth). Thanks to Dolores R. for the link!

Lisa Wade, PhD is an Associate Professor at Tulane University. She is the author of American Hookup, a book about college sexual culture; a textbook about gender; and a forthcoming introductory text: Terrible Magnificent Sociology. You can follow her on Twitter and Instagram.
Cross-posted at Jezebel.

Yesterday I posted about U.S. immigration trends, updated through 2010. Following up on that, Dolores R. found another immigration-related post by KPCC…this time, a look at the wait time to get a family-sponsored immigration visa. With the removal of strict, racialized quotas in 1965, the U.S. turned to a policy based on a set of priorities for deciding who would be granted a visa; among the various categories was a preference for those who had sponsoring relatives already living in the U.S., with different visas and priorities based on family relationship:

  • F1 = unmarried adult children of U.S. citizens
  • F2A = spouses and children (under age 21) of permanent residents
  • F2B = unmarried adult children of permanent residents
  • F3 = married adult children of U.S. citizens
  • F4 = siblings of adult U.S. citizens

According to the U.S. State Department, the annual minimum family-reunification visa target is 226,000 (note that this excludes spouses, parents, and minor children of U.S. citizens, who are highest priority for immigration and are exempt from immigration caps). The Immigration and Naturalization Act requires that family-sponsorsed (as well as employer-sponsored) visas be granted in the order that eligible potential immigrants applied. Unsurprisingly, many years there are more eligible applicants than there are available visas, leading to a backlog of individuals who qualify to immigrate but are waiting for a visa to become available. In particular, China, Mexico, India, and the Philippines are “oversubscribed,” meaning there is a significant backlog.

How long? The table below shows the cut-0ff date for visa applicants in each category as of January 2012. That is, the dates given here are the date by which a person had to apply to finally have a visa available this month; the 2nd column shows for all areas excluding the four countries singled out because of their particularly long wait times:

The least oversubscribed visa category is the F2A, where those now receiving visas will have waited a bit under 3 years. But look at some of the other dates listed. For F1, F2B, and F3 visas from Mexico, the people now at the head of the line have been waiting nearly two decades, having applied in 1992 or early 1993. F4 applicants from the Philippines have been waiting almost a quarter century, since 1988.

This is part of the reason why undocumented immigration continues, and arguments about fairness and waiting their turn in line may not be particularly compelling to individuals who want to reunite with family members in the U.S. Waiting a year, or two, or five, may seem reasonable. If you learn there’s a 20-year wait, the cost/benefit analysis of whether to wait for the visa to come through or to find other means may shift significantly, regardless of how otherwise law-abiding a person might be.

Yesterday we posted about an effort to raise consciousness about racist costumes.  Those who celebrate Dia de los Muertos are similarly frustrated about people who appropriate the traditions of the holiday, celebrated in Mexico, Guatemala, Ecuador, California, and Arizona.

Not just another name for Halloween, Dia de los Muertos is a two day celebration honoring children and family members who have passed.  Nuestra Hermana explains:

On these days, altars are made in honor of them. People build them on their loved ones graves, at home or anywhere they find rightful to honor their loved ones. They make ofrendas (offerings) to the dead of their favorite foods, toys (for children), pictures, pan de muertos, sugar skulls and many other things that help guide the spirits of the dead safely to the altars. Marigolds, known as the flowers of the dead, are usually prominent in the altars.

In Mexico, many people sleep overnight at the graves. Every ritual & altar is not the same everywhere. Many places have their own traditions and ways of honoring the dead. One thing is for sure, Dia De Los Muertos is not Halloween. It is a sacred time and holiday for Latin@s everywhere.

Hermana implores readers not to borrow imagery or traditions from Dia de los Muertos just for fun.  To do so, she argues, is “disrespectful… [and] also a erasure of someone’s real life culture.”

“Day of the Dead” (and other offensive Mexican stereotype costumes) from Costume Craze:

Thanks to Dolores R. for the tip!

Lisa Wade, PhD is an Associate Professor at Tulane University. She is the author of American Hookup, a book about college sexual culture; a textbook about gender; and a forthcoming introductory text: Terrible Magnificent Sociology. You can follow her on Twitter and Instagram.