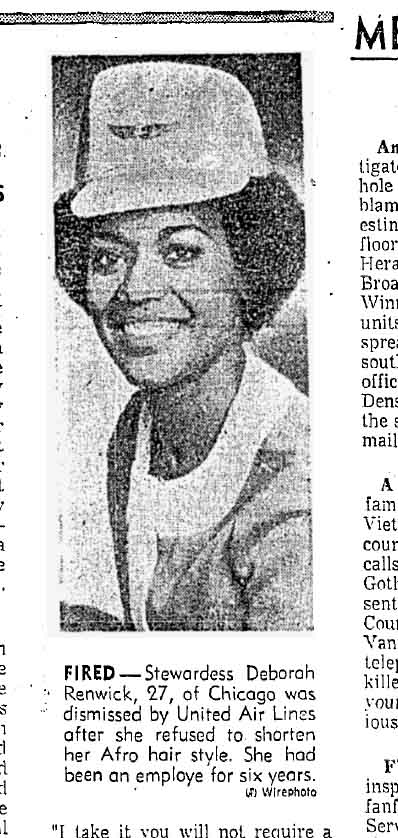
Larry Harnisch, of the Daily Mirror, who spends a lot of time at his job going through the L.A. Times‘ archives, found this story from 1969:
1969_0925_afro

Of course, most airlines had strict requirements for flight attendants’ physical appearance, including weight limits and guidelines for hair and makeup. But Renwick argued that her hair was much shorter than many White flight attendants’ hair. Many in the African American community felt she was being punished not for the length of her hair, but for wearing it in a natural style instead of straightening it.  United eventually paid her $5,000, “endors[ed] the Afro hairstyle,” and offered her her job back, and offer she did not accept.

Also check out our recent post on Chris Rock’s documentary Good Hair.

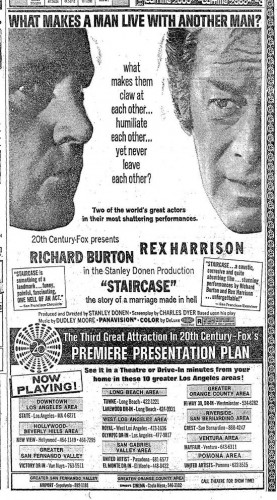
In a completely unrelated post, I found this advertisement for the movie Staircase on Larry’s blog:
6a00d8341c630a53ef0120a5e9f396970c-550wi

Text:

What makes a man live with another man? What makes them claw at each other…humiliate each other…yet never leave each other?

Under the title “Staircase” it says “the story of a marriage made in hell.” Larry says, “Rex Harrison and Richard Burton play two hairdressers who live together…”

Larry’s post also includes a review from September 26, 1969, that contains the following memorable phrases (the image is too small to read if I post it here, so click over to Larry’s post to see it):

…a pair of querulous old queans [sic]

They are bitchiness itself…

…two failed half-men…

…the boys’ ghastly mothers…

…what, with the deepest of ironies, is called the gay world.

That’s something else, eh?

Max shoes advertises its sturdy laces with sexualized and racialized violence in this Swiss ad:

tumblr_kq99filXUo1qa2j4ro1_400

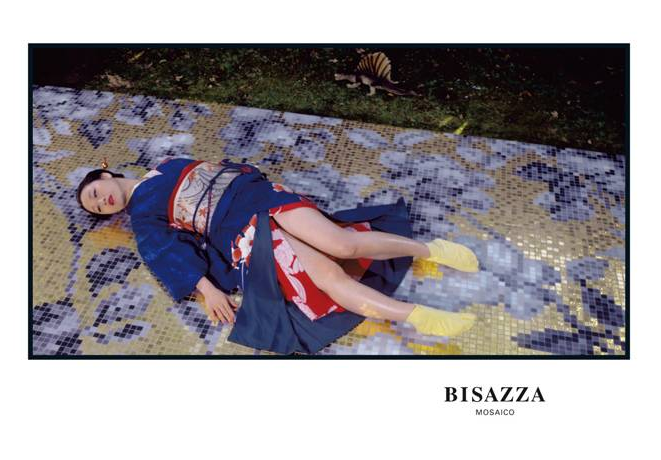
NEW! Penny R. sent in these ads for Bisazza tiles.  They were banned in England, but she saw them in a waiting room in the U.S. in a magazine called Wallpaper:Bisazza1Bisazza2Both via Copyranter (here and here).

—————————

Lisa Wade is a professor of sociology at Occidental College. You can follow her on Twitter and Facebook.

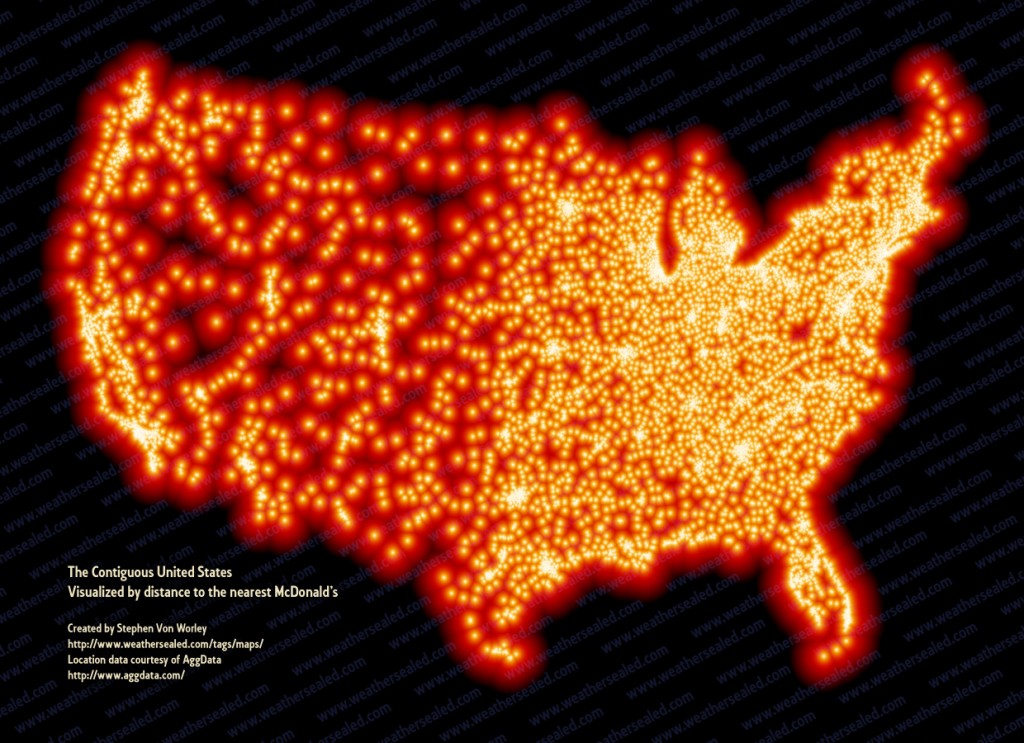
Behold “a visualization of the contiguous United States, colored by distance to the nearest [of the about 13,000] domestic McDonald’s” developed by Stephen Von Worley at Weather Sealed:

mcd_us_high

Von Worley writes:

As expected, McDonald’s cluster at the population centers and hug the highway grid.  East of the Mississippi, there’s wall-to-wall coverage, except for a handful of meager gaps centered on the Adirondacks, inland Maine, the Everglades, and outlying West Virginia.

For maximum McSparseness, we look westward, towards the deepest, darkest holes in our map: the barren deserts of central Nevada, the arid hills of southeastern Oregon, the rugged wilderness of Idaho’s Salmon River Mountains, and the conspicuous well of blackness on the high plains of northwestern South Dakota.  There, in a patch of rolling grassland, loosely hemmed in by Bismarck, Dickinson, Pierre, and the greater Rapid City-Spearfish-Sturgis metropolitan area, we find our answer.

Between the tiny Dakotan hamlets of Meadow and Glad Valley lies the McFarthest Spot: 107 miles distant from the nearest McDonald’s, as the crow flies, and 145 miles by car!

Suffer a Big Mac Attack out there, and you’re hurtin’ for certain!

Via a blog I’ve been borrowing a lot from lately, Chart Porn.

—————————

Lisa Wade is a professor of sociology at Occidental College. You can follow her on Twitter and Facebook.


Alicja W. told me about this Barbie commercial from 1959 (which may be the first Barbie TV commercial, but I’m not positive about that) in which girls are encouraged to identify with, and aspire to, Barbie’s charm and beauty:

It’s not just that Barbie is fun to play with; she’s overtly presented here as a role model for girls, who can dream of someday being “exactly like” her–petite, popular (“at parties she will cast a spell”), and beautiful. And until they can actually become that person, they can “make believe” they’re Barbie. It’s a great example of how toys can be an important part of childhood socialization. In this case, it’s not just a set of behaviors girls were encouraged to mimic (caring for a doll, for instance); the toy is presented as something they should actually aspire to be.

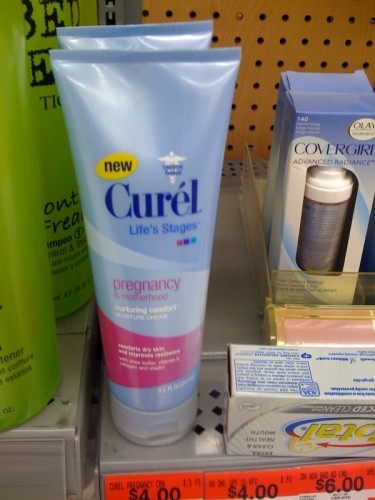
The other day I snapped a photo of this lotion I saw for sale at the grocery store:

lotion

We’ve often posted on pointlessly gendered products. This, as far as I can tell, is a pointlessly pregnancy-related product. I couldn’t see a thing about it that was different than other versions of the same brand except that it says it’s for the life stage “pregnancy & motherhood.” If it at least said something about stretch marks that would make some sense, but it didn’t. On the back it just referred to dry skin and being formulated for a pregnant woman’s “special needs,” which were entirely unspecified, as was the way in which this bottle of lotion could address them.

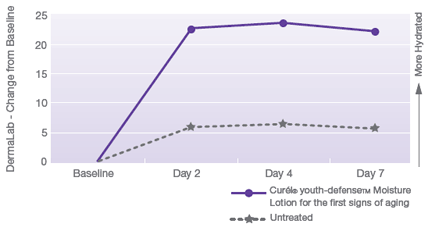
I went to the Curél website to see what other life stages they identify. The website at least mentions stretch marks for the pregnancy/motherhood formula, so that’s an effort to pretend there’s a point to it. There were two more types: “first signs of aging” and “menopause and beyond.” A chart showing the effectiveness of the anti-aging lotion:

aging_chart1

Of course, we have no idea what the baseline is, and while I presume the y-axis is %, it doesn’t actually say that. And apparently all women were going through a reverse-aging process that week, since even the untreated ones had a positive change.

So apparently women get to look forward to three stages, all of which have unique hydration needs: you have a baby, you notice signs of aging, and then you’re old. I have so much to look forward to.

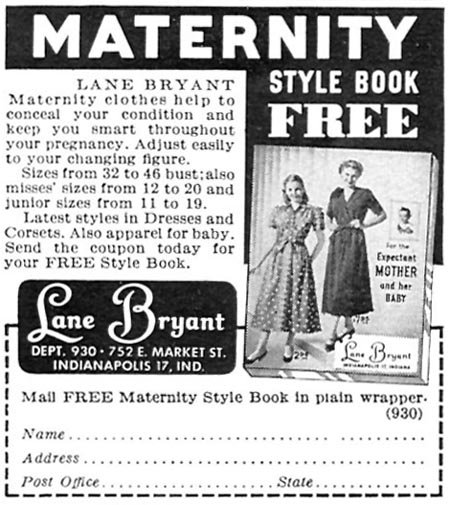
Putting into stark contrast today’s push to look fashionable while pregnant (as well as the fact that pregnancy is in fashion), this vintage ad markets the ability of maternity wear to conceal your pregnancy:

laneday090119491062e7fc

Selected text:

Maternity clothes help to conceal your condition and keep you smart throughout your pregnancy. Adjust easily to your changing figure.

—————————

Lisa Wade is a professor of sociology at Occidental College. You can follow her on Twitter and Facebook.

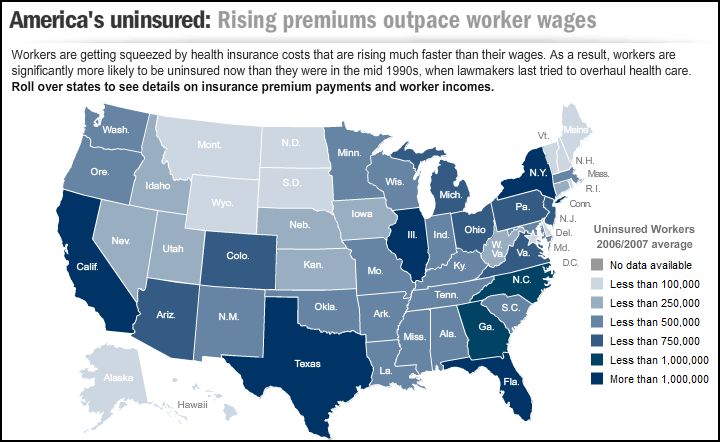
This Associated Press interactive graphic (via) displays the number of uninsured by state and provides state-specific details on the rise of health insurance costs (for employers and employees) for each state.  The number of uninsured (darker = larger #s; note that this data is highly tied to the number of residents in each state):

Capture

Some data for Illinois:

Capture2

To interpret:  In Illinois, the amount of money an employer pays each year, on average, for a family has increased 65.3% over the last ten years, and the amount the employee pays has increased 88.4%.  Employees with families now spend, on average, $2,743 a year for their health insurance.  That translates into 7% of the family income (assuming a single breadwinner), up from 4% in 1996.  Over a million workers in Illinois are not so lucky; they have no health insurance at all.

This data reminds us that, in addition to many uninsured, many of us are already paying for health insurance, so the use of taxes to pay for government provided health care would not necessarily cost those who are already insured and may actually save them money.

—————————

Lisa Wade is a professor of sociology at Occidental College. You can follow her on Twitter and Facebook.

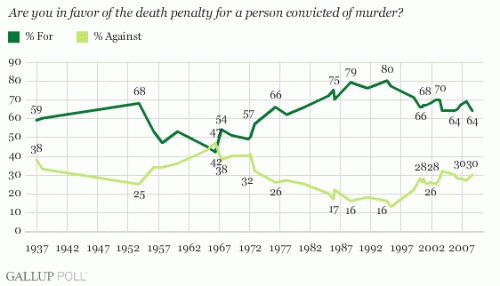
I found this graph of public support for the death penalty over time at the Gallup Poll website:

death penalty

I’m not sure what the “2828” and “3030” are at the right-hand side of the “% Against” line–perhaps they didn’t round off the %s? I looked at the specific %s given in a table and that seems to fit–that they were supposed to be 28% and 30% and somehow weren’t entered correctly.

Some other questions that were asked:

Generally speaking, do you believe the death penalty is applied fairly or unfairly in this country today?


Fairly

Unfairly

No opinion


%

%

%

2008 Oct 3-5

54

38

8

2007 Oct 4-7

57

38

5

2006 May 8-11

60

35

4

2005 May 2-5

61

35

4

2004 May 2-4

55

39

6

2003 May 5-7

60

37

3

2002 May 6-9

53

40

7

2000 Jun 23-25

51

41

8

Asked about if the person believes an innocent person has been executed in the past 5 years:


Yes, in past
five years

No, not

No
opinion

2006 May 8-11

63%

27

10

2005 May 2-5

59%

33

8

2003 May 5-7

73%

22

5

Do you feel that the death penalty acts as a deterrent to the commitment of murder, that it lowers the murder rate, or not?


Yes, does

No, does not

No opinion


%

%

%

2006 May 8-11

34

64

2

2004 May 2-4

35

62

3

1991 Jun 13-16

51

41

8

1986 Jan 10-13

61

32

7

1985 Jan 11-14

62

31

7

The answer to that last question is interesting in that it indicates people do not, in general, support the death penalty because they believe it reduces the likelihood of more murders. The most common response to why people support it is based on a retaliation/”eye for an eye” principle, not deterrance:


May
19-21,
2003

Feb
19-21,
2001

Feb
14-15,
2000

Jun.
13-16,
1991


%

%

%

%

An eye for an eye/They took a life/Fits the crime

37

48

40

40