Yesterday NPR reported that Wisconsin is considering repealing its ban on margarine in private businesses and public buildings. What is that all about!? This old post offers some great historical context.

—————————

Grass fed cows tend to produce milk that, when made into butter, has a slightly yellow color.  When margarine was invented as a butter substitute and they began producing it for U.S. consumption in the late 1880s, one marketing problem was its color.  The vegetable-based product has a clear, white-ish color and looks something like lard; many people found it unappetizing.  So the margarine people wanted to dye margarine yellow.

The dairy industry rightly saw margarine as a threat and they lobbied politicians both to outright ban margarine or to ban dying it to look like butter.  The federal government imposed a two cent per pound tax on the product in The Margarine Act of 1886 (the tax was quintupled in 1902).  Many states, especially dairy states, made dying margarine illegal (e.g., New York, New Jersey, and Maryland).  By 1902, “32 states and 80% of the U.S. population lived under margarine color bans.”

The ad below is for “Golden Yellow” margarine and specifies that it is “ready to spread” in 26 states (more text transcribed below):

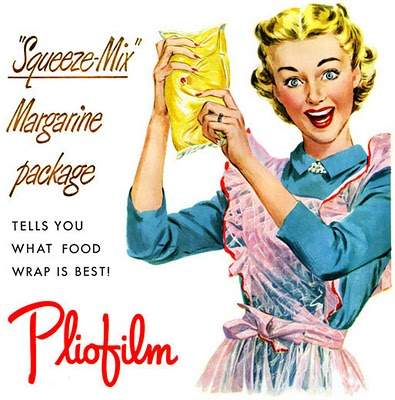
In some states, margarine manufacturers would sell margarine in plastic bags with a small bead of dye that the buyer had to knead into the spread (“Color-Kwik bags”).  This practice continued through World War II. If you judge by this ad, it was quite a good time:

Picture1

Over time, as supply and demand for butter and margarine ebbed and flowed alongside federal rules and penalizing taxes on margarine, the popularity of each ebbed and flowed too.  Then, in 1950, margarine was apparently the “the talk of the country” and President Truman put an end to the oppression of margarine, in part because the National Association of Margarine Manufacturers had begun to build enough power to compete with dairy associations.  Wisconsin, the cheese state, was the last anti-margarine state hold out (till 1967), but it continued to forbid margarine in public places (unless requested; as of Sept. 2011).

By 1957, sales of margarine exceeded those of butter. Margarine still outsells butter today. And, in a bizarre reversal, butter manufacturers now regularly dye butter yellow.

—————————

All that said, here is an excerpt from Audre Lorde’s The Uses of the Erotic in which she uses the bead of dye in the bag of margarine as a metaphor for sexuality:

During World War II, we bought sealed plastic packets of white, uncolored margarine, with a tiny, intense pellet of yellow colloring perched like a topaz just inside the clear skin of the bag.  We would leave the margarine out for a while to soften, and then we would pinch the little pellet to break it inside the bag, releasing the rich yellowness into the soft pale mass of margarine.  Then taking it carefully between our fingers, we would knead it gently back and forth, over and over, until the color had spread throughout the whole pound bag of margarine, thoroughly coloring it.

I find the erotic such a kernel within myself.  When released from its intense and constrained pellet, it flows through and colors my life with a kind of energy that heightens and sensitizes and strengthens all my experience.

Sources: Vintage Ads, Found in Mom’s Basement, Britannica, Margarine.org, and FoodReference.

Lisa Wade, PhD is an Associate Professor at Tulane University. She is the author of American Hookup, a book about college sexual culture; a textbook about gender; and a forthcoming introductory text: Terrible Magnificent Sociology. You can follow her on Twitter and Instagram.

The following chart featured at The Economist illustrates that women in Europe expect to earn significantly less than men after graduating from university. (Of course, women’s expectations are represented in pink, and men’s in blue.) According to the study, European women attending the most prestigious universities expect to earn an average of 21 per cent less than their male counterparts.

Given that women actually do earn an average of 17.5 per cent less than men in the European Union, this difference in salary expectations might not seem shocking. What’s interesting, though, is the accompanying text that attempts to explain these disparities:

Women and men seem to differ in workplace and career aspirations, which may explain why salary expectations differ.  Men generally placed more importance on being a leader or manager than women (34% of men versus 22% of women), and want jobs with high levels of responsibility (25% v 17%). Women, however want to work for a company with high corporate social responsibility and ethical standards; men are more interested in prestige (31% v 24%).

By neglecting to address how our social environment can contribute to reported differences in career aspirations, statements like these risk reinforcing gender stereotypes and naturalizing salary inequalities. Can we really assume that gendered salary disparities are due to women’s innately lower inclination to pursue high-paying career paths?

Research says: no, we can’t. As Cordelia Fine writes in her book Delusions of Gender, countless studies have demonstrated that social factors such as prevalent beliefs about gender differences and male-dominated work environments influence women’s responses to questions about their abilities and aspirations. For example, women exposed to media articles claiming that successful careers in entrepreneurship require typically “masculine” qualities were less likely to report an interest in becoming entrepreneurs. Women who knew that the test they were taking was measuring gender differences were more likely to report being highly empathic. Women were less interested in attending an engineers’ conference when it was advertised as male-dominated rather than gender-balanced.

Our perceptions of our abilities, identities, and sense of belonging are influenced by our social environment. If, as this graph shows, women attending the most prestigious universities in Europe aspire to different career paths than men, this fact can’t be taken for granted; addressing this inequality requires an analysis of its own.

Thanks to Dmitriy T.M. for sending in this graph!

Reference: Fine, C. (2010). Delusions of Gender: How Our Minds, Society, and Neurosexism Create Difference. New York: W.W. Norton & Company, Inc.

——————————

Hayley Price has a background in sociology, international development studies, and education. She recently completed her Masters degree in Sociology and Equity Studies in Education at the University of Toronto.

If you would like to write a post for Sociological Images, please see our Guidelines for Guest Bloggers.

Cross-posted at Montclair SocioBlog.

A  picture – or a graph without data – is like anecdotal evidence.  It can be very persuasive, but unless it’s based on systematic evidence, it’s just misleading.  Case in point:

The FBI is teaching its counter-terrorism agents that Islam is an inherently violent religion.  So are the followers of Islam.  Not just the extremists and radicals, but the mainstream.

There may not be a ‘radical’ threat as much as it is simply a normal assertion of the orthodox ideology… The strategic themes animating these Islamic values are not fringe; they are main stream.

Wired got hold of the training materials.  The Times has more coverage, including a section of the report that describes Muhammad as “a cult leader for a small inner circle.” (How small? Twelve perhaps?)  He also “employed torture to extract information.”*

An FBI PowerPoint slide has a “graph” to support its assertions.

The graph, really just a drawing, claims to show that followers of the Torah and the Bible have gotten progressively less violent since 1400 BC, while followers of the Koran flatline starting around 620 AD and remain just as violent as ever.

Unfortunately, the creators of the chart do not say how they operationalized “violent” and “non-violent.”  But since the title of the presentation is “Militancy Considerations,” it might have something to do with military, para-military, and quasi-military violence.  When it comes to quantities of death, destruction, and injury, these overwhelm other types of violence.

I must confess that my knowledge of history is sadly wanting, and I was educated before liberals imposed all this global, multicultural nonsense on schools, so I know nothing about wars that might have happened among Muslims during the period in question.  What I was taught was that the really big wars, the important wars, the wars that killed the most people, were mostly affairs among followers of the Bible.  Some of these were so big that they were called “World Wars” even though followers of the Qur’an had very low levels of participation.  Some of these wars lasted quite a long time – thirty years, a hundred years.  I was also taught that the in the important violence that did involve Muslims – i.e., the Crusades** – it was the followers of the Bible who were doing most of the killing.

Perhaps those with a more knowledge of Muslim militant violence can provide the data.

—————————

* To be fair, the FBI seems to have been innocent of any of the torture that took place during the Bush years.  That was all done by the military and the CIA – and by the non-Christian governments to which the Bush administration outsourced the work.

** Followers of the Bible crusading to “take back our city” from a Muslim-led regime may have familiar overtones.

Lately we’ve seen a number of instances in which men are portrayed as babies.  We saw it in a Jack in the Box commercial featuring men being pushed around in a stroller, in the recent advertising for the movie Life as We Know It, and now Australian Ikea has opened Manland, a “day care” for men, a place where women can drop off their husbands while they shop. Thanks to Andri, a brand new student of mine, and readers YetAnotherGirl, Laura E., and LM for sending it in.

The idea that men are like babies is pretty damn obnoxious and should be offensive on the face of it (see especially the Jack in the Box commercial). But this is more insidiously problematic even than that.  It tells women that they can’t expect men to be grown ups.  And if men can’t be grown ups, they we certainly can’t expect them to do their share of the dishes or the hard work of raising families or, for that matter, be a true and equal emotional partner.

We see a similar pattern of insulting men in a way that undermines women  in the new “mediocre man” genre.  As I’ve written elsewhere, the mediocre man (think Judd Apatow movies and Hard Lemonade commercials):

…is a self-deprecating character who undermines idealized masculinity by being likeable despite being decidedly non-ideal…  The viewers are meant to identify with the mediocre men, who revel in each others’ company, happy to be dudes free from the clutches of the women in their lives, even if they aren’t sleeping with supermodels.  The mediocre man may be kind of a loser, indeed, but he can thank God he’s a man.

In both the man-as-child and the mediocre man tropes, then, the portrayals manage to simultaneously mock guys and support patriarchy. Pretty amazing.

Lisa Wade, PhD is an Associate Professor at Tulane University. She is the author of American Hookup, a book about college sexual culture; a textbook about gender; and a forthcoming introductory text: Terrible Magnificent Sociology. You can follow her on Twitter and Instagram.

The U.S. Energy Information Administration (EIA) just released a new report on projected growth in global energy consumption. In case you were wondering, it’s going to continue to climb, by an estimated 53% by 2035. And the majority of that energy use will occur in countries outside the highly industrialized nations that are members of the Organisation for Economic Co-operation and Development (OECD; map of member states):

That said, while non-OECD countries will consume the majority of energy, the OECD nations will continue to lead the world in carbon emissions per person, still more than twice that of non-OECD nations by 2035, according to projections:

While renewable energy sources will increase as a proportion of all electricity production, fossil fuels, especially coal and natural gas, will continue to be the most important sources:


If you are fascinated by the ins and outs of global energy use — how much different nations use, what different types of energy source are used for (electricity, transportation, etc.), and how carbon intensive different economies are — check out the full report, as it’s chock full of data. There are also customizable tables that allow you to select topics of interest and see trends in different nations over time. But I warn you: if, say, global climate change worries you, this isn’t exactly a soothing read.

(Via Talking Points Memo.)

Cross-posted at Jezebel.

Sometimes marketing is so absurd that I am tied into knots trying to understand how an advertisement could possibly have been made and set loose into the world.  Like this ad for Zappos, sent in by Cheryl S., that claims it sells jeans in “fits for every body type”:

Are they actually mocking us?  Do they really think we are so stupid as to not find the text and visuals in this ad laughably mis-matched?  Are they trying to offend all people outside of this “range” of body types so that they don’t wear their clothes?  I just… I don’t know.

UPDATE! Business Insider featured the ad above and included another example:

Lisa Wade, PhD is an Associate Professor at Tulane University. She is the author of American Hookup, a book about college sexual culture; a textbook about gender; and a forthcoming introductory text: Terrible Magnificent Sociology. You can follow her on Twitter and Instagram.

The U.S. Census Bureau reported last week that there were 46.2 million people in poverty in 2010, out of a population of 305.7 million. That is 15.1%, or if you prefer whole numbers, call it 151 out of every 1,000.

Most news reports seem to prefer reducing the rate to a numerator of one — which makes sense since it uses the smallest whole number possible, for your mental image. In that case, you could accurately call it one out of every 6.6, but no one did. Like the Washington Post and NPR, most called it some version of “nearly one in six.” That’s OK, if you’re willing to call 15.1 “nearly 16.7.”

Using percentages, here’s the difference:

A substantial minority of reports on the poverty report took the low road of rounding the fraction in the direction of their slant on the story. Some reports just went with “one in six,” including people on the political left who may be inclined to enlarge the problem, such as Democracy Now and the labor site American Rights at Work.

On the right, the Heritage Foundation’s Robert Rector and Rachel Sheffield called it “one in seven” in a column carried by the Boston Herald and others. (Their point, repeated here when the new numbers came out, is that the poor aren’t really poor anymore since they have many more amenities than they used to.) That’s cutting 15.1% down to 14.3%, which is actually closer to the truth than 16.7%:

It’s not that far off, but if your story is about the increase in poverty rates, it’s unfortunate to round down exactly to last year’s rate: 14.3%.

Then there are the people who may have just gotten stuck on the math and couldn’t decide which way to go, like the columnist who called it “essentially one in six” (which was ironic, because the point of his post was, “That’s the nice thing about most statistics, handled deftly, they can say just about anything you want them to.”) In some cases headline writers seem to have been the culprits, shortening the writer’s “almost one in six” to just “one in six.”

The worst exaggeration was from Guardian correspondent Paul Harris, who wrote, “the US Census Bureau has released a survey showing that one in six Americans now live in poverty: the highest number ever reported by the organisation.” The number — 46.2 million — is the highest ever reported, but the percentage was higher as recently as 1993.

If the point is to conjure an image that helps make the number seem real to people, it probably doesn’t matter — you may as well just go for accuracy and say “fifteen percent.” (You definitely shouldn’t use pie charts, which are hard for viewers to judge.) That’s because most people can’t immediately make an accurate mental image of either six or seven — after four they count. But I could be wrong about that. Consider these images — would the choice of one over the other change your opinion about the poverty problem?

They both create a reasonable image. But the choices people made are revealing about their biases  — and the unfortunate state of numeracy in America. Because it does matter that the number of people in poverty rose by 2,611,000.

Maybe more important is who and where these poor people are. Here’s two other ways of representing it, with very different implications.

Fifteen percent over there:

Fifteen percent spread according to a random number generator:

Note that those are just abstractions for visualizing the overall percentage of poverty. But there is a real geographic distribution of rich and poor, described in recent research by Sean Reardon and Kendra Bischoff (free version here). They found that, not surprisingly, as income inequality has grown, so has income segregation — the tendency of rich and poor to live in different parts of town. And that probably makes reality even more abstract — and more subject to media construction — for people who aren’t poor.

As of today, Don’t Ask/Don’t Tell, the U.S. policy that allowed gays and lesbians to serve in the military only as long as they kept their sexual orientation a secret, is officially over. In honor of this milestone, here’s the official letter from top Army commanders to soldiers announcing the end of the policy:

Via Joe. My. God.

NPR posted interviews with two men who worked hard for repeal, and it’s worth a read.