Cross-posted at Family Inequality.

People don’t know how much they’re eating.

A recent experiment found that people eat more when the container is larger, even when the portion size is not. They gave Belgian college students a container of M&Ms and parked them in front of a TV, with some cover story. The students were randomly assigned to three groups, medium-portion/small-container, medium-portion/large-container, and large-portion/large-container. These were the results: The ones who got the large container ate more, whether it was full or not (the difference between the two wasn’t significant).
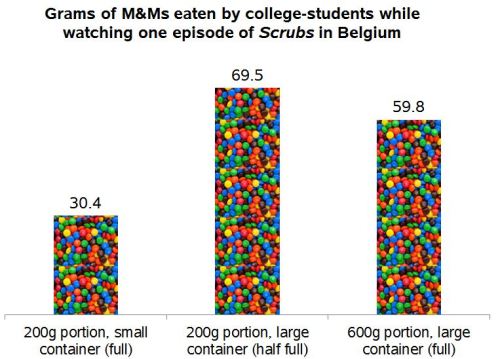
These kinds of experiments continuously suggest that distractions, distortions and other apparently irrelevant information and events routinely have large effects on people’s eating practices (here’s an extensive review). One infamous study showed that even people served 14-day-stale popcorn at the movies ate 34% more when it was served in a large container. In an earlier popcorn study, researchers found that people given large containers not only ate more, but were less able to report how much they ate. They concluded:

When a food is eaten from a large container, it appears easy to lose track of how much one eats. Even if the food were to taste relatively unfavorable, eating it from a large container may cause one to overeat because they lose track of how much they have consumed.

About that Yogurt Tub…

All this occurred to me when I visited one of our many local Frozenyo franchise outlets. It’s a self-serve frozen yogurt place where you pay one price by weight no matter what you put in your bucket. The trick that impressed me is the bucket — there is only one size, and it’s very large. But you can’t judge how big it is because there’s nothing to compare it with — no sizes or prices on the wall, no mini cup for kids — just one stack of identical buckets. So the person who posted this picture on Yelp probably thought she had a reasonable size serving, since the thing is barely half full:

There are three possible ways to judge your self-served serving size. You can go by the tub (“I filled it half way”), you can go by the person next to you (“sheesh!”), or you can look at the cartoon penguins on the wall:

How much is the penguin eating? I took home one of the buckets, and measured the volume of water it holds: 18 ounces. In comparison, a standard kid-sized serving bowl, the kind some people use to give their kids ice cream at home, holds 12 ounces:

An innocent child used to half a bowl of ice cream — in the bowl on the left — might be pretty steamed if you served her this:

According to the serving size information on the back wall of Frozenyo, I think that’s about 1.5 servings, or 150 calories of the nonfat variety, before toppings. The penguin’s overflowing bowl is 5.0 servings. With no toppings that’s 500 calories. If you pile it with M&Ms, sprinkles, hot fudge, Captain Crunch, coconut topping and fresh kiwis, who knows. It’s not really that many calories to consume — the same number as a single slice of banana bread at Starbucks.

But the point is you don’t know how much you’re eating. One Yelp reviewer cautioned that you can get a stomach ache after eating at Frozenyo, because “your eyes are bigger than your stomach.” I think it’s because the dump-truck sized delivery vehicle you eat it out of is bigger than your stomach.

But most reviewers love it for the individual control over serving size and toppings, and the reasonable price ($.39 per ounce by weight, or $5-$6 for a typical load).* I think it’s a winning business model, with low labor costs, because all you need is one person to pour the mix into the machines and another to weigh the tubs and swipe credit cards. According to the company’s ambitious map, there are still 46 states with “territory available.”

If I were them, I would increase the bucket size by 5% per year. I doubt anyone would notice.

* Paging George Ritzer: it’s the irrationality of rationality.

Katrin sent in a delightful video by the 1491s, a sketch comedy troupe that frequently skewers popular representations of Native Americans and their various cultures. The group recently released a new video featuring footage of 1491s member Ryan Red Corn dancing at the Santa Fe Indian Market interspersed with shots of visitors to the market and examples of appropriation of Native cultures, all set to Irving Berlin’s “I’m an Indian Too,” from Annie Get Your Gun. It’s a great send-up of the whole Native-culture-as-fashion-statement trend:

The New York Times‘ Sabrina Tavernise reports that the long term trend of increasing life expectancy has reversed it self among one specific group of people.  Between 1990 and 2008, the life expectancy of White men and women without high school degrees has dropped.  Women have lost five years, men three.

The difference in the life expectancy between men and women without high school degrees and those who complete college are even more striking.  Women with a college degree can expect to live, on average, more than 10 years longer than high school drop outs.  Among men, the gap is even larger, a whopping 13 years.

The words “alarming” and “vexing” were used to describe this drop in life expectancy.  Scholars are still unsure of its causes, but note the stress of balancing work and family, “a spike in prescription drug overdoses among young whites, higher rates of smoking among less educated white women, rising obesity, and a steady increase in the number of the least educated Americans who lack health insurance.”

Ultimately, they argue, as fewer and fewer people fail to graduate from high school, the concentration of disadvantages in those that do are making this population especially vulnerable to all kinds of ills, some of which kill them.

Hat tip to The Global Sociology Blog.

Lisa Wade, PhD is an Associate Professor at Tulane University. She is the author of American Hookup, a book about college sexual culture; a textbook about gender; and a forthcoming introductory text: Terrible Magnificent Sociology. You can follow her on Twitter and Instagram.

SocImages News

Paul Frank, creator of fashion icon Julius the Monkey, emailed us.  He wanted to let us know that he opposed the monkey’s appearance in a Native American-inspired fashion event that we used as an example of cultural appropriation.  The post and the follow up can be found here.

My unusually strong argument about Chris Brown’s battered woman tattoo (in which I drew extensively from Amanda Marcotte) was reposted at Jezebel and received a great deal of attention and debate.

Gwen was quoted at Andrew Sullivan’s Daily Dish talking about awareness of beneficiaries’ awareness of their use of government programs.

I was quoted in the Deseret News in a story about the challenges faced by families in the age of the internet.

SocImages posts also appeared at Ms., Jezebel, and Racialicious this month:

Upcoming Lectures and Appearances

I had a fabulous time at Indiana State University this month and I’m looking forward to upcoming talks in California and Boston:

  • California State University – Northridge (Oct. 8): “Female Genital ‘Mutilation’ in the American Imagination”
  • Western Political Science Association (Hollywood, CA, Mar. 28-30): panels on “Public Intellectualism” and the “Twenty-First Century Sex Wars”
  • Harvard University (Women’s Week, Mar. 8-14): “A Feminist Defense of Friendship”

New Intern

Please welcome Laura Bertocci, our new SocImages intern.  Laura is a senior History major at Occidental College currently writing her thesis on the American media coverage of the Chilean dictatorship in 1973, inspired by her recent semester abroad in Valparaíso, Chile. She has worked at her hometown’s branch of Patch.com, LA politics blog The City Maven, Forbes Magazine, and Gannett Government Media in every role from reporter to editor to photographer, and plans on pursuing journalism after graduation.

Most Popular Posts

Speaking of Laura, she collected this set of our most popular posts from September:

Newest Pinterest Page

Gwen put together a new Pinterest page featuring a collection of a SocImages audience favorite: Pointlessly Gendered Products.  See all of our boards here.

Social Media ‘n’ Stuff

This is your monthly reminder that SocImages is on TwitterFacebookGoogle+, and Pinterest.  Lisa is on Facebook and most of the team is on Twitter: @lisadwade@gwensharpnv@familyunequal@carolineheldman@jaylivingston, and @wendyphd.

In Other News…

Wow, who’s that with the Bluth Company stair car!?

In 2010 we posted about a Boston.com slide show celebrating Oktoberfest.  We argued that, while many different types of men were included, the women pictured were overwhelmingly young and often had visible cleavage.  That is, the slideshow was an example of the sexual objectification of women.  In response, the slide show editor, Alan Taylor, sent us a note saying that, while he didn’t disagree and was sympathetic to our concern, he was limited by what photographs were available as well as their quality.

This year’s photos, I noted pleasantly, had exactly zero gratuitous cleavage shots.  I thought I’d highlight it as an example of how not to sexually objectify women in an Oktoberfest slide show.

In other words, look! It’s possible to take pictures of young women in dirndls without showing tons of cleavage!

MSNBC does a pretty good job too.  See also, Oktoberfest and Tradition.

Lisa Wade, PhD is an Associate Professor at Tulane University. She is the author of American Hookup, a book about college sexual culture; a textbook about gender; and a forthcoming introductory text: Terrible Magnificent Sociology. You can follow her on Twitter and Instagram.

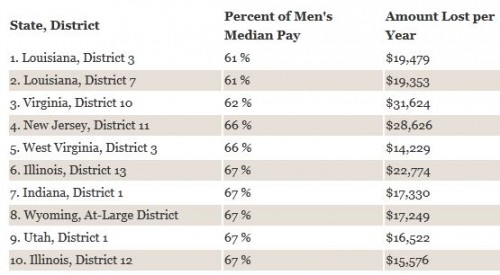
The National Partnership for Women & Families has posted an interactive map that displays the gender pay gap in each state and in the Congressional districts within the state. It uses Census Bureau data comparing full-time, year-round workers (that is, the scenario in which we’d expect women’s income to be closest to men’s). When you click on any state, it brings up information about it. For instance, in Nevada, women make 85% of what men do. Women working full-time have a median income of $35,484, while men’s median income is $41,803. The gap is smallest in the 1st and 3rd districts (both including parts of the greater Vegas metro area), but significantly larger in District 2, which covers the rest of the state, much of it rural:

Here are the 10 U.S. Congressional districts with the largest gender gap in median pay:

They don’t list the state or districts with the smallest gap. Just from casually and non-systematically clicking around, the state with the most parity that I found was in Washington D.C., where women make 90% as much as men. Let us know in the comments if you find anywhere with an even smaller gap.

In the 3-minute video below we see 100 people, filmed by Jeroen Wolf, from ages one to one hundred.  The one-year-old mostly just stares, the remainder look into the camera and state their age.

What I find interesting is the uneven way that people age.  As you watch the clip, people’s ages become increasingly difficult to pin down.  You know that each person is about one year older than the last, but their appearance betrays this knowledge.  One might look significantly older than the one before, or quite a bit younger.  How old we look doesn’t ascend nicely in a linear fashion,  but varies tremendously.  No doubt this is based, in part, on genetics and life choices, but it is also dependent on opportunities and expectations related to ascribed identities and social structures.

Enjoy:

Lisa Wade, PhD is an Associate Professor at Tulane University. She is the author of American Hookup, a book about college sexual culture; a textbook about gender; and a forthcoming introductory text: Terrible Magnificent Sociology. You can follow her on Twitter and Instagram.

The National Hispanic Media Coalition recently released a report, “The Impact of Media Stereotypes on Opinions and Attitudes towards Latinos,” that looked at perceptions of Latinos in the U.S. A survey about views on Latinos, as well as media representations of them, was administered by phone to a national sample of 900 non-Latinos in March 2012.

The study found that the overwhelming majority of respondents agreed with a number of positive stereotypes of Latinos, such as the idea that they are hardworking and family-oriented:

A range of negative stereotypes were persistent as well. Participants were asked how well a number of negative views described Latinos. Fully half agreed that Latinos can generally be described as welfare recipients and poorly educated, while significant minorities agreed with a number of other negative views:

The researchers created a familiarity index based on personal contact with Latinos, frequency of such interactions, and general cultural awareness. Overall familiarity varied significantly by age, with younger adults reporting higher levels than older adults:

All groups, regardless of level of familiarity, felt generally positively about Latinos. However, when asked about “illegal aliens,” feelings were much more negative. Feelings were based on a scale from 0 (worst possible opinion) to 100 (highest possible opinion). The more familiar a group was with Latinos, the higher their average rating of both “Latinos” and “illegal aliens,” but every group had distinctly more negative opinions when asked about illegal aliens:

Which news source a person favored affected their perceptions of Latinos, with those who listed FOX News and conservative talk radio reporting more belief in negative stereotypes than those who rely on other TV sources or NPR for their news. However, though the gap was significant, it often wasn’t as large as you might expect given common perceptions of the wide divergence among, say, MSNBC and FOX News fans:

The researchers also conducted an online experiment on the impacts of negative media images on individual’s perceptions of Latinos. You can read the results of that aspect of the study in the full report (and read more about the research firm’s methods here).