Jezebel recently posted this Australian PSA about the dangers of fast food:

It made me think of this British PSA from 1967 that addressed childhood obesity. Our ideas of what you should be eating may have changed in the past 40 years, but the tendency to rely on individualistic explanations and to blame moms for not providing children better food, as though the food they choose for their kids exists outside of any larger social context, seems to have quite the shelf life.

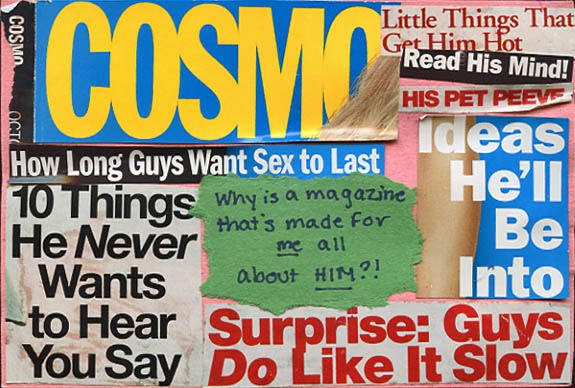
A secret on PostSecret today nicely captures how women’s magazines are relentlessly guy-centric:

Lisa Wade, PhD is an Associate Professor at Tulane University. She is the author of American Hookup, a book about college sexual culture; a textbook about gender; and a forthcoming introductory text: Terrible Magnificent Sociology. You can follow her on Twitter and Instagram.

Today is the last day of Oktoberfest in Munich; this has meant a lot of slide shows of people drinking from giant beers steins on the wiesn.  I noticed that the slide show at Boston.com included a disproportionate number of images of young women in (often boob-poppin’) Dirndls.  Men were about as likely to be young as they were to be older, exhibiting interesting character, and more likely to be shown in functional roles.  Women, then, were included primarily as eye candy for a (presumably heterosexual and) male gaze.

Five photos of young girls in Dirndls, two photos of young men in Lederhosen, two photos of older men in Lederhosen, one mixed-sex picture of middle- and older-life characters (the only one that includes a picture of a woman who might be over 25), three photos of men at work, and two photos of women at work (including the only photo of a woman who is not dressed up to be conventionally attractive).


For a slide show without the objectification, see Time.

—————————

UPDATE! Alan Taylor, the editor of the slide show at Boston.com, wrote in with some perspective:

Hi there, just a note from the editor of the blog post in question. First, I’m happy to see the discussion here, believe it or not subjects like this are often in mind when compiling my photo stories.

This seems like fair criticism, and I’m not being defensive. What I will offer is last year’s entry for comparison and contrast: http://www.boston.com/bigpicture/2009/09/oktoberfest_2009.html – not nearly as many “boob-poppin’” dirndls there.

As an editor I am limited by the photos available to me, and their quality. In this case, for example, there may have been a decent photograph of an older woman in a strong functional role, but maybe it was poorly lit or repetitive just not up to par, and was left out. I compile entries three times a week on varied subjects that endup being 30 to 40 photos total, starting with anywhere from 100 to 300 to begin with. The selection process is long, subjective, and can certainly be viewed as flawed from many points of view.

If you think the blog is intentionally objectifying, I invite you to look through my archives: http://www.boston.com/bigpicture/2010/09/ and judge for yourself. I can also be reached by email at ataylor@boston.com

Thanks for the discussion,
-Alan Taylor

Lisa Wade, PhD is an Associate Professor at Tulane University. She is the author of American Hookup, a book about college sexual culture; a textbook about gender; and a forthcoming introductory text: Terrible Magnificent Sociology. You can follow her on Twitter and Instagram.

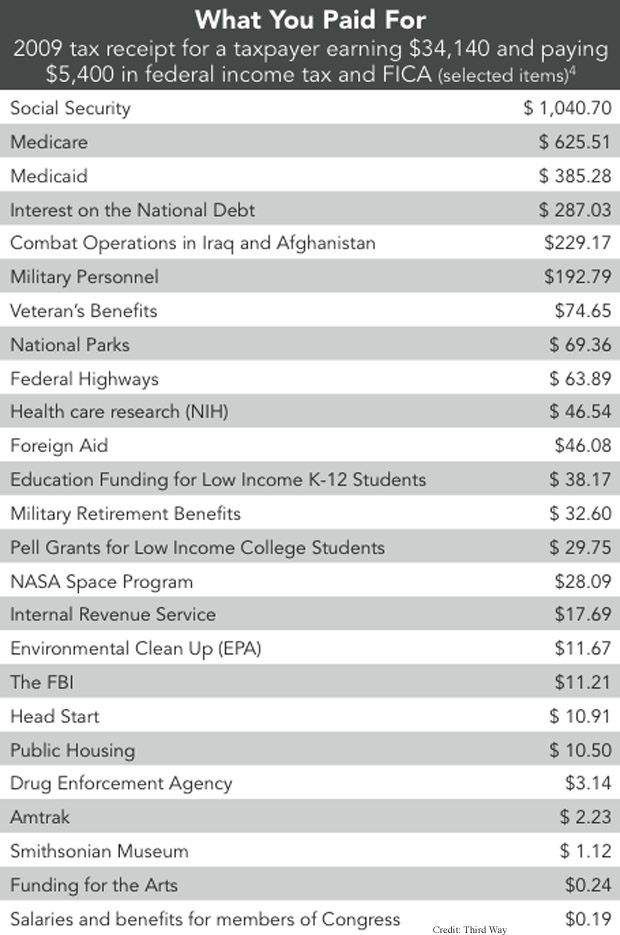
Third Way, which describes itself as “the leading moderate think-tank of the progressive movement,” proposes that taxpayers should get a receipt showing where their taxes go. They point out,

For many Americans, the amount they pay in taxes is larger than any purchase they make during the year, but studies show they know almost nothing about where that money goes to. This contributes to ridiculous beliefs, like the view that 20% of government spending goes to foreign aid, for example.

They provide a sample receipt for a taxpayer making $34,140, the median income in 2008; the receipt doesn’t include everything, but major categories of interest or that taxpayers tend to be very unclear how much money is spent on:

Via Talking Points Memo.

It’s not a receipt, but you can calculate how much you pay in taxes to various programs based on your income here.

This 23-minute documentary, The Colony, explores Chinese immigration to Senegal. The immigrants are drawn to Africa by the promise of lucrative entrepreneurship and they are changing the economic landscape, to the pleasure and displeasure of locals.

At Al Jazeera.

Lisa Wade, PhD is an Associate Professor at Tulane University. She is the author of American Hookup, a book about college sexual culture; a textbook about gender; and a forthcoming introductory text: Terrible Magnificent Sociology. You can follow her on Twitter and Instagram.

NEWS:

Gwen and I were honored to appear alongside no other than media-critic-icon Jean Kilbourne in a podcast for Bitch magazine.

Gwen was also featured in a Sociology Improv podcast (about vajazzling, the Republican party, and how it’s never been good to be a cowboy) and was interviewed about sociology and her super curly hair for The New Naturalista.

Marissa’s guest post about gender and toilet signs was translated into French and posted at Rue89.

Also, SocImages had its highest traffic month ever in September with over 575,000 visits!  After a typical summer dip (oh how we hate the months of June, July, and August around here!), we made a strong recovery with a record month!  Here’s to an excellent year for us all!

Finally, this is your monthly reminder that we’re on Twitter and Facebook (where we update with featured posts everyday).

NEWLY ENRICHED POSTS (Look for what’s NEW! Sept. ’10):

We only have one newly updated post for you this month.  Have you seen the recent back-to-school Life cereal commercials?  We added them as another example of how people of color are used to represent flavor.

Lisa Wade, PhD is an Associate Professor at Tulane University. She is the author of American Hookup, a book about college sexual culture; a textbook about gender; and a forthcoming introductory text: Terrible Magnificent Sociology. You can follow her on Twitter and Instagram.

Dmitriy T.M. let us know that Matthew Yglesias posted an interesting graph that compares the actual distribution of wealth in the U.S. compared to what different groups estimate the distribution to be:

As Yglesias says, it’s striking not just that we underestimate how much wealth the top 20% control, but how little the poorest Americans do. Americans imagine the poor to have many, many more financial resources than they actually do.

American politicians are currently wrangling over whether to extend the Bush tax cuts of 2001 and 2003. Word on the street is that extending these cuts will cost the U.S. treasury $2.7 trillion over the next ten years.  A graphic from the New York Times shows how much people with different incomes benefited from these tax cuts. If you look at the far right column you’ll see the average number of dollars left in people’s pockets between 2004 and 2010; the dollar amount rises from the poorest 29% of Americans (top with $355) to the richest 1% (bottom with $2,326,607).

Click over for a larger image; via BoingBoing.

—————————

Lisa Wade is a professor of sociology at Occidental College. You can follow her on Twitter and Facebook.