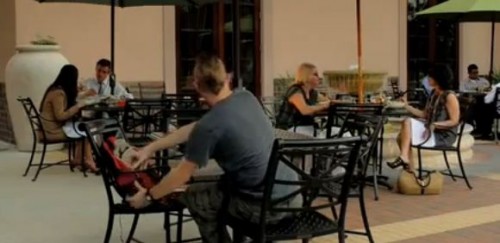
Well, crap. It turns out I might be a terrorist. I wasn’t aware of this, but then Dave A. sent in a video from Houston’s Make the Call anti-terrorism initiative, and it isn’t looking good.

The evidence:

  • I sometimes walk off and leave bags unattended in public spaces.
  • I gather information about routines in public spaces, often sending operatives out to stand by entrances and exits. They covertly take notes, and I specifically tell them not to draw attention to themselves. Occasionally they even take photos of the layouts of public places or ask employees detailed questions about the inner workings of the organization. I have cleverly disguised these surveillance activities as sociology assignments.
  • I sometimes carry small electronic gadgets that might not be immediately recognizable to every single person sitting at a cafe.
  • I get cold easily and often wear sweaters or bulky hoodies in summer, even in Vegas.
  • I can be kind of hyper and nervous-acting, which probably makes me “sketchy”.
  • I always forget the security code at my friend Robin’s housing complex, so I usually just sneak in behind someone else.
  • I have been known to park in prohibited areas.

Watch the video and see for yourself:

This method of fighting terrorism is extremely unrealistic. The behaviors listed in the video are things people do all the time, in a variety of contexts. If every citizen of Houston reported every incident they see that is mentioned in this video, the Houston PD would be overwhelmed and unable to function because of the number of calls they’d have to investigate. I’d have to call the police every time I saw a woman wearing Ugg boots in Vegas, because it’s never cold enough here to justify them.

The video tells viewers not to ignore their “instincts.” But do we have an instinct for detecting “sketchy” people or behavior? Given what we know about stereotyping and selective perception, the reality is that people will view behavior through their pre-existing beliefs. Their interpretations of behavior as unusual or inappropriate will be influenced by how comfortable they otherwise are with the person engaging in it, which is impacted by race/ethnicity, class, and many other social categories. A guy leaving a backpack unattended is scary if that guy has a mohawk or, you know, looks scary and stuff, but when I do it, no one bats an eye. This video basically legitimizes turning anyone who makes you at all uncomfortable in public in to the police, on the argument that you are simply following your “instinct.” When you ask every citizen to become an intelligence agent, reporting every incident they perceive as odd, the result is the increasing stigmatization and semi-criminalization of those who can’t or won’t conform to pretty narrow standards of physical appearance, dress, and behavior.

UPDATE: There’s an interesting discussion in the comments about how you balance the need to avoid paranoia with the fact that, for instance, some rapes on college campuses would be prevented if people didn’t leave dorm doors ajar or let people in without knowing who they are, and that’s a conversation worth having. However, I’m also interested in the issue of feasibility here: If all the citizens of Houston literally did what this video suggests, law enforcement would grind to a halt and response times would slow for everyone.

As for why I sometimes leave bags unattended in public…Because there’s nothing of value in it and I left it on an outside table while I go inside to order, or because I’m gathering a lot of books at the library and I get sick of lugging my bag while I do this and leave it on a table while I go into the stacks, or because I realize I forgot to grab something on another aisle at the grocery store and I run around the corner to grab it without thinking to grab my bag. My point isn’t that any of the things I do are laudable or even smart, but rather that people do these things, sometimes on purpose, sometimes because we get distracted or make mistakes, and it’s going to take a massive increase in law enforcement if we really want citizens to start vigilantly reporting them.

Liz B. let us know about Slim Jim’s Spice Loss ad campaign, which features a number of commercials about men suffering from the horrible condition of spice loss, also known as emasculation. As Liz explains, “Apparently you need processed meat to stimulate your ‘man gland’, and give you ‘brolectrolytes’ for your ‘menergy’.” The ads feature themes that are common when marketing to men — a very circumscribed version of acceptable masculinity and the idea that women, and feminized things, are threats to masculinity.

Things that endanger men’s lives or just generally sap their will to live, according to the ads:

  • Shakespeare
  • Bird-shaped boats
  • Ironing
  • Making adjustments to their lifestyles to accommodate family life
  • Yoga
  • Salad
  • Spending time with women.

[vimeo]https://vimeo.com/42300742[/vimeo]

[vimeo]https://vimeo.com/151574343[/vimeo]

[youtube]https://www.youtube.com/watch?v=BmApg3M5LNY[/youtube]

It’s fascinating, really: femininity is depicted as weakness, the sapping of strength, yet masculinity is so fragile that apparently even the slightest brush with the feminine destroys it. This entire ad campaign — and the discourse about masculinity it draws from — is just an adult version of the game of cooties, with men fleeing the symbolic pollution of femininity.

Gwen Sharp is an associate professor of sociology at Nevada State College. You can follow her on Twitter at @gwensharpnv.

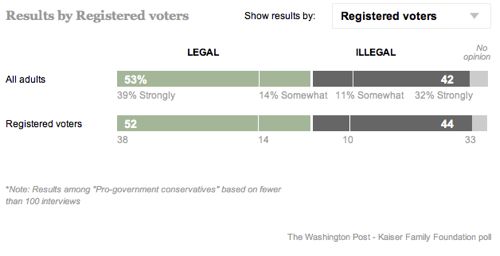
The Washington Post and the Kaiser Family Foundation released the results of a survey of 3,130 adults about their position on same-sex marriage. The survey found that just over half of all adults and registered voters thought same-sex couples should be able to get married:

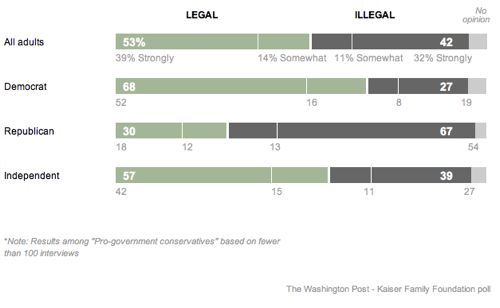
Unsurprisingly, this varies greatly by political affiliation, with Democrats and Republicans mirroring each other — 2/3rds of Democrats support same-sex marriages, while the same proportion of Republicans oppose it. Well over half of Independents also agree that same-sex marriage should be legal:

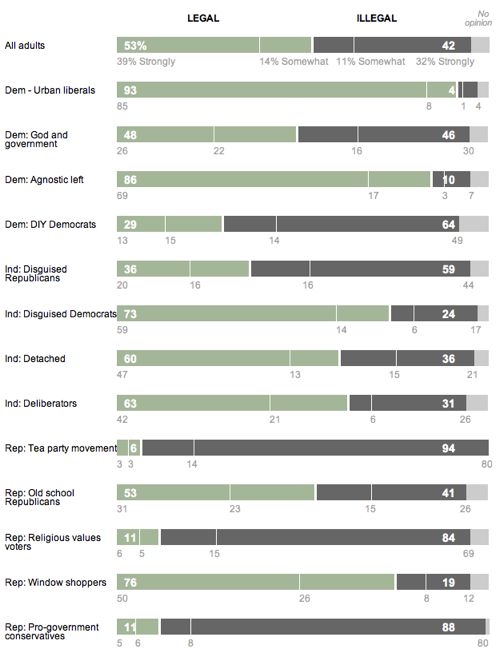
You can also see the results by party clusters — that is, different groups within the parties (the Post unfortunately doesn’t describe the clusters). Urban liberals were most supportive (93%), while those identifying with the Tea Party were least (6%):

These numbers tell us a lot about why the Democratic party appears to be on the verge of adopting a platform that explicitly includes marital equality as a goal. This position is unlikely to alienate many people within the party or Independents who might lean Democratic, since only a small minority of both groups “strongly” oppose same-sex marriage. We’re at a point where a major political party can make the calculation that openly stating they support allowing gay and lesbian couples to get married helps its political chances more than it potentially hurts them.

Via the New Civil Rights Movement.

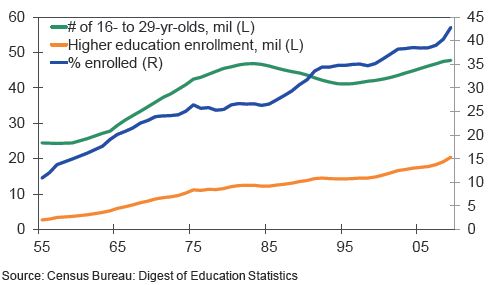
Earlier this summer, Lisa posted about total student loan debt in the U.S., which has increased overall as more people go to college. “Student Lending’s Failing Grade,” a report from Moody’s Analytics  provides more information about student loan debt. Demand for student loans continues to increase as the number of high school graduates who go on to college rises. Over 40% now attend (blue line; the right axis shows percents):

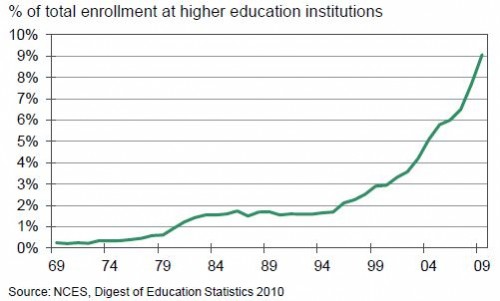
Enrollment at for-profit institutions such as University of Phoenix is still a small minority of all those going to college, but it’s growing rapidly:

This is significant for student loan debt because students at for-profit (or proprietary) institutions have much higher default rates than students at private or public colleges:

However, the report points out that default and delinquency rates on student loans are quite low compared to other forms of debt. This is partially due to the consequences of defaulting, but also because it’s easier to defer student loan repayment and thus avoid being labeled as “defaulting” than it is for most other loans.

Overall, the report argues that projections of future student loan debt are worrisome. Loans taken out more recently have higher default rates than in the past, and students may have unrealistic expectations of how much they will make after graduation, and so overestimate how much they’ll be able to pay in student loan debt each month. From my experience watching students, I would add that it’s not even that they overestimate how much they’ll be able to afford; many don’t have a clear sense of how much their monthly payment will be, especially since they take out loans on a semester-by-semester basis and may not really think about the cumulative debt they’re taking on. Many are then shocked to discover that their monthly bill isn’t the insignificant sum they’d assumed it would be.

Last month the president of fast-food chain Chik-fil-A publicly stated that the company opposed same-sex marriage. The restaurant then became a flash point in the struggle around who has the right to get married. Supporters of marriage equality called for boycotts, but opponents of same-sex marriage participated in Chik-fil-A, organized by Republican former governor of Arkansas (and Fox News commentator) Mike Huckabee. Huge numbers of people turned out to patronize the store last Wednesday, leading to enormous lines and long waits at some locations, and intense media coverage of the event.

So Chik-fil-A became clearly associated with the anti-same-sex marriage camp, and more generally with the conservative movement. But what about other restaurants?

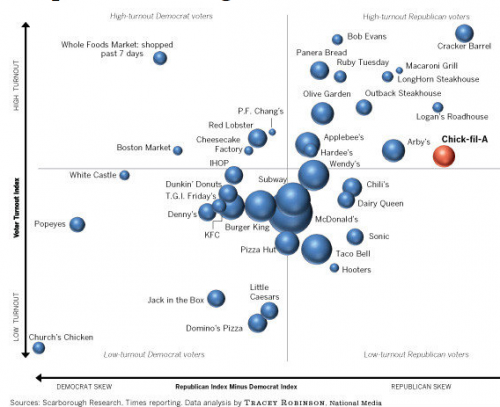
Reader Peter N., of Pitzer College, sent in an image posted by the Los Angeles Times showing the politics and political engagement of patrons of a number of restaurants, as well as Whole Foods. A market research firm’s survey asked respondents if they had gone to any of these restaurants in the past 30 days (7 for Whole Foods), political leanings, and likelihood of voting. In this graph, the larger the bubble, the more respondents said they had gone to the restaurant. Those left of the center line had a disproportionate number of Democratic customers, while those to the right attracted Republicans. The higher the bubble on the graph, the more likely its customers were to vote:

Aside from the political patterns, notice the differences in likelihood of voting. Generally, customers at sit-down restaurants like P.F. Chang’s and Macaroni Grill were more likely to vote than those at fast-food places, though there are a few exceptions (Denny’s, Hooters). This probably reflects class differences in voting: the restaurants in the upper half of the graph are generally more expensive than the fast-food places or chains like Denny’s, and they require more leisure time for a meal compared to getting a pre-made, or quickly-made, combo at the drive-through. Those with the money and time to spend on such restaurants are the same groups who are more likely to vote in general.

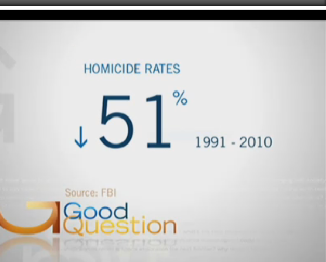
In the wake of the Aurora theater shooting and the shooting of a Sikh temple in Wisconsin, Minneapolis CBS affiliate WCCO asked, “Are we more violent than ever before?” They interviewed The Society Pages’ own Chris Uggen about historical changes in crime. Given the way local news often covers crime and violence, this is a surprisingly nuanced segment:

When we talk about residential segregation, we’re generally focusing on race, and for good reason — many cities in the U.S. still have incredibly high rates of racial segregation. However, a recent Pew Research Center report looks at economic segregation, which is increasing in U.S. neighborhoods.

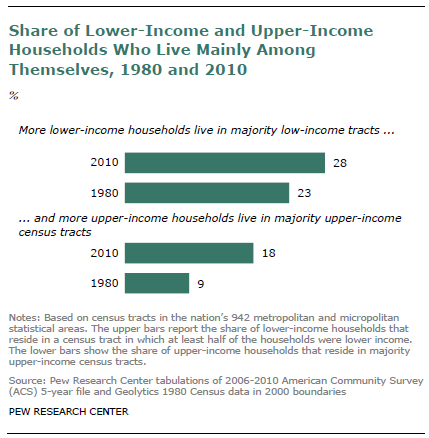
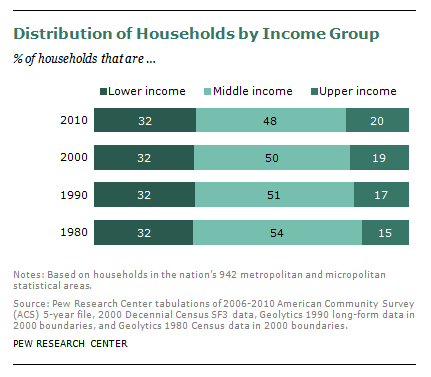
Economic segregation refers to the degree to which people in different social classes live mostly among other people of their class. In 2010, the majority (76%) of people in the U.S. lived in middle-class or mixed-income neighborhoods. But economic segregation has increased in the last few decades. More of both lower-income and upper-income households live in Census tracts made up of households primarily like themselves:

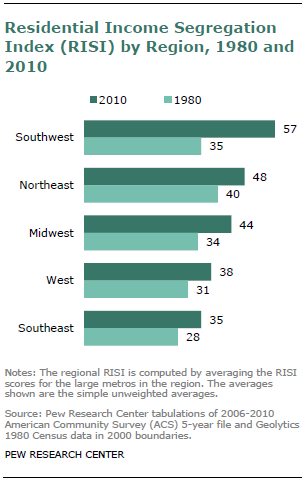
The RISI index for a city just combines the % of both groups that live in tracts dominated by their own income group (so the maximum score is 200). Looking at RISI scores by region, we see that the Southwest has the most economic segregation, and has increased more than any other region in the past 30 years:

The Pew report argues that this is related to the general increase in income inequality, with less than half of the U.S. population falling into the middle class by 2010, and the upper class (here defined as those making more than $104,000) increasing:

Economic segregation is still a less prominent feature of cities than racial segregation is. But given its steady increase, it’s worth thinking about the consequences of the relative isolation of different social classes from one another. When the rich, poor, and middle-income groups live in different parts of town, who will have the political influence to draw municipal spending to their neighborhoods? How will this growing residential pattern affect who has access to nice parks, public facilities such as libraries and recreation centers, and maintenance for schools and roads — or, alternatively, whose neighborhoods become the location for generally undesirable or unpleasant industries or land uses?

U.S. presidential candidate Mitt Romney recently traveled to Britain, Israel, and Poland, presumably to shore up his foreign policy credentials. Among a number of other statements that got a lot of attention, Romney praised Israel’s health care system, comparing it positively to the U.S. He stressed the cost differences, pointing out that Israel spends significantly less of its GDP on health care. This drew media attention because Israel has universal coverage provided by the state, and the glowing statements seemed a little odd in light of the Republicans’ opposition to the Affordable Care Act and the demonizing of the program as socialism.

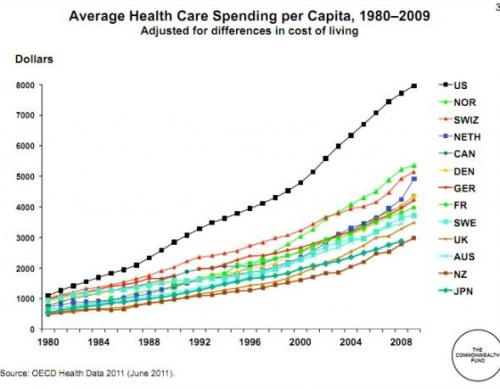
But all that aside, how much do Americans spend on health care? Well…a lot. Elizabeth McM. sent us a link to a story at The Atlantic comparing U.S. medical spending to a number of other nations:

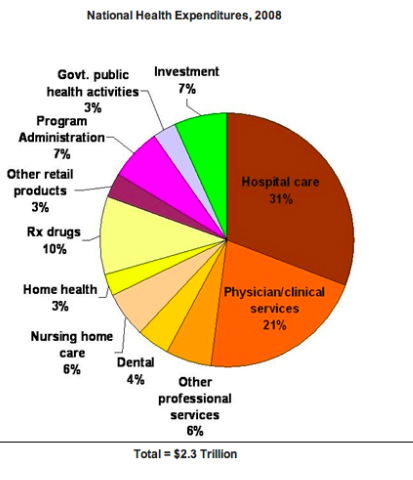
What are we spending it on? Hospital care is the single largest expense, followed by the cost of doctor/clinic visits. Another 10% is prescription drugs. The remainder falls into a variety of categories:

With overall spending distributed among so many different sectors of the health care sector, reducing costs requires more than just increased efficiency by hospitals or lowered drug costs — it requires changes and savings throughout the system.