TW: racism and sexual violence; originally posted at Family Inequality.
I’ve been putting off writing this post because I wanted to do more justice both to the history of the Black-men-raping-White-women charge and the survey methods questions. Instead I’m just going to lay this here and hope it helps someone who is more engaged than I am at the moment. I’m sorry this post isn’t higher quality.
Obviously, this post includes extremely racist and misogynist content, which I am showing you to explain why it’s bad.
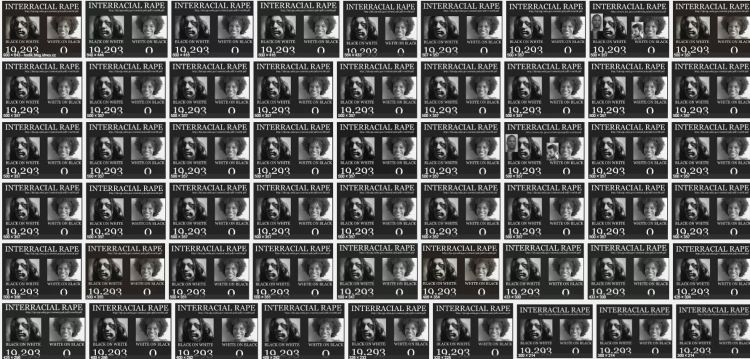
This is about this very racist meme, which is extremely popular among extreme racists.

The modern racist uses statistics, data, and even math. They use citations. And I think it takes actually engaging with this stuff to stop it (this is untested, though, as I have no real evidence that facts help). That means anti-racists need to learn some demography and survey methods, and practice them in public. I was prompted to finally write on this by a David Duke video streamed on Facebook, in which he used exaggerated versions of these numbers, and the good Samaritans arguing with him did not really know how to respond.
For completely inadequate context: For a very long time, Black men raping White women has been White supremacists’ single favorite thing. This was the most common justification for lynching, and for many of the legal executions of Black men throughout the 20th century. From 1930 to 1994 there were 455 people executed for rape in the U.S., and 89% of them were Black (from the 1996 Statistical Abstract):

For some people, this is all they need to know about how bad the problem of Blacks raping Whites is. For better informed people, it’s the basis for a great lesson in how the actions of the justice system are not good measures of the crimes it’s supposed to address.
Good data gone wrong
Which is one reason the government collects the National Crime Victimization Survey (NCVS), a large sample survey of about 90,000 households with 160,000 people. In it they ask about crimes against the people surveyed, and the answers the survey yields are usually pretty different from what’s in the crime report statistics – and even further from the statistics on things like convictions and incarceration. It’s supposed to be a survey of crime as experienced, not as reported or punished.
It’s an important survey that yields a lot of good information. But in this case the Bureau of Justice Statistics is doing a serious disservice in the way they are reporting the results, and they should do something about it. I hope they will consider it.
Like many surveys, the NCVS is weighted to produce estimates that are supposed to reflect the general population. In a nutshell, that means, for example, that they treat each of the 158,000 people (over age 12) covered in 2014 as about 1,700 people. So if one person said, “I was raped,” they would say, “1700 people in the US say they were raped.” This is how sampling works. In fact, they tweak it much more than that, to make the numbers add up according to population distributions of variables like age, sex, race, and region – and non-response, so that if a certain group (say Black women) has a low response rate, their responses get goosed even more. This is reasonable and good, but it requires care in reporting to the general public.
So, how is the Bureau of Justice Statistics’ (BJS) reporting method contributing to the racist meme above? The racists love to cite Table 42 of this report, which last came out for the 2008 survey. This is the source for David Duke’s rant, and the many, many memes about this. The results of Google image search gives you a sense of how many websites are distributing this:

Here is Table 42, with my explanation below:

What this shows is that, based on their sample, BJS extrapolates an estimate of 117,640 White women who say they were sexually assaulted, or threatened with sexual assault, in 2008 (in the red box). Of those, 16.4% described their assailant as Black (the blue highlight). That works out to 19,293 White women sexually assaulted or threatened by Black men in one year – White supremacists do math. In the 2005 version of the table these numbers were 111,490 and 33.6%, for 37,460 White women sexually assaulted or threatened by Black men, or:

Now, go back to the structure of the survey. If each respondent in the survey counts for about 1,700 people, then the survey in 2008 would have found 69 White women who were sexually assaulted or threatened, 11 of whom said their assailant was Black (117,640/1,700). Actually, though, we know it was less than 11, because the asterisk on the table takes you to the footnote below which says it was based on 10 or fewer sample cases. In comparison, the survey may have found 27 Black women who said they were sexually assaulted or threatened (46,580/1,700), none of whom said their attacker was White, which is why the second blue box shows 0.0. However, it actually looks like the weights are bigger for Black women, because the figure for the percentage assaulted or threatened by Black attackers, 74.8%, has the asterisk that indicates 10 or fewer cases. If there were 27 Black women in this category, then 74.8% of them would be 20. So this whole Black women victim sample might be as little as 13, with bigger weights applied (because, say, Black women had a lower response rate). If in fact Black women are just as likely to be attacked or assaulted by White men as the reverse, 16%, you might only expect 2 of those 13 to be White, and so finding a sample 0 is not very surprising. The actual weighting scheme is clearly much more complicated, and I don’t know the unweighted counts, as they are not reported here (and I didn’t analyze the individual-level data).
I can’t believe we’re talking about this. The most important bottom line is that the BJS should not report extrapolations to the whole population from samples this small. These population numbers should not be on this table. At best these numbers are estimated with very large standard errors. (Using a standard confident interval calculator, that 16% of White women, based on a sample of 69, yields a confidence interval of +/- 9%.) It’s irresponsible, and it’s inadvertently (I assume) feeding White supremacist propaganda.
Rape and sexual assault are very disturbingly common, although not as common as they were a few decades ago, by conventional measures. But it’s a big country, and I don’t doubt lots of Black men sexual assault or threaten White women, and that White men sexually assault or threaten Black women a lot, too – certainly more than never. If we knew the true numbers, they would be bad. But we don’t.
A couple more issues to consider. Most sexual assault happens within relationships, and Black women have interracial relationships at very low rates. In round numbers (based on marriages), 2% of White women are with Black men, and 5% of Black women are with White men, which – because of population sizes – means there are more than twice as many couples with Black-man/White-woman than the reverse. At very small sample sizes, this matters a lot. But we would expect there to be more Black-White rape than the reverse based on this pattern alone. Consider further that the NCVS is a householdsample, which means that if any Black women are sexually assaulted by White men in prison, it wouldn’t be included. Based on a 2011-2012 survey of prison and jail inmates, 3,500 women per year are the victim of staff sexual misconduct, and Black women inmates were about 50% more likely to report this than White women. So I’m guessing the true number of Black women sexually assaulted by White men is somewhat greater than zero, and that’s just in prisons and jails.
The BJS seems to have stopped releasing this form of the report, with Table 42, maybe because of this kind of problem, which would be great. In that case they just need to put out a statement clarifying and correcting the old reports – which they should still do, because they are out there. (The more recent reports are skimpier, and don’t get into this much detail [e.g., 2014] – and their custom table tool doesn’t allow you to specify the perceived race of the offender).
So, next time you’re arguing with David Duke, the simplest response to this is that the numbers he’s talking about are based on very small samples, and the asterisk means he shouldn’t use the number. The racists won’t take your advice, but it’s good for everyone else to know.
Philip N. Cohen is a professor of sociology at the University of Maryland, College Park. He writes the blog Family Inequality and is the author of The Family: Diversity, Inequality, and Social Change. You can follow him on Twitter or Facebook.


