
TW: racism and sexual violence; originally posted at Family Inequality.
I’ve been putting off writing this post because I wanted to do more justice both to the history of the Black-men-raping-White-women charge and the survey methods questions. Instead I’m just going to lay this here and hope it helps someone who is more engaged than I am at the moment. I’m sorry this post isn’t higher quality.
Obviously, this post includes extremely racist and misogynist content, which I am showing you to explain why it’s bad.
This is about this very racist meme, which is extremely popular among extreme racists.

The modern racist uses statistics, data, and even math. They use citations. And I think it takes actually engaging with this stuff to stop it (this is untested, though, as I have no real evidence that facts help). That means anti-racists need to learn some demography and survey methods, and practice them in public. I was prompted to finally write on this by a David Duke video streamed on Facebook, in which he used exaggerated versions of these numbers, and the good Samaritans arguing with him did not really know how to respond.
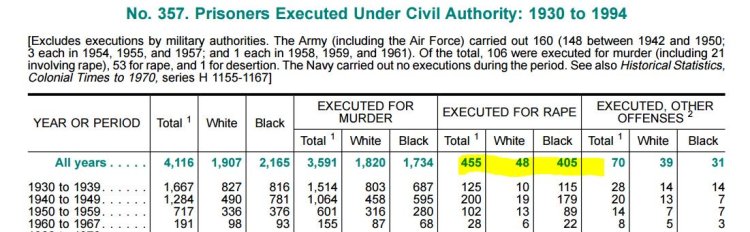
For completely inadequate context: For a very long time, Black men raping White women has been White supremacists’ single favorite thing. This was the most common justification for lynching, and for many of the legal executions of Black men throughout the 20th century. From 1930 to 1994 there were 455 people executed for rape in the U.S., and 89% of them were Black (from the 1996 Statistical Abstract):
For some people, this is all they need to know about how bad the problem of Blacks raping Whites is. For better informed people, it’s the basis for a great lesson in how the actions of the justice system are not good measures of the crimes it’s supposed to address.
Good data gone wrong
Which is one reason the government collects the National Crime Victimization Survey (NCVS), a large sample survey of about 90,000 households with 160,000 people. In it they ask about crimes against the people surveyed, and the answers the survey yields are usually pretty different from what’s in the crime report statistics – and even further from the statistics on things like convictions and incarceration. It’s supposed to be a survey of crime as experienced, not as reported or punished.
It’s an important survey that yields a lot of good information. But in this case the Bureau of Justice Statistics is doing a serious disservice in the way they are reporting the results, and they should do something about it. I hope they will consider it.
Like many surveys, the NCVS is weighted to produce estimates that are supposed to reflect the general population. In a nutshell, that means, for example, that they treat each of the 158,000 people (over age 12) covered in 2014 as about 1,700 people. So if one person said, “I was raped,” they would say, “1700 people in the US say they were raped.” This is how sampling works. In fact, they tweak it much more than that, to make the numbers add up according to population distributions of variables like age, sex, race, and region – and non-response, so that if a certain group (say Black women) has a low response rate, their responses get goosed even more. This is reasonable and good, but it requires care in reporting to the general public.
So, how is the Bureau of Justice Statistics’ (BJS) reporting method contributing to the racist meme above? The racists love to cite Table 42 of this report, which last came out for the 2008 survey. This is the source for David Duke’s rant, and the many, many memes about this. The results of Google image search gives you a sense of how many websites are distributing this:

Here is Table 42, with my explanation below:

What this shows is that, based on their sample, BJS extrapolates an estimate of 117,640 White women who say they were sexually assaulted, or threatened with sexual assault, in 2008 (in the red box). Of those, 16.4% described their assailant as Black (the blue highlight). That works out to 19,293 White women sexually assaulted or threatened by Black men in one year – White supremacists do math. In the 2005 version of the table these numbers were 111,490 and 33.6%, for 37,460 White women sexually assaulted or threatened by Black men, or:

Now, go back to the structure of the survey. If each respondent in the survey counts for about 1,700 people, then the survey in 2008 would have found 69 White women who were sexually assaulted or threatened, 11 of whom said their assailant was Black (117,640/1,700). Actually, though, we know it was less than 11, because the asterisk on the table takes you to the footnote below which says it was based on 10 or fewer sample cases. In comparison, the survey may have found 27 Black women who said they were sexually assaulted or threatened (46,580/1,700), none of whom said their attacker was White, which is why the second blue box shows 0.0. However, it actually looks like the weights are bigger for Black women, because the figure for the percentage assaulted or threatened by Black attackers, 74.8%, has the asterisk that indicates 10 or fewer cases. If there were 27 Black women in this category, then 74.8% of them would be 20. So this whole Black women victim sample might be as little as 13, with bigger weights applied (because, say, Black women had a lower response rate). If in fact Black women are just as likely to be attacked or assaulted by White men as the reverse, 16%, you might only expect 2 of those 13 to be White, and so finding a sample 0 is not very surprising. The actual weighting scheme is clearly much more complicated, and I don’t know the unweighted counts, as they are not reported here (and I didn’t analyze the individual-level data).
I can’t believe we’re talking about this. The most important bottom line is that the BJS should not report extrapolations to the whole population from samples this small. These population numbers should not be on this table. At best these numbers are estimated with very large standard errors. (Using a standard confident interval calculator, that 16% of White women, based on a sample of 69, yields a confidence interval of +/- 9%.) It’s irresponsible, and it’s inadvertently (I assume) feeding White supremacist propaganda.
Rape and sexual assault are very disturbingly common, although not as common as they were a few decades ago, by conventional measures. But it’s a big country, and I don’t doubt lots of Black men sexual assault or threaten White women, and that White men sexually assault or threaten Black women a lot, too – certainly more than never. If we knew the true numbers, they would be bad. But we don’t.
A couple more issues to consider. Most sexual assault happens within relationships, and Black women have interracial relationships at very low rates. In round numbers (based on marriages), 2% of White women are with Black men, and 5% of Black women are with White men, which – because of population sizes – means there are more than twice as many couples with Black-man/White-woman than the reverse. At very small sample sizes, this matters a lot. But we would expect there to be more Black-White rape than the reverse based on this pattern alone. Consider further that the NCVS is a householdsample, which means that if any Black women are sexually assaulted by White men in prison, it wouldn’t be included. Based on a 2011-2012 survey of prison and jail inmates, 3,500 women per year are the victim of staff sexual misconduct, and Black women inmates were about 50% more likely to report this than White women. So I’m guessing the true number of Black women sexually assaulted by White men is somewhat greater than zero, and that’s just in prisons and jails.
The BJS seems to have stopped releasing this form of the report, with Table 42, maybe because of this kind of problem, which would be great. In that case they just need to put out a statement clarifying and correcting the old reports – which they should still do, because they are out there. (The more recent reports are skimpier, and don’t get into this much detail [e.g., 2014] – and their custom table tool doesn’t allow you to specify the perceived race of the offender).
So, next time you’re arguing with David Duke, the simplest response to this is that the numbers he’s talking about are based on very small samples, and the asterisk means he shouldn’t use the number. The racists won’t take your advice, but it’s good for everyone else to know.
Philip N. Cohen is a professor of sociology at the University of Maryland, College Park. He writes the blog Family Inequality and is the author of The Family: Diversity, Inequality, and Social Change. You can follow him on Twitter or Facebook.
Comments 154
Jay — October 17, 2016
Great points all around. I think two points would further strengthen your argument about that infamous Table 42. First, there is an asterisk next to the TOTAL column of black sexual assault victims, which means that they had fewer than 10 black female victims overall! Secondly, by their estimates for black victims, 25.2% of the offenders were of an unknown or unavailable race. In combination with your points, it's quite clear that BJS should not publish these wildly speculative and unreliable numbers.
jonathon wisnoski — October 17, 2016
Really interesting article. But I am pretty shit at stats, when you say "yields a confidence interval of +/- 9%" I assume that means something along the lines of the confidence that the data is correct within 1 standard deviation (aka 30-ish percent)?
I completely agree that the confidence of the data should be pointed out better, but that 9% would turn into near certainty if he care less about how precise the result is. 19,293 is unlikely to be all that close to the real number, but if are asking the question of how like is it that between 5K and 35K white women got raped by black men on year X, that would likely probably show a very solid confidence level.
And you yourself talk about multiple studies. Any single study, no matter how big of a confidence is, is always suspect. But when different studies all find the same sort of result, the confidence we have in the result grows.
Megan — October 17, 2016
I really want to understand this article because I think it is important but I am having a very hard time following.
marcio — October 17, 2016
Great article! Informative and objective, thanks for that!
Katharina — October 18, 2016
I really admire your effort against bad statistics ? But I was wondering if it wouldnt be way easier to just point out that there were a lot more rapists identified as white? And does this table deal only with women?
ROBERT GUMEDE AFFECTED BY RACISM AT A GOLF CLUB - UVIM — October 26, 2016
[…] How the Bureau of Justice Statistics Launched a White Supremacist Meme […]
David Sims — December 25, 2016
There's currently a very sly attempt to discredit a perfectly correct (and "racist") demonstration that proves blacks are much more likely to commit rape, as compared with whites.
Here's one of the web pages where this mendacious effort is being ventilated:
http://www.businessinsider.com/stupid-racist-meme-rape-blac…
The author of this attempted fraud is Philip Cohen, whose message is essentially that the racists made too much of data reported in the National Crime Victimization Survey (NCVR). Specifically, he accuses racists of basing a large conclusion on small evidence.
Table 42 of the NCVR shows that for the crime of rape/sexual assault,
74.9% of white victims were attacked by white offenders
16.4% of white victims were attacked by black offenders
74.8% of black victims were attacked by black offenders
zero% of black victims were attacked by white offenders
Certain racists, including David Duke, used these statistics to emphasize the much greater frequency of black-on-white rape, as compared with white-on-black rapes.
Philip Cohen says that this is improper because the latter three lines (above) had a sample size of 10 or fewer cases, and the racists reached their conclusions through a wild extrapolation from an overly small sample size.
However, and as Philip Cohen is probably already aware, the NCVS isn't the only federal source of crime statistics. The FBI's Uniform Crime Reports supply an independent source in the form of arrest data, broken down by race and by crime, that doesn't suffer from the problem of small sample size.
For example, in the FBI's publication "Crime in the United States 1995," in Table 43, you can see that, in 1995, a total of 26519 forcible rapes became known to law enforcement. Of those rapes, 14739 were committed by a mixed group of white and mestizo offenders. (As offenders, mestizos are categorized as whites by the FBI.) Another 11234 rapes were committed by black offenders.
Applying the usual correction, in which we assume that one-fourth of rapes assigned to "whites" were, instead, perpetrated by mestizos, we can estimate that the mestizos were perpetrators of 3685 forcible rapes, whereas real whites were perpetrators of 11054 forcible rapes, in the United States in 1995.
In 1995, (real) whites outnumbered blacks in the US population by a ratio of 6.127. Therefore, the black-to-white per capita rate ratio for the perpetration of forcible rape, in the United States in 1995, was 6.227.
What Philip Cohen is doing is called obfuscation. By pretending to clear away misinformation, he is actually creating it. The racists are generally right about the much higher per capita rate for rape perpetration among blacks. Leftists like Cohen are trying to put the genie of racial truth back into a bottle that they can control, and then hide it away again.
Shawn Mary Reid — April 18, 2017
Labels have destroyed humanity . Men are men women are women .
kingfrak — June 22, 2017
Well, if you look at interracial violent crime in general,Blacks are the perpetrators 84.9 percent of the time, and when Whites commit violent crimes, they choose blacks as their victims about 3.6 percent of the time. So, why would the rape statics be so vastly different when removed from assault, murder, robbery, etc..?
lolol — June 29, 2017
"facts are racist"
John Lathrop — July 2, 2017
A Marxist trying to spin statistics, because facts are racist. Especially "problematic" are IQ and crime statistics. Those numbers must be wiped out of existence if cultural Marxism is to bring down Western society, so a communist dystopia can take over. The thinly-veiled Marxist "Frankfurt School" brought this disease to the US during WW2, by German Jews. Hmmmm, "Kohen"; I wonder what that would be...
Louis Byron — July 9, 2017
You libs and SJW's can go on and on all you want about the White Man's misuse of statistics or racial bias in research but the fact remains: more & more White folks are becoming "race realists" and coming to the conclusion that Race does INDEED matter. Not that racial differences are the be all and end all for the analysis of human behavior but that race does indeed play a significant role in our behaviors and how we interact with one another. To think that the average Black woman should be fearful of walking through a White neighborhood of being violently attacked and sexually assaulted by the White men there is downright laughable (and privately, out of the earshot of White folks, many Black folks will admit as much). 100, 150 years ago...yes, things were much different. I get that. But we are talking about interracial rape in 2017 not 1917 or 1873.
Kelly Sylvester — July 21, 2017
Well thought out. Well explained.
No surprise that this version has not "caught fire ".
A black woman — July 22, 2017
Alright so what are you going to do when actual representative data of the black population is presented to you and doesn't disagree with the figures above? Find more reasons to deny reality? More ways to perform mental gymnastics and blame white people?
John von Shepard — July 27, 2017
All black need to go back to Africa.
Lunad — July 27, 2017
The National Crime Victimization Survey in general is a poor measure of rape statistics. Because the context of the survey is crime, and a lot of victims don't think of their experience as a crime (however damaging it may be to them), you are going to get very low reporting rates, particularly for partner-rape.
Ryan S — August 17, 2017
So even if we are generous and give two standard deviations of error, once you factor the population rate of white and blacks, this still holds true as a very alarming statistic.
Wil Clemens — August 30, 2017
Every time anything is posted negative about African American's its a racist KKK site
dave4848 — September 8, 2017
According to this article, "Rape and sexual assault are very disturbingly common".... I'm not sure how the author arrived at this conclusion since the official rate inside the survey says rape/attempted rape rate is .7 per 1000 (regardless of color). That makes rape so rare that it is little wonder the sampling is less than 10.
stevesailer — September 11, 2017
The simple solution to sample sizes too small in a single year for reliability would be to aggregate across multiple years. For example, the Obama Administration could have answered this question definitively using many years of data. Instead, the Obama Administration chose to stop publishing this data.
Why?
stevesailer — September 11, 2017
Here's a new article in The Atlantic pointing out what a large percentage of campus rape accusations are of black male on white female sexual assault:
https://www.theatlantic.com/education/archive/2017/09/the-question-of-race-in-campus-sexual-assault-cases/539361/
William_JD — September 11, 2017
The modern racist uses statistics, data, and even math.
In this case, though, you're talking about anti-racists who object to the sexual violence directed at one race (white) by another (black).
ModeratePost — September 19, 2017
This article is bona fide mental gymnastics to twist something that simply CANT BE because of ideological bias. And I think the author of this essay very well knows this.
Jeremy Ashley — September 30, 2017
The bureau shouldn’t publish this at all. It’s not factual, it’s not accurate, it’s not a large enough sample size to qualify as representative, and it has nothing to do with justice.
Okaro — October 6, 2017
The truth is racist. Whether the figure is exactly zero is irrelevant. There is a clear disparity in interracial rape.
BlackSuperman — November 6, 2017
Just to clarify something.
http://movingtoendsexualassault.org/information/myth-vs-fact/
https://www.usnews.com/news/blogs/data-mine/2014/09/05/cdc-1-in-5-women-raped-often-by-someone-they-know
Paul Rain — December 8, 2017
Lol. And yet we also have common sense, which tells us that there are very, very few black women who are attractive (not that that stops blacks from commonly raping eighty year old white women, although even they are better looking than most black women).
Charles Charlemagne — January 4, 2018
Literally Soviet style propaganda...the left is the most dangerous threat to the flow of accurate information in America. They will try to toss ANY facts that hurt the feelings of their protected classes out the window while demonizing "white men" at every turn. These dangerous leftists are truly a plague on our society. Indoctrinating our youth with PC nonsense
G M — January 9, 2018
You dingleberry! The sample size was so low precisely BECAUSE there were so few black women raped. Ugh...
Theodore Lewis — April 11, 2018
Yeah jus likes don't want addmit that its David duke former kkk and thats who you are going say is right with satistic wow thats why the devils is perfect name for alot whites.
Phil — April 16, 2018
So what you're saying is the stat is true.
I like the truth — April 25, 2018
I would like a simple answer to the question . How many white women are raped by black men every year . I know 2 white women who were raped by black men they did not know. So how often? How many times a year ? The FBI and DOJ. know these numbers. The most accurate are obtained by witnesses police reports. We know through police reports that more blacks break into white homes annually. A woman in a home broke into by black men would obviously be a target. Amanda Blackburn ringing any bells? Broke in to rob - found a pregnant white woman , raped her and shot her in the head.
Lyle Waller — May 22, 2018
This is horrible! White racists using facts to support a position? This is the paramount of "antisemitism".
Billy Lone Bear — May 26, 2018
"The modern racist uses statistics, data, and even math."
Questions are even better.
Do you think if a white man raped a black woman that wouldn't get national jews coverage?
Additionally, can anyone remember the last black man on white woman rape that's been a national scandal?
Ace Walker — June 22, 2018
I'm trying to figure out what facts these so called race realists think they have. The far right will always act as if no response fully addresses what they have said. This guy Philip N. Cohen fully debunked their conspiracy, but all they can say is "Jews this" and "Leftists that". Neither of those are arguments against Cohen. As for the guy named David Sims up top in the comment section, his rebuttal is even more bizarre.
He says
"Philip Cohen says that this is improper because the latter three lines (above) had a sample size of 10 or fewer cases, and the racists reached their conclusions through a wild extrapolation from an overly small sample size.
However, and as Philip Cohen is probably already aware, the NCVS isn't the only federal source of crime statistics. The FBI's Uniform Crime Reports supply an independent source in the form of arrest data, broken down by race and by crime, that doesn't suffer from the problem of small sample size"
Um earth to David, the FBI statistics doesn't even support the racists (as you say) point either. What exactly are you bringing them up for? Even the people who made this survey have admitted it is inaccurate.
"For example, in the FBI's publication "Crime in the United States 1995," in Table 43, you can see that, in 1995, a total of 26519 forcible rapes became known to law enforcement. Of those rapes, 14739 were committed by a mixed group of white and mestizo offenders. (As offenders, mestizos are categorized as whites by the FBI.) Another 11234 rapes were committed by black offenders"
Um no David these are arrests of blacks...not convictions. It's common knowledge people are arrested, questioned, and if to be the likely to be the suspect they will be charged. The fbi itself states that arrests in the study do not mean convictions. In any case a fraction of them were likely convicted. However since blacks are the main group falsely accused and wrongfully convicted of rape that also puts some complications in the justice systems records of convictions.
On top of that you can clearly see that the number of rapes by whites exceed all other groups.
"What Philip Cohen is doing is called obfuscation. By pretending to clear away misinformation, he is actually creating it."
No David what you're doing is denying reality. It's is clear there is something wrong with this survey. No amount of blaming leftists will change that.
With all that said, good job Mr. Cohen for exposing White supremacist lies.
Dude — July 12, 2018
The only study I know of that breaks down the characteristics of reported rapes (and other criminal incidents) as opposed to estimates (from surveying victims) is the NIBRS. Keep in mind however that right now it only covers a third of the U.S population.
https://www.ojjdp.gov/ojstatbb/ezanibrsdv/asp/display_vov.asp
Make of it what you will.
Anonymous — October 10, 2018
The sad part is you’re as bad as the “racists” when it comes to the stats. The “racists” are using the stats presented, while leaving off the + or - ratio from the key, you’re using the + or - ratio while leaving out the stats. You’re as bad as those you condemn.
Real Truth — October 22, 2018
The National Crime Victim Survey stopped publishing the full report in 2009
What could have happened in 2009 that would have prompted that?
Perhaps Barack Obama becoming president and wanting to promote the false narrative of Black Victimization...... .You think.
I was able to find full reports post 2009 until yesterday.
They have all been scrubbed from the internet now.
Why do you think that is?
You can no longer pull up "TABLE 42" on The National Crime Victim Survey.
The complete report is no longer available.
Why do you think that is?
Anyone that thinks this is a (((Kohensidence))) is either brainwashed, a mudblood or Black.
Cleo35 — November 20, 2018
Why are they so much uproar over the statistics. You would think people would be happy that white men are not raping black women.
No star said white men don’t rape women, just not black women, as a black woman that statistic is reassuring and not racist to me in the least bit. And it makes perfect sense there is a ton more of our black men with white women than the inverse.
John Smith — January 9, 2019
I'm sure the percentage of interracial rapes in which the attacker is unknown to the victim is even more lopsided. This is the reason the usual leftist bulwarks--the media, academia--go apeshit whenever they have a potential case with the great white defendent. E.g., Tawana Brawley, Duke La Crosse. The reverse, however, is common place.
JBT — April 15, 2019
Incredible how most of the backlash against this post are weak ad hominems, appeals to the Jewish Question, and other amateurish attempts at a refutation. Just claiming "mental gymnastics" is not a counter argument
Duh — July 9, 2019
Even taken at face value, what do the racists think is the takeaway from all this? It's not like white people don't rape anyone. Why does it matter whether the perpetrator and victim share the same race?
Anonymous — August 3, 2019
The problem with being "racist" is that people only care when it's white people being racist. You social justice warriors try to argue against racism, but in my opinion it's in bad faith because you never address one fact: Nobody likes niggers. Not even black people. That's never going to change. You just don't like it when it's white people who don't like niggers. But you know you don't like them either. No one does.
Mystery Biscuits — August 4, 2019
To elaborate on the 0.0%, it seems the 95% confidence interval for zero proportion with n samples is roughly equal to 3/n (with 1 being 100%): http://www.pmean.com/01/zeroevents.html
(This is necessary since the common confidence interval formula doesn't compute at proportion of 0.)
Taking your lower and upper bounds of n=13~27, the confidence interval could range from [0, 11.1%] to [0, 23.1%]. Now that's some USELESS metric right there.
hitler — August 12, 2019
fuck kikes
Adobe — October 26, 2019
Would you care to explain to me how it's RACIST to notice race-based-trends in criminal conduct -- especially those which may be INDICATIVE OF A GROUPS ANIMUS...?
Example:
While it's true that blacks dominate 'murder stats' in ALL circumstances -- the 'comparative frequency' of murders between blacks & whites ... does differ between acquaintances vs. strangers in interracial murders.
DOJ -- INTERRACIAL MURDER STATS 1980 - 2008:
for the 63.5% in which the relationship is known. https://www.bjs.gov/content/pub/pdf/htus8008.pdf
(quick, maybe you can scramble & get these places to remove info so damaging to your plight)
WHITES who've killed BLACK-acquaintances
whites account for ~3% (range = 2% - 4% white assailants / black victim) ...
BLACKS who've killed WHITE-acquaintances
blacks account for ~7% (range = 5% - 8% black assailants / white victim) ...
PER CAPITA (blacks = 1/5th white population size) & committing ~2x the murders = 10 x the white-rate
(consistent w other murderers stats)
4% of BLACKS murdered were killed by whites who were strangers.
Range = 3% - 5%
19% of WHITES murdered were killed by blacks who were strangers.
Range = 18% - 20%
So ... 1/5th !! the population size killed 4x as many, statistically ... is that 20x ..? Does it matter if it's 14x or 21x ..?? ITS A LOT!
WHAT if not ANIMUS explains this? Presumably blacks who are acquaintances with whites isn't as decisive as something else ... hatred maybe? YOU TELL ME, sir. 2x would be too much, right?? 1.3x would be TOO MUCH. Right !? WHAT JUSTIFIES THIS? And WHAT in the realm of "white supremacy" allegations, even REMOTELY rises to the THREAT that this clearly does?
Wanna see MEDIA BIAS !?? Look at this USNews.com article.
REMEMBER: Both white & black murders go up by 22%:
The statistics show that the 500 killings of white people attributed to blacks last year were the most since black perpetrators were determined to be responsible for the homicides of 504 white people nationwide in 2008. Last year's total was up 12 percent from the 446 recorded in 2014 and 22 percent from the 409 seen in 2013, a year that saw the lowest total this century and one that capped seven years of general declines in black-on-white homicides. Prior to that, 2006 saw the most black-on-white killings since 2001, with 573.
The 229 black lives taken by white killers last year, however, marked an even larger leap from 2014, jumping more than 22 percent from the 187 black victims killed by whites that year, which was the second-lowest total since 2001. The tally was last exceeded in 2008, when 230 blacks were slain by whites. The highest total in the last 15 years came in 2007, when 245 black people were killed by whites.
Did you see that black murderers are referred to in the passive voice?
And whites are vilified to the extent linguistically possible?
'statistics show' -- (the 200% greater volume and 10x statistical rates?)
500 killings of white people -- (could this be more understated?)
'attributed to' -- (bc even though they're convicted we're "unsure"??)
blacks last year were the most since black perpetrators were "determined to be responsible" ... (What IS this sentences goal?)
See all that [soft-pedaling] to downplay culpability & make it & devoid grounds for outrage? See if that's consistent ...
"black lives taken by white killers last year" -- (Did it say "BLACK MURDERERS KILLED 10x THE RATE OF WHITES) above?
...lives were TAKEN! -- (I'm surprised they didn't show pictures of their abandoned kids)
...SLAIN by whites ... (same writing style, right ..??)
...when 245 black people were killed by whites. -- (again, active voice, clear culpability to inflame anger).
By the way -- that 22% ...
as it pertains to whites is EASIER to change bc the population is larger and the number is so small.
...from 187 - 229, a total of 43-more.
VERSES:
... 500 !!! KILLINGS -- Up from 446 ... aka, EVEN FREAKING GREATER, by a smaller group!! of a BIGGER NUMBER!
DO YOU FREAKING GET IT !????
Are you people TRYING to create a civil fucking war ??
YOU! Are contributing to this shit!
I'VE NEVER SEEN a "white supremacist movement" ..... there's just "whites who're SICK of being VICTIMIZED & called the PERP!".
BLAME SHIFTING IS GODDAMNED ANNOYING!
You're propagandists! Ignoring CULPABILITY in the deserving group and reassigning it to those who're TRYING to live in a HARMONIOUS civilization -- with reasonable, SYMMETRICAL rules.
And YOU, USNews, MSNBC & even some Wikipedia ... are cooperating to propagate a myth.
"Well, it's a low number and ... there was an asterisk, and ... I know it's a compilation of decades from which they extrapolate but, these numbers are LEVERAGED! So if the CABAL OF WHITES COOKING THE BOOKS IN THE DOJ !!........"
Oh. Wait. Doesn't the DOJ / FBI / DOC .... as does all gov. in the U.S., prefer minorities ..? And therefore, have quite a few blacks, hispanics, asians, and of course, whites -- not all of whom are going to LIE to propagate claims which require no lies -- because these people kinda believe that only whence we acknowledge WHATEVER the truth is can we fix problems that ACTUALLY exist !? Aren't the actuarials, officers, attorneys & most of all -- the administrators -- comprised of mixed ethnicities & races, who're trying to acquiesse to both political objectives (a little pandering to the claims of "white supremacists") and largely, trying to cover the actual FACTS .. ? And make sense of the actual DATA ..? By being as objective as they can?
Instead of saying "I'm a DOCTOR and your math MIGHT be bad & therefore ..... YOU FAIL to acknowledge how white men are raping blacks ..."
Really? That's going to make me racist? If I believe that white men AREN'T raping black women ? Women who're as strong as a lot of white men ? Women who aren't exactly the most feminine women ... who'll certainly yell for help ..? Whom -- websites like OK Cupid released their data of who's interested in whom -- and wouldn't you know ?? Black women -- LAST IN EVERYONE'S OPINION .. ? As if -- white men raping or not raping black women ... in any way EXCUSES BLACK MEN WHO ARE RAPING WHITE WOMEN !? When RAPE is a fucking EPIDEMIC in black-countries (and I think we can simply "agree" women aren't the rapists, I hope -- right !?)
White men -- NOT raping black women ... CHANGES THE FACT that white women ARE RAPED ?
Central park 5's innocent, huh?
(Don't WATCH their CONFESSIONS -- whatever you do)...
I DONT CARE IF YOU BELIEVE WHAT YOU SAY // MEARLY WISH IT WERE TRUE // KNOWINGLY ENGAGE IN PROPAGANDA.
WHY you obscurantists say what you say is academic; irrespective of that "mind reading" are the facts that you're WRONG.
On the other hand -- how I WISH you and others were merely honest purveyors of science. You have NO IDEA how many science lectures and series I've watched, and studied on my own volition out of endogenous "love" for the subjects and overall, for the love of knowledge.
I LOVE learning empirical facts, ESPECIALLY THOSE WHICH ARE COUNTERINTUITIVE -- AND FORCE ME TO REALIZE I WAS WRONG. Learning the follies of humans, our mental falability due to ego, common deficiencies (Confirmation biases ... etc.) ... but these days, nearly NONE of you are trustworthy unless we get out of the realm of politically charged subjects.
You guys STOPPED engaging in pure empirical facts, irrespective our feelings of them. I miss those beautiful days, in which 'truth' were all that mattered.
I'm an ATHEIST, ANTITHEIST, PRO-CHOICE ... PREVIOUS-LIBERAL (still have many liberal values) ... yet, I'm now more worried about PROTECTING people's religious freedoms than fighting them -- with one exception;
YOUR RELIGION! The LEFTISTS ideology ... POST MODERNISM.
I could probably source 80% of my claims / statements with links to irrefutable references. Beyond reproach, unimpeachable.
But also -- to places who I used to put in that category and now realize I cannot: NIH, PubMed, Wikipedia ...
all of who's data / pages / special interest groups have advancing PSEUDOSCIENCE & PROPAGANDA & and CORRUPTED their names. Which is LITERALLY. Sad.
They -- and likely you, claim I'm "biased to see blacks as scary" ... so I NON-JUDICIOUSLY regard all as "dangerous" ?? False.
I use my reason & senses. Simultaneously -- is it RACIST to know their MURDER / assault / robbery, rates ..?
Despite being but 1/8th the population size ?? (and committing 50% !! THE MURDERS !??
Pray tell, do people's IQs provide indices of crime-categories they'll commit ?
And even, IF they'll commit crime?
DO androgen levels not indicate people's aggressiveness / confidence / assertiveness !? (Money & Lunde of Hopkins)
Or are you going to say that's racist to know, also ..? (I could provide sources for literally EVERY assertion).
DO WE NOT AGREE: MEN ARE MORE VIOLENT THAN WOMEN ...?
Good ... then tell me, why do black women commit murder more often than WHITE MEN !?
https://www.theguardian.com/us-news/2016/sep/26/rate-murder-fbi-increase
(The guardian's so biased though ....... to NOT show this sort of info -- and you know it)
Please, by all means -- tell me how I'm a racist because "MY CONFIDENCE HAS SCALED WITH THE EVIDENCE" ... and how not only do I have these metrics -- but I also have my life's experiences, which would have caused me to predict these very facts ..? Tell me. Why does everything in this world view fit together so nicely -- as most sciences (synonym for TRUTH) does ... by which, it is all INTEGRATED. That's to say, if everything doesn't interact in a cohesive, predictable manner -- including the capacity to make plausible predictions of group dynamics ... why can we do that using these beliefs - yet we're told THIS is what racism is ..? Explain it all to me, Doctor.
PLEASE, DO REPLY
Fidel Key — November 12, 2019
Great post. I was checking continuously this weblog and I’m impressed! Very helpful info particularly the ultimate phase I take care of such info much. I used to be looking for this particular information for a long time. Thank you and good luck.
FJ — September 9, 2020
Cohen has well established himself as a neo-Marxist propagandist. Anyone that isn't blind as a bat knows that nearly all interracial sex assault and rape are black on white. Where are the masses of white predators of random black women? Produce them. These figures show some 50% of rapes committed by blacks, about 30,000 of them, are against white women. Don't tell us - sample too small to analyze or too big to admit to?
David Benson — September 27, 2020
This above 'article' is100% complete gas lighting bullshit like all Radical Leftist propaganda. Good luck trying to convince anyone that blacks aren't raping white women there are news stories of it in the news, everyday of the year for the last 50 years and/or trying to convince people white rape black women at the same rate! Hilarious! Blacks and Hispanics are committing NINETY PERCENT of all the rapes everyday, to see the real numbers you have to go the city and county levels such as in NYC:
https://www1.nyc.gov/assets/nypd/downloads/pdf/analysis_and_planning/year-end-2019-enforcement-report.pdf
.. scroll down to 'rape' and you see this is the case consistently every single year going back half a century. The FBI lumps most of it's Hispanics in with 'whites' because only 15 states accurately track Hispanic crime- which is why the FBI's tiny column for Hispanics is wildly misleading as well. And what does this tell us? That blacks and Hispanics are 3rd world, raping, robbing, murdering machines of pure hate, a statement you will call 'racist' as if stating facts is even a bad thing, but you clowns try to make telling the truth sound like it's worse than MURDER.
Here are more facts:
• The evidence suggests that if there is police racial bias in arrests it is negligible. Victim and witness surveys show that police arrest violent criminals in close proportion to the
rates at which criminals of different races commit violent crimes.
• There are dramatic race differences in crime rates. Asians have the lowest rates, followed by whites, and then Hispanics. Blacks have notably high crime rates. This pattern
holds true for virtually all crime categories and for virtually all age groups.
• In 2013, a black was six times more likely than a non-black to commit murder, and 12 times more likely to murder someone of another race than to be murdered by someone of another race.
• In 2013, of the approximately 660,000 crimes of interracial violence that involved blacks and whites, blacks were the perpetrators 85 percent of the time. This meant a black person was 27 times more likely to attack a white person than vice versa. A Hispanic was eight times more likely to attack a white person than vice versa.
http://2kpcwh2r7phz1nq4jj237m22.wpengine.netdna-cdn.com/wp-content/uploads/2016/03/Color-Of-Crime-2016.pdf
Marc — February 13, 2021
But how many white man do child abuse..
Black American — October 19, 2021
Racist white people in the comments and that one racist perosn that commented black people need to go back to Africa NO YOU NEED TO GO BACK TO EUROPE THIS ISNT YOUR LAND!! White people commit the most crimes and rapes at higher percentages. Conservatives pull numbers from their ass to depict black people as out of control going around raping every white person. This article is accurate and only racist people would say otherwise
Eric — October 30, 2021
It matters less to me about how prevalent back offenders rape white victims. The more significant fact is that white on black rape is rare, accounting for <3% of all interracial rape. You cannot account for that disparity with differences in race populations. I recall that figure from the 2016 DOJ reporting.
Noah Edelson — February 20, 2022
"John von Shepard" above eloquently mentioned "All black need to go back to Africa." Another post makes wind about Marxism, and another is clearly along the lines of blood libel / Goebbelspeak. Their genius is rare.. I hope. Here is some history, courtesy of Wikipedia:
In one particularly controversial 1965 incident, white civil rights worker Viola Liuzzo was murdered by Ku Klux Klansmen, who had given chase and fired shots into her car after noticing that her passenger was a young black man; one of the klansmen was Gary Rowe, an acknowledged FBI informant. After she was murdered, the FBI spread rumors that Liuzzo was a member of the Communist Party and had abandoned her children to have sexual relationships with African Americans involved in the civil rights movement. FBI records show that Hoover personally communicated these insinuations to President Johnson.
Hoover also personally ended the Federal Inquiry into the 1963 Baptist Church Bmbing by members of the Ku Klux Klan that killed four Black girls as they were reading the Bible. He was worried that the parents might actually see some semblance of justice, I guess. Hoover was the head of the FBI for nearly 50 years. If you think law enforcement and statistics haven't been tweaked along the same lines he had done in his day- you would be pretty naive.
All this said, I think Mr. Cohen's analysis is sort of dealing with a straw-man here. Obviously, Black women have been raped by White men. One of my exes had that happen to her- it was a college party / "roofies" situation- she nearly died because the rapist used too much on her. On a more amusing note; the highest prevalence of "bbc" porn and also gay porn viewership in the entire world is from/is in the Bible Belt- the heartlands of the KKK. 10 of such states only removed the hysterical "anti white slavery" laws from their state constitutions in the late 1990s, despite the fact that they were judged unenforceable / unconstitutional (federal 'big' unconstitutional) circa 1965, when we got rid of Jim Crow laws. How many White Supremacists are closet homosexual race fetishists, upset that "Black men *made* them gay"? It ain't zero percent, that's for damn sure. The funny thing is- the attraction is not mutual. Black culture is notoriously homophobic, I think probably because of religious influence. They are making progress at overcoming that kind of intolerance, though.
literally who — June 8, 2022
Nig nogs are prone to be more violent a clear lack of intelligence
bombom — January 25, 2025
Funny when marxists try to argue against statistics.