Yvonne Liu, at the Applied Research Center, told us about their report, Race and Recession, which includes a lot of useful information about the disparate effects of the economic crisis for different groups of Americans.
While an overall unemployment rate of just under 10% is bad regardless, that statistics hides the fact that Latinos and African Americans are experiencing even higher levels (note: the government agencies that the information comes from didn’t provide breakdowns for Asians or Native Americans, so the report was unable to show comparisons for those groups):
In a comment, thoughtcounts Z points out,
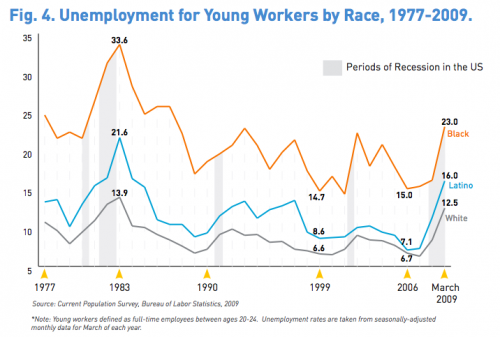
My immediate reaction…: the worst points (highest unemployment) on the “White” curve are generally around or below the best points (lowest unemployment) on the “Black” curve.
Unemployment rates for those aged 20-24:
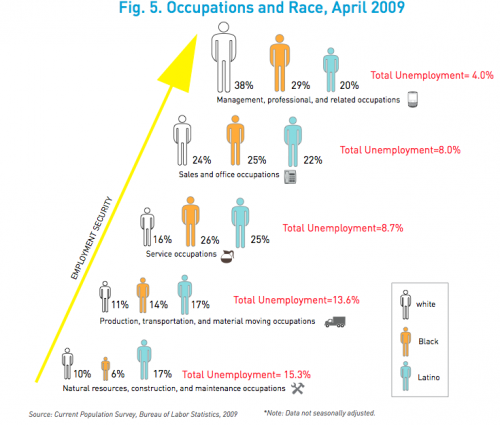
This figure indicates what % of each racial group falls into each occupational category (the median indicates that half fall above and half fall below that level):
Median earnings for each occupational category (again, the figures represent the % of each race that have jobs in that category):
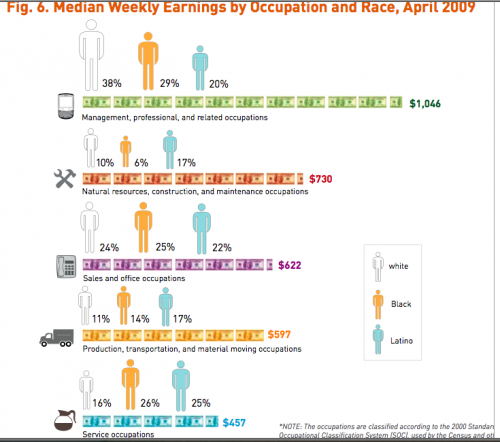
So as we see, Whites are disproportionately employed in management and professional occupations, while relatively few are employed in the service industry, whereas both African Americans and Latinos are significantly more likely to be employed in services. And while there’s a big gap between the % of Whites and Blacks in management/professional occupations, I was somewhat surprised that it wasn’t larger than it is.
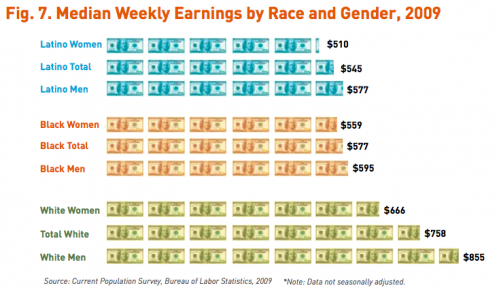
Earnings broken down by both race and gender:
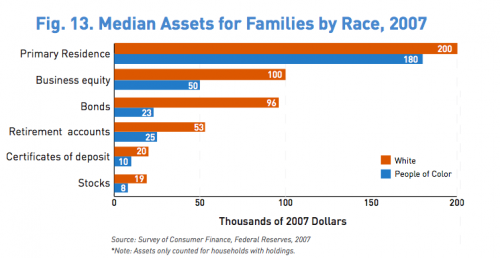
Assets by race:
See also: images of the downturn, job loss by region, unemployment by education level, another map of job loss by region, the dilemma of the duplex, not everyone knows there’s a recession, Detroit’s decline, job losses, gender and recession, and tips to the rich on how to be discreet during a recession.

Comments 20
thoughtcounts Z — November 4, 2009
My immediate reaction to the top chart: the worst points (highest unemployment) on the "White" curve are generally around or below the best points (lowest unemployment) on the "Black" curve.
Wow.
7 — November 4, 2009
where do asians fall in this study?
Evan — November 4, 2009
I hope we don't have to see many more studies that put information like this in such *ahem* black and white race terms.
Looking at this, I am not sure where me or my mixed race friends fall in this data. Also, they ignore the very real choice that many youth make - especially in low income locations of choosing "employment" via drug sales, small crime and gang activity, which often is the only employer in town.
in other words, a 20th century study using a 20th century lens.
opminded — November 4, 2009
12 million undocumented foreign workers only makes this all worse.
shale — November 5, 2009
"So as we see, Whites are disproportionately employed in management and professional occupations, while relatively few are employed in the service industry, whereas both African Americans and Latinos are significantly more likely to be employed in services. "
That is not what it is saying. It is saying that white people constitute a disproportionate share of management positions, and black people a disproportionate share of the lowest job bracket (which is interesting). But, depending on how many people are in each category, a majority of white people could still be employed in the lower categories, (which as far as I know, happens to be the case) and very many black people could be in higher categories (which is less the case, but still possible given the incompleteness of the information). The lower graphs mostly just re-iterate the first point. There are a few really f**king rich white people that screw these graphs up.
(More interestingly, as far as I know, there is plenty of inequality across races (among other things) within job categories.)
Philip Cohen — November 6, 2009
The tender breakdown is important in the employment numbers. In the current recession, Black women have lost almost twice as many jobs as a share of population than White women. I show this with today’s employment report here: http://www.familyinequality.com.
Philip Cohen — November 6, 2009
That is "gender" breakdown, which is not a tender affair (sorry).
Wednesday Round Up #89 « Neuroanthropology — November 12, 2009
[...] @ Sociological Images, Race and the Economic Downturn Great graphics and good discussion of the effects of the financial predicament for diverse groups [...]
Joblessness and the Intersection of Class and Race » Sociological Images — December 7, 2009
[...] more detailed data on this phenomenon, see our posts on race and the economic downturn, the intersection of race and criminal record, and education and unemployment. Leave a [...]
Public Perceptions of the State of the Economy And More « Welcome to the Doctor's Office — August 30, 2011
[...] and job loss, differences in optimism about the future, unemployment by race/sex/education, occupation, median earnings, and race, and the geography of job [...]