Vote Here, Vote HoyThe Moving to Opportunity (MTO) experiment is well-known in social science circles and has provided evidence that relocating residents of poor neighborhoods to more advantaged neighborhoods can have positive outcomes, especially on physical and mental health for some groups. But new evidence cited in The Atlantic this month shows that such interventions may have and unintended dark side for political participation.

MTO’s designers in the mid-1990s hoped to improve conditions of employment, education, and health of low-income families in neighborhoods with poverty rates of 40 percent or higher. The experiment included about 4,200 families in five major U.S. cities.

The chance for residential mobility was determined by lottery. Some families remained in their current public housing development. A second group received standard Section 8 housing vouchers. A third set received vouchers that could only be used toward an apartment in a low-poverty neighborhood — areas with a poverty rate below 10 percent. (Families that received vouchers weren’t obligated to use them.)

Despite good intentions, not all of the results of this mobility have been positive. Some researchers have found that moving did not improve residents’ economic well-being and arrest rates for young men actually increased. It seems that Claudine Gay, political scientist at Harvard, has pinpointed another less-than-ideal outcome: decreased political participation.

Gay examined voter registration and turnout data in the 2002 primary and the 2004 presidential election. She compared the political participation of all three Moving to Opportunity groups: those who “lost” the lottery and stayed put, those who moved with Section 8 vouchers, and those who moved into low-poverty areas (as well as those who received vouchers but chose not to move).

Her analysis turned up no negative effects with regard to voter registration, and turnout for the 2002 primary was uniformly low. But Gay did observe a much lower voter turnout in the 2004 presidential election among families that received a voucher. The effects were especially pronounced for the so-called lottery “winners”: adults that moved into low-poverty neighborhoods had a lower voter turnout by 19 percent, compared with those who “lost” the lottery…

While hang-ups in the logistics of moving, like registering to vote in a new neighborhood or not knowing your new polling place, might seem like likely culprits in the decrease, Gay offers a different explanation:

Instead, Gay reasons, the primary source of decreased voter turnout is likely the “social disruption” that occurs when a poor urban family relocates to a higher-income area. Community connections are strongly linked with political participation, and while it takes time for a new resident of any community to connect socially, that difficulty may be greater for residents whose socioeconomic profile doesn’t match that of their new neighbors.

Given the high stake that poor citizens have in many public policy decisions, Gay argues that the effects of residential mobility on political participation must not be ignored.

Working Class HeroIf you’re familiar with his previous books, Losing Ground and The Bell Curve: Intelligence and Class Structure in American Life, you won’t be surprised to learn that Charles Murray’s new book is ruffling more than a few scholarly feathers. An article in the Chronicle of Higher Education this week outlines the ruckus and a few sociologists weigh in.

The Chronicle summarizes the book:

Mr. Murray’s newest book, Coming Apart: The State of White America, 1960-2010 (Crown Forum), makes a pretense of making nice. It bills itself as an attempt to alleviate divisiveness in American society by calling attention to a growing cultural gap between the wealthy and the working class.

Focused on white people in order to set aside considerations of race and ethnicity, it discusses trends, like the growing geographic concentration of the rich and steadily declining churchgoing rates among the poor, that social scientists of all ideological leanings have documented for decades. It espouses the virtues of apple-pie values like commitment to work and family.

But Mr. Murray, a Harvard and MIT-educated political scientist, seems wired like a South Boston bar brawler in his inability to resist the urge to provoke. In the midst of all of his talk about togetherness, he puts out there his belief that the economic problems of America’s working class are largely its own fault, stemming from factors like the presence of a lot of lazy men and morally loose women who have kids out of wedlock. Moreover, he argues, because of Americans’ growing tendency to pair up with the similarly educated, working-class children are increasingly genetically predisposed to be on the dim side.

(This is the point where heads turn, fists clench, and a hush is broken by the sound of liberal commenters muttering, “Oh no he didn’t.”)

Even Murray seems to know that his conclusions and brand of social scientific analysis and commentary may not sit well in academic circles:

“I am sure there are still sociology departments where people would cross themselves if I came into the room,” he said in an interview last week.

While some sociologists, such as Claude S. Fischer, think that Murray’s book will likely not get much play in scholarly circles, Dalton Conley notes that Murray is:

“probably the most influential social-policy thinker in America” thanks to his engaging writing style and his ability to make complex ideas accessible to wide audiences. “He is like the Carl Sagan of social policy,” Mr. Conley said, “but with an ideological slant.”

A flashpoint for many social scientists has long been Murray’s use of social scientific research, methods, and rhetoric. Conley explains how Murray’s use of social science may mislead readers on both theoretical and methodological grounds:

Although his descriptions of societal problems echo a lot of research performed by other scholars, he takes leaps in naming the causes or proposing solutions. Mr. Conley …said the idea that certain values, such as religiosity, lead to financial success “is a big, big assumption that outpaces the evidence,” because social scientists cannot conclusively prove such causal relationships without conducting randomized experiments on humans.

It is entirely possible, he said, that religiosity and financial success go hand in hand not because the former causes the latter, but because the latter causes the former, or both are the product of some other force not being considered.

Katherine Newman also adds:

Most social scientists continue to argue that it is economic hardship that leads to deterioration of working-class social conditions, not the other way around. “I don’t think there is any question that Americans in the working class, and those below the poverty line, have been hammered by the economic transformations that have robbed them of stable employment, and privileged those who are really well educated, giving them access to the only good jobs we have…”

In light of this disconnect, The Chronicle argues:

At the end of the day, the cultural and economic divide most illuminated by Coming Apart might be one found in scholarly publishing. On one side are authors and publishers who produce nuanced books that offer only conclusions stemming from research, and tend to be too esoteric for wide readership. On the other side are authors and publishers who cash in by producing best-selling polemics, in which research is used to buttress foregone conclusions.

Here at TSP, we’re trying to do something to bridge this very divide!

The state of affairs
Photo by Satish Krishnamurthy, satishk.tumblr.com

The U.S. social safety net continues to grab headlines, this week in the New York Times. We’ve noted before the play programs like food stamps are getting in the current presidential campaign. The NY Times article notes that, paradoxically, “Some of the fiercest advocates for spending cuts have drawn public benefits.” Why might this be?

An aging population and a recent, deep recession seem to be at the crux of the issue.

The problem by now is familiar to most. Politicians have expanded the safety net without a commensurate increase in revenues, a primary reason for the government’s annual deficits and mushrooming debt. In 2000, federal and state governments spent about 37 cents on the safety net from every dollar they collected in revenue, according to a New York Times analysis. A decade later, after one Medicare expansion, two recessions and three rounds of tax cuts, spending on the safety net consumed nearly 66 cents of every dollar of revenue.

The recent recession increased dependence on government, and stronger economic growth would reduce demand for programs like unemployment benefits. But the long-term trend is clear. Over the next 25 years, as the population ages and medical costs climb, the budget office projects that benefits programs will grow faster than any other part of government, driving the federal debt to dangerous heights.

As a result, many Americans have benefited from government safety net programs.

Almost half of all Americans lived in households that received government benefits in 2010, according to the Census Bureau. The share climbed from 37.7 percent in 1998 to 44.5 percent in 2006, before the recession, to 48.5 percent in 2010.

Yet many do not realize that it is no longer just programs for the “undeserving poor” that dominate the scene. Rather, it’s programs such as an expanded Earned Income Tax Credit and increasing Medicare costs that have stretched safety net resources.

Medicare’s starring role in the nation’s financial problems is not well understood. Only 22 percent of respondents to the New York Times poll correctly identified Medicare as the fastest-growing benefits program. A greater number of respondents, 27 percent, chose programs for the poor.

Why the misperception? Perhaps it’s because, as political scientist Suzanne Mettler explains in her book, The Submerged State: How Invisible Government Policies Undermine American Democracy, policies in recent decades have turned from more obvious provision of cash benefits to methods such as tax breaks, incentives, and other “hidden” forms of support. As a result, most citizens  have no idea that they rely on the safety net at all.

No doubt politicians, commentators, and scholars will all continue to debate the form and function of the safety net. But everyday Americans aren’t at all sure what’s best to do.

Americans are divided about the way forward. Seventy percent of respondents to a recent New York Times poll said the government should raise taxes. Fifty-six percent supported cuts in Medicare and Social Security. Forty-four percent favored both.

As one Minnesotan profiled in the NY Times story put it, “I’m glad I’m not a politician…We’re all going to complain no matter what they do. Nobody wants to put a noose around their own neck.”


Colosseum
Since 2000, the Roman Colosseum has been lit in gold whenever a person condemned to death anywhere in the world has their sentence commuted or is released or when a jurisdiction, like the state of Illinois, abolishes the death penalty. Photo by Herb Neufeld via flickr.

Popular wisdom and those who defend the death penalty say that the most heinous crimes should be more harshly punished. But, as Lincoln Caplan points out in a recent New York Times editorial, this is simply not the case. Death sentences are far more random than that, as shown by a study of murder cases in Connecticut from 1973 to 2007.

The Connecticut study, conducted by John Donohue, a Stanford law professor, completely dispels this erroneous reasoning. It analyzed all murder cases in Connecticut over a 34-year period and found that inmates on death row are indistinguishable from equally violent offenders who escape that penalty. It shows that the process in Connecticut—similar to those in other death-penalty states—is utterly arbitrary and discriminatory.

The study revealed that, far from being blind, Lady Justice metes out harsher punishments based not on the egregiousness of crimes but more often on race and geography. These findings echo those of sociologists who have studied the death penalty, such as Scott Philips (as “discovered” in Contexts, Winter 2011). Philips examined how the victim’s social status affected whether a defendant was sentenced to death in Texas from 1992 to 1999. Results showed that if the victim was “high status” (e.g. white, no criminal record, college educated), defendants were six times more likely to be sentenced to death. Black defendants, though, whose victims tend to be of lower social status, were still more likely than others to be sentenced to death.

In light of such evidence and with the death penalty on the decline (some states, such as Illinois in 2011, have abolished it altogether) Caplan argues it’s time for this “freakishly rare,” “capricious,” and “barbaric” form of punishment to go.

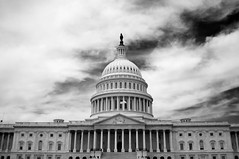
US Capitol BuildingDespite recent political bluster over shrinking the size of government, sociologist Dalton Conley and political scientist Jaqueline Stevens contend that bigger might be better. According to their op-ed in the New York Times, the House of Representatives may be too small:

It’s been far too long since the House expanded to keep up with population growth and, as a result, it has lost touch with the public and been overtaken by special interests.

Indeed, the lower chamber of Congress has had the same number of members for so long that many Americans assume that its 435 seats are constitutionally mandated.

But that’s wrong: while the founders wanted to limit the size of the Senate, they intended the House to expand based on population growth. Instead of setting an absolute number, the Constitution merely limits the ratio of members to population. “The number of representatives shall not exceed one for every 30,000,” the founders wrote. They were concerned, in other words, about having too many representatives, not too few.

Historically, House members had been added after each census up until 1920, when fear of growing numbers of “foreigners” in the population stymied expansion. As a result, US citizens may be underrepresented:

The result is that Americans today are numerically the worst-represented group of citizens in the country’s history. The average House member speaks for about 700,000 Americans. In contrast, in 1913 he represented roughly 200,000, a ratio that today would mean a House with 1,500 members — or 5,000 if we match the ratio the founders awarded themselves.

According to Conley and Stevens, increasing the number of representatives would address several concerning issues, such as the disproportionate influence of lobbyists and special interest groups; ending two-party deadlock in smaller districts; making campaigns cheaper; and lowering reliance on staffers rather than members themselves.

True, more members means more agendas, legislation and debates. But Internet technology already provides effective low-cost management solutions, from Google Documents to streaming interactive video to online voting.

Will it happen?

The biggest obstacle is Congress itself. Such a change would require the noble act — routine before World War I but unheard of since — of representatives voting to diminish their own relative power.

What do you think?

Mission accomplished! $20 worth of jalapeño cheetos
The phrase “you are what you eat” may refer to more than your physical make-up. In fact, the food in your fridge might say just as much about your social class as about your health.  Newsweek reports:

According to data released last week by the U.S. Department of Agriculture, 17 percent of Americans—more than 50 million people—live in households that are “food insecure,” a term that means a family sometimes runs out of money to buy food, or it sometimes runs out of food before it can get more money. Food insecurity is especially high in households headed by a single mother. It is most severe in the South, and in big cities. In New York City, 1.4 million people are food insecure, and 257,000 of them live near me, in Brooklyn. Food insecurity is linked, of course, to other economic measures like housing and employment, so it surprised no one that the biggest surge in food insecurity since the agency established the measure in 1995 occurred between 2007 and 2008, at the start of the economic downturn.

Growing inequality between the rich and the poor in the United States is reflected at the dinner table as well:

Among the lowest quintile of American families, mean household income has held relatively steady between $10,000 and $13,000 for the past two decades (in inflation-adjusted dollars); among the highest, income has jumped 20 percent to $170,800 over the same period, according to census data. What this means, in practical terms, is that the richest Americans can afford to buy berries out of season at Whole Foods—the upscale grocery chain that recently reported a 58 percent increase in its quarterly profits—while the food insecure often eat what they can: highly caloric, mass-produced foods like pizza and packaged cakes that fill them up quickly.

Using language evocative of sociologist Pierre Bourdieu, one epidemiologist explains:

Lower-income families don’t subsist on junk food and fast food because they lack nutritional education, as some have argued. And though many poor neighborhoods are, indeed, food deserts—meaning that the people who live there don’t have access to a well-stocked supermarket—many are not. Lower-income families choose sugary, fat, and processed foods because they’re cheaper—and because they taste good. In a paper published last spring, Drewnowski showed how the prices of specific foods changed between 2004 and 2008 based on data from Seattle-area supermarkets. While food prices overall rose about 25 percent, the most nutritious foods (red peppers, raw oysters, spinach, mustard greens, romaine lettuce) rose 29 percent, while the least nutritious foods (white sugar, hard candy, jelly beans, and cola) rose just 16 percent.

“In America,” Drewnowski wrote in an e-mail, “food has become the premier marker of social distinctions, that is to say—social class. It used to be clothing and fashion, but no longer, now that ‘luxury’ has become affordable and available to all.”

Concern about rising obesity, especially among low income communities, had led to some controversial policy proposals.

In recent weeks the news in New York City has been full with a controversial proposal to ban food-stamp recipients from using their government money to buy soda. Local public-health officials insist they need to be more proactive about slowing obesity; a recent study found that 40 percent of the children in New York City’s kindergarten through eighth-grade classrooms were either overweight or obese. (Nationwide, 36 percent of 6- to 11-year-olds are overweight or obese.)

But French sociologist Claude Fischler suggests that there might be a better way to address both food insecurity and obesity: Americans should be more French about food.

Americans take an approach to food and eating that is unlike any other people in history. For one thing, we regard food primarily as (good or bad) nutrition. When asked “What is eating well?” Americans generally answer in the language of daily allowances: they talk about calories and carbs, fats, and sugars. They don’t see eating as a social activity, and they don’t see food—as it has been seen for millennia—as a shared resource, like a loaf of bread passed around the table. When asked “What is eating well?” the French inevitably answer in terms of “conviviality”: togetherness, intimacy, and good tastes unfolding in a predictable way.

Even more idiosyncratic than our obsession with nutrition, says Fischler, is that Americans see food choice as a matter of personal freedom, an inalienable right. Americans want to eat what they want: morels or Big Macs. They want to eat where they want, in the car or alfresco. And they want to eat when they want. With the exception of Thanksgiving, when most of us dine off the same turkey menu, we are food libertarians. In surveys, Fischler has found no single time of day (or night) when Americans predictably sit together and eat. By contrast, 54 percent of the French dine at 12:30 each day. Only 9.5 percent of the French are obese.

Others suggest addressing systematic barriers to food accessibility and delivery. According to author and foodie icon Micahel Pollan:

“Essentially,” he says, “we have a system where wealthy farmers feed the poor crap and poor farmers feed the wealthy high-quality food.” He points to Walmart’s recent announcement of a program that will put more locally grown food on its shelves as an indication that big retailers are looking to sell fresh produce in a scalable way. These fruits and vegetables might not be organic, but the goal, says Pollan, is not to be absolutist in one’s food ideology. “I argue for being conscious,” he says, “but perfectionism is an enemy of progress.”

Community activists agree:

Food co-ops and community-garden associations are doing better urban outreach. Municipalities are establishing bus routes between poor neighborhoods and those where well-stocked supermarkets exist.

Joel Berg, executive director of the New York City Coalition Against Hunger, says these programs are good, but they need to go much, much further. He believes, like Fischler, that the answer lies in seeing food more as a shared resource, like water, than as a consumer product, like shoes. “It’s a nuanced conversation, but I think ‘local’ or ‘organic’ as the shorthand for all things good is way too simplistic,” says Berg. “I think we need a broader conversation about scale, working conditions, and environmental impact. It’s a little too much of people buying easy virtue.”re as well,” Berg says…

Berg believes that part of the answer lies in working with Big Food. The food industry hasn’t been entirely bad: it developed the technology to bring apples to Wisconsin in the middle of winter, after all. It could surely make sustainably produced fruits and vegetables affordable and available. “We need to bring social justice to bigger agriculture as well,” Berg says.
Rally to Restore Sanity - 8729 Sociologist R. Tyson Smith recently published an op-ed in the Philadelphia Inquirer about what he calls a growing gap between military veterans and civilians.

Following the retirement of Justice John Paul Stevens, the U.S. Supreme Court began its first term since at least World War II without a veteran on the bench. Meanwhile, in Connecticut, Senate candidate Richard Blumenthal was caught fabricating military experience in Vietnam.

These stories reflect a paradox: American civilians continue to love what veterans represent – duty, sacrifice, strength, leadership – but we have less and less true understanding of the veteran experience. Although the United States is in the 10th year of a war, veterans have become increasingly marginalized, accounting for a dwindling share of middle-class and public life.

Smith calls this the “quiet disappearance” of veterans from prominent positions in public life.

So, what’s causing this change? Smith points to the ongoing downsizing of the U.S. military and the lack of the draft.

During World War II, 16 million troops were mobilized at a time when the U.S. population was roughly 140 million. In the Vietnam era, about 3.5 million were deployed (and more than 6 million served) when the population was nearly 200 million. Today, fewer than 2 million service members have been deployed to Iraq and Afghanistan from a population of more than 310 million.

So, since World War II, the proportion of the populace deployed to a recent war has dropped from about 11 percent to less than 1 percent. No wonder veterans refer to themselves as “the less than 1 percent.”

Citing evidence from political science, Smith also notes that socioeconomic status plays a role.

In their book The Casualty Gap, political scientists Douglas Kriner and Francis Shen show that since the Korean War, poorer communities have suffered a disproportionate share of the nation’s wartime casualties. Given this trend, it’s hardly surprising that the number of members of Congress with children serving in combat is in the single digits.

This gap matters for two reasons, according to Smith.

First, veterans and the consequences of war are much easier to ignore when those fighting come from marginalized communities. Many Americans are insulated from the people we expect to die on our behalf.

Second, veterans’ successful readjustment to civilian life depends on social support. Such support usually begins with sharing the war experience and interacting with sympathetic civilians. This is harder to do as vets become more alienated and isolated.

Bathroom SinkThe recent ending of several long-running daytime soap operas has social scientists discussing the reasons for this TV genre’s decline and its legacy. According to the Christian Science Monitor:

Soap operas, that staple of the daytime television schedule, have taken it on the chin lately. Two titans of the genre – “Guiding Light” and “As the World Turns,” ended impressive runs in the past year. “World,” which went dark Sept. 17, wrapped 54 years of fictional history for the folks of Oakdale, Ill. And “Light,” which began as a radio show in the 1930s, spanned nearly three-quarters of a century by the time it was dropped a year ago. These departures leave only six daytime “soaps” on the three broadcast TV networks (ABC, NBC, CBS), down from nearly two dozen at the height of demand for the daily serials.

One factor could be the move of more women into work outside the home.

The daily, quick serialized story, born and sponsored on radio by soap companies primarily to sell laundry products to housewives at home during the day, has evolved in lock step with the changing lives of that target female audience, says sociologist Lee Harrington from Miami University. “Serialized storytelling has been around for thousands of years but this particular, endless world of people, who could almost be your real neighbors they feel so temporal and all present, is disappearing,” she says, as women have moved into the workplace and out of the home during the day.

Adds a professor in communication studies:

These prime-time shows have incorporated the focus on character and emotion that endeared the soap operas to women, says Villanova University’s Susan Mackey-Kallis. But, she adds, just as women’s interests have expanded beyond the home to incorporate careers and public lives, “their taste in entertainment has expanded to include more interweaving of character with traditional plot-driven stories.”

But other experts are quick to acknowledge the debt owed to daytime soaps by other forms of television entertainment.

The handwriting began appearing on the wall as prime-time storytellers began to adapt the techniques of the daily soap to weekly evening dramas, which were predominantly episodic and plot-driven, says media expert Robert Thompson, founder of the Bleier Center for Television and Popular Culture at Syracuse University in Syracuse, N.Y. Seminal shows from “Hill Street Blues” through “The Sopranos” owe a debt to the character-heavy, serialized storytelling techniques of the soap opera genre, he adds.

“The daytime soaps really gave birth to the great narrative elements we now see in the highly developed prime-time dramas,” he points out.

A new study shows higher rates of suicide among middle age adults in recent years. CNN reports:

In the last 11 years, as more baby boomers entered midlife, the suicide rates in this age group have increased, according to an analysis in the September-October issue of the journal Public Health Reports.

The assumption was that “middle age was the most stable time of your life because you’re married, you’re settled, you had a job. Suicide rates are stable because their lives are stable,” said Dr. Paula Clayton, the medical director for the American Foundation for the Prevention of Suicide.

But this assumption may be shifting.

A sociologist explains:

“So many expected to be in better health and expected to be better off than they are,” said Julie Phillips, lead author of the study assessing recent changes in suicide rates. “Surveys suggest they had high expectations. Things haven’t worked out that way in middle age.”

Further,

Baby boomers (defined in the study as born between 1945 and 1964) are in a peculiar predicament.

“Historically, the elderly have had the highest rates of suicide,” said Phillips, a professor of sociology at Rutgers University. “What is so striking about these figures is that starting in 2005, suicide rates among the middle aged [45-64 years of age] are the highest of all age groups.”

The 45-54 age group had the highest suicide rate in 2006 and 2007, with 17.2 per 100,000. Meanwhile, suicide rates in adolescents and the elderly have begun to decline, she said.

“What’s notable here is that the recent trend among boomers is opposite to what we see among other cohorts and that it’s a reversal of a decades-long trend among the middle-aged,” said Phillips, who along with Ellen Idler, a sociologist at Emory University, and two other authors used data from the National Vital Statistics System.

Several theories have been proposed to explain this trend, including higher suicide rates among boomers during adolescence.

Baby boomers had higher rates of depression during their adolescence. One theory is that as they aged, this disposition followed them through the course of their lives.

“The age group as teenagers, it was identified they had higher rates of depression than people born 10 or 20 years earlier — it’s called a cohort effect,” said Clayton, from the American Foundation for the Prevention of Suicide, who read the study.

Others cite health concerns:

Some say health problems could be a factor in increased suicide rates among baby boomers.

Boomers have their share of medical problems such as high blood pressure, diabetes and complications of obesity.

“There’s a rise of chronic health conditions among the middle aged,” Phillips said. “In the time period from 1996 to 2006, we see fairly dramatic chronic health conditions and an increase in out-of-pocket expenditures.”

Some speculate that the increase in baby boomer suicides could be attributed to stress, the number of Vietnam veterans in the age group or drug use, which was higher in that generation. Boomers are also the “sandwich generation,” pressed between needs of their children and their aging parents who are living longer, but have health problems like Alzheimer’s or dementia.

Finally, economic woes may be to blame.

All this is unfolding in a lagging economy, meaning boomers could be affected by the “period effect.”

“One hypothesis is that the economic pressure during this period might be a driving force, with the recession in the early 2000s — loss of jobs, instability, increases in bankruptcy rates among middle age,” Phillips said.

Unemployment correlates with increased rates of suicide. People who are unmarried and have less education are also more at risk.

Baby feet!The birth rate in the United States hasn’t been this low in 100 years, leading social scientists to speculate on the role the Great Recession might be playing in family planning. The Associated Press reports:

The birth rate dropped for the second year in a row since the recession began in 2007. Births fell 2.6 percent last year even as the population grew, numbers released Friday by the National Center for Health Statistics show.

“It’s a good-sized decline for one year. Every month is showing a decline from the year before,” said Stephanie Ventura, the demographer who oversaw the report.

The birth rate, which takes into account changes in the population, fell to 13.5 births for every 1,000 people last year. That’s down from 14.3 in 2007 and way down from 30 in 1909, when it was common for people to have big families.

A sociologist explains how the falling Dow might relate to declining birth rates:

“When the economy is bad and people are uncomfortable about their financial future, they tend to postpone having children. We saw that in the Great Depression the 1930s and we’re seeing that in the Great Recession today,” said Andrew Cherlin, a sociology professor at Johns Hopkins University.

“It could take a few years to turn this around,” he added.

The birth rate dipped below 20 per 1,000 people in 1932 and did not rise above that level until the early 1940s. Recent recessions, in 1981-82, 1990-91 and 2001, all were followed by small dips in the birth rate, according to CDC figures.

Despite this trend, there is no need to panic.

Cherlin said the U.S. birth rate “is still higher than the birth rate in many wealthy countries and we also have many immigrants entering the country. So we do not need to be worried yet about a birth dearth” that would crimp the nation’s ability to take care of its growing elderly population.