race/ethnicity: Latinos

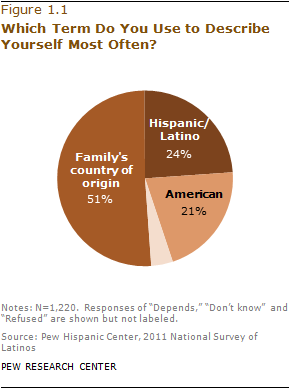
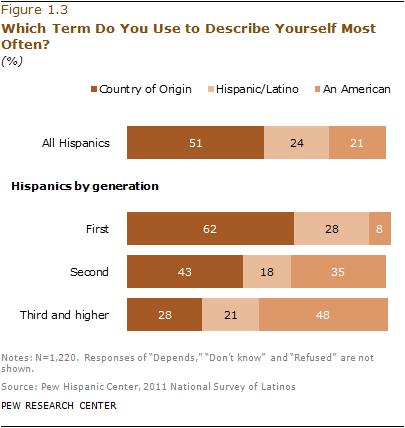
In 1970, the U.S. Census added a “country of origin” question to its demographics section, which asks respondents if they are “of Hispanic, Latino, or Spanish origin.” But a new Pew Hispanic Center report indicates that, while these might be the official terms for those from Spanish-speaking countries and/or Latin America, they aren’t the preferred or most popular labels among those they’re supposed to identify. Only about 1 in 4 use the terms Hispanic or Latino most frequently to describe themselves:

Not surprisingly, identification with different labels differs among recent immigrants and those born in the U.S. Among the first generation, country of origin is the overwhelming preference, but by the third generation, just over 1 in 4 choose that as their most common self-identifier:

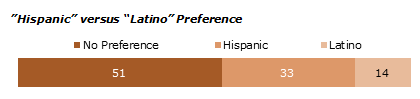
Most respondents had no preference between the terms Hispanic or Latino, but for those who did, Hispanic was more popular:

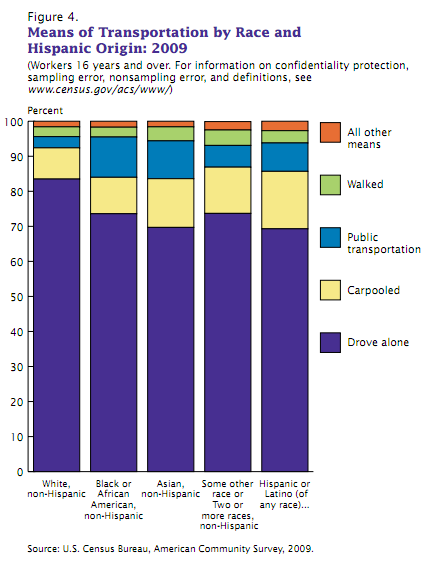
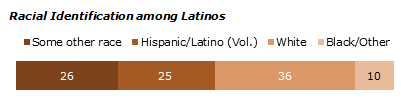
White was the most commonly-chosen racial identification:

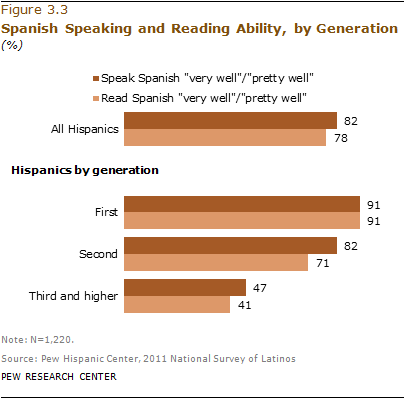
Most respondents also said that while they think it’s important that Hispanics be able to speak Spanish in the U.S., that learning English is very important for success. By the second generation, almost all rate themselves as knowing English “pretty” or “very” well:

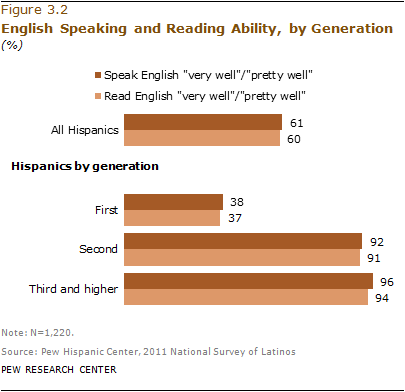
Conversely, among third-generation Hispanics, under half say they speak or read Spanish equally well:

Check out the full report for tons of additional information on identification, language use, etc.

The people over at Sociological Cinema did an interesting experiment, searching Google images for the continents.  Tell us what you see:

“European”:

“North American”:

“South American”:

“African”:

“Asian”:

Lisa Wade, PhD is an Associate Professor at Tulane University. She is the author of American Hookup, a book about college sexual culture; a textbook about gender; and a forthcoming introductory text: Terrible Magnificent Sociology. You can follow her on Twitter and Instagram.

Cross-posted at Global Policy TV.

Recent research has unearthed the interesting finding that most Americans dislike atheists.  In fact, they strongly dislike atheists. Surveys suggest that they’d rather share a beer with almost anyone, even members of historically-hated groups: homosexuals, African-Americans, or Muslims (yes, even after 9/11).  This phenomenon is new in American society, as I’ll discuss below, and reflects a significant change in our social alliances.

But first, consider this data published by Penny Edgell and her colleagues in the American Sociological Review (full text).  It reveals that Americans believe that atheists, more than many other groups, are not likely to agree with their “vision of American society.”  Atheists topped the list, beating out the second contender, Muslims, by 13 percentage points.  Likewise, among the types of people Americans would not want their children to marry, atheists come first, beating out Muslims (again) by 14 points and African Americans by a full 20.

This dislike for atheists, by the way, isn’t on the wane.  While dislike of gays and lesbians has been easing, racism has become increasingly unacceptable, and religious diversity has become less contentious, intolerance for non-believers has held steady.

An even more recent article revealed that the reason people dislike atheists so much has to do with trust (cite).  Many people are skeptical that someone who doesn’t believe in God would do the right thing, given that they don’t imagine that a higher power is watching them and keeping score.  Atheists were more distrusted than Muslims, Jews, gay men, and feminists.  The only group that was as strongly suspected of bad behavior as atheists?  Rapists.

What is interesting in all this – above and beyond a clear prejudice against atheists – is the change in how Americans think about religion.  Until recently, members of different religious saw each other as enemies, not friends.  American history is characterized by “long-standing divisions among Protestants, Catholics, and Jews” (Edgell et al.). Many of us can remember how significant it was to elect the first Catholic president (something we take for granted as unremarkable now) and we are on the precipice of nominating a Mormon to run on the Republican ticket.

Indeed, historical data shows that Americans have been increasingly willing to vote for a Catholic or Jewish Presidential Candidate (as well as an African American and homosexual candidate), but their willingness to vote for an atheist is lagging behind:

The take home point has to do with shifting social alliances.  Now that most Americans have abandoned a strong dislike for members of other religions, it’s possible for The Religious to emerge as a socially-meaningful identity group.  In other words, once members of different religions begin to see each other as the same instead of different, they can begin to align together.  Suddenly atheists become an obvious foe.  Instead of one of many types of people who had lost their way (along with people of different faiths), atheists could emerge as uniquely problematic.  It is the building of cross-religious alliances, then, that undergirds the strong dislike for atheists specifically.

Lisa Wade, PhD is an Associate Professor at Tulane University. She is the author of American Hookup, a book about college sexual culture; a textbook about gender; and a forthcoming introductory text: Terrible Magnificent Sociology. You can follow her on Twitter and Instagram.

Amid accusations of racism, the European Union (EU) has withdrawn a two-minute video designed to raise awareness about Neighbourhood Policy,” an approach to establishing “deeper relations” with neighboring state the need for unity among EU nations and acceptance of candidate states hoping to enter.  In the video, sent to us by Claire P., the EU is personified by a white woman, who is facing attacks from all sides.

Bruno Waterfield, writing for the Telegraph, describes the scene:

First the EU heroine… is menaced by a Chinese Kung Fu master. Then a second threat appears as a urbaned practitioner of Kalaripayattu, a southern Indian martial art, levitates towards her brandishing a scimitar.

As she turns to face the new menace, a third black assailant with dreadlocks cartwheels aggressively towards her before striking a Capoeira pose, the Brazilian martial art.

Here’s screenshots of all of them, but for the full effect, you’ve got to watch (if just for the music and sound effects):

At this point, the woman takes a deep breath, multiples to represent the many states in the EU, and models peaceful behavior that her would-be attackers adopt.

The EU is expressing surprise that a video featuring a peaceful white person and violent, dangerous dark-skinned people might be considered racist.  They have released a classic non-apology that privileges intent over impact, denies that the clip was actually racist (it has just been “perceived” so), and identifies the main problem as other people (who got all hypersensitive and “felt offended”):

The clip was absolutely not intended to be racist and we obviously regret that it has been perceived in this way. We apologise to anyone who may have felt offended. Given these controversies, we have decided to stop the campaign immediately and to withdraw the video.

UPDATE: Reader Katrin says the video was about increasing integration and cooperation of states and the European Commission’s enlargement policy, not about the “neighborhood” policy as reported by the Telegraph:,

It was for greater unity of existing EU member states (which is why the video is entitled “Growing Together”) and candidates for membership (which is why it says “the more we are the stronger we are”) in order to show a united front to the rising powers China, India and Brazil. It was intended to portray that if the EU acts united, then China, India and Brazil will be willing to engage with the EU constructively…Current candidates of accession are e.g. Iceland, Macedonia, Montenegro, Turkey and Serbia. Enlargement and unity as a tool for greater power when facing rising economies was the intended message of the clip, not the ENP.

Lisa Wade, PhD is an Associate Professor at Tulane University. She is the author of American Hookup, a book about college sexual culture; a textbook about gender; and a forthcoming introductory text: Terrible Magnificent Sociology. You can follow her on Twitter and Instagram.

Cross-posted at Thick Culture.

As of the 2010 Census, Latinos represent 17 percent of the US population, but are woefully underrepresented in traditional forms of political participation like voting and making campaign contributions. The Pew Hispanic center reports that while Latinos represented 21% of all eleigible voters in 2010, they accounted for only 6.6% of midterm election voters.

One area where Latinos are more likely to participate when compared to non-Latino whites is in outsider forms of participation like protest activity. This form of activity became synonymous with Latino political participation during the 2006 Grand Marcha where 500,000 protesters packed streets to protest immigration bills. A 2006 CIRCLE study finds that Latino youth, while not engaged in formal types of participation were much more likely to report having engaged in a protest:

Although young Latinos are generally not as engaged as other racial/ethnic
groups, 25% said that they had participated in a protest—more than twice the
proportion of any other racial/ethnic group.

By comparison, only 11% of all youth surveyed had reported taking part in a protest. The accounts for why Latinos protest more than other groups vary but a main causal fator is the lack of access to formal political channels, particularly for non-citizens and undocumented immigrants. Lisa Martinez (2008) points out that Latinos are less likely to engage in protest activity when they live in places with high numbers of elected officials. Is the increase in Latino political engagement via protest simply the result of demographic realities (e.g. residents can’t vote) or is it a leading indicator of an overall dissatisfaction with politics?

——————————

Jose Marichal, PhD, is an assistant professor of political science at California Lutheran University. He teaches and writes about: public policy, race and politics, civic engagement, the Internet and politics, and community development.  He is founder of the blog ThickCulture.

Sangyoub Park sent us a link to a post by the Brookings Institution about the changing racial/ethnic demographics of the 100 largest metro areas in the U.S. While White non-Hispanics still make up the majority in those areas (at 57% of the population), the minority population has grown rapidly in a number of cities; 22 of the top 100 metro areas are now majority-minority:

A detailed map of the majority-minority metro areas, with the largest racial/ethnic minority group in each (and the White non-Hispanic population in parentheses):

This demographic shift in metro areas should accelerate, given the racial/ethnic makeup of the population of children under age 1:

The Washington Post has an interactive map that lets you select an area and get detailed demographic information at the Census tract level (racial/ethnic makeup, household type, etc.) from 1990 to 2010.

Of course, as Sangyoub points out, being in the numerical majority doesn’t imply that a group no longer meets the definition of a minority group in a social sense. In many areas, racial/ethnic minorities continue to have less access to or control over economic resources, social prestige, and political power than do non-Hispanic Whites. Accumulated advantages do not get automatically redistributed when demographics change.

Recently the Pew Research Center released the results of a survey of 2,048 individuals about their perceptions of class conflict in the U.S., which are quite interesting in light of the Occupy Wall Street protests and the current attacks on Mitt Romney’s work with Bain Capital, which wouldn’t be that surprising except that they’re coming from other GOP presidential hopefuls (including Rick Perry referring to “vulture capitalism”). In the Pew survey, 2/3 of participants reported that there are “strong” or “very strong” conflicts between the rich and poor, with only 7% saying there are no conflicts:

This indicates an increase in perceived class conflict since 2009, where under half said there were “strong” or “very strong” conflicts between rich and poor. We also some difference by race, with African Americans perceiving more conflict than Whites or Hispanics, and Democrats and Independents seeing more than Republicans:

While I think these findings are interesting, I’m also struck by the language. Since Americans tend to define themselves as middle class, regardless of income, the wording here (“rich” vs. “poor”) would seem to ask Americans about their perceptions of conflict between groups that they likely do not identify with personally (though many may interpret “rich vs. poor” as shorthand for general economic inequality, of course). I just wonder what the results would be if we had a survey that asked about conflicts between the rich and the middle class, or “the rich and people like you” (and the same questions about the poor).

Regardless, increasing perceptions of class-based conflict doesn’t mean respondents necessarily think the wealthy are unfairly well-off. They were almost evenly split on whether the rich got their wealthy because of connections (family or otherwise) or because of their own hard work and effort:

The NYT has an article about the survey as well, with additional graphics. Thanks to Shamus Khan for the tip!

Dmitriy T.M. sent in a Census Bureau report on transportation and commuting, providing a detailed picture of how we’re getting to work. Despite constant discussions about reducing car use and encouraging mass transportation, the vast majority of people in the U.S. get to work in a car:

Not surprisingly, there are significant differences by race and ethnicity. Non-Hispanic Whites are the most likely to drive to work alone in their own car (83.5%), while only 3.2% use public transportation. Latinos are the most likely to carpool with at least one other person (16.4%) and African Americans are most likely to use public transportation (11.5%):

These differences likely reflect a variety of factors, include social class and differences in racial/ethnic concentrations in urban vs. rural areas and in different regions of the U.S., which affects how likely a worker is to have access to reliable, efficient public transportation or to realistically be able to walk to work. In fact, there were only five metro areas where at least 10% of workers use public transportation to get to work: the regions surrounding NYC, San Francisco/Oakland, Washington D.C., Boston, and Chicago.

And as anyone who has taken part in a morning commute recently won’t be shocked to hear, leaving for work is still highly concentrated in the 5 to 8:59 a.m. period for most occupations, though departure times reflect the  wider range of normal working hours in the service industry compared to other economic sectors (note that the colors do not all represent equal amounts of time):

More on mode of transportation and commuting times by region and race/ethnicity in the full report.