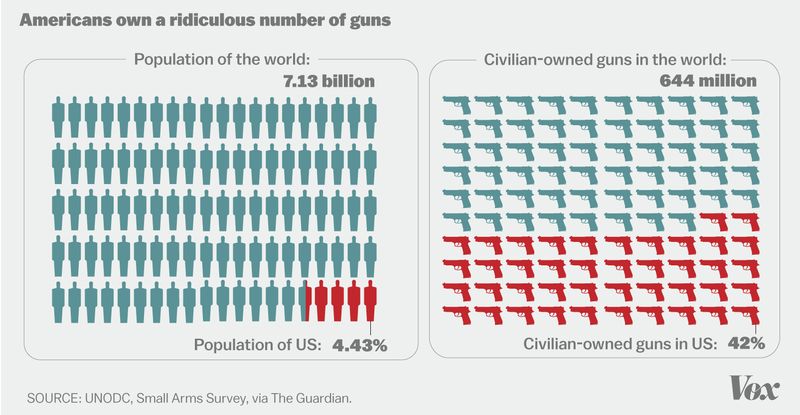
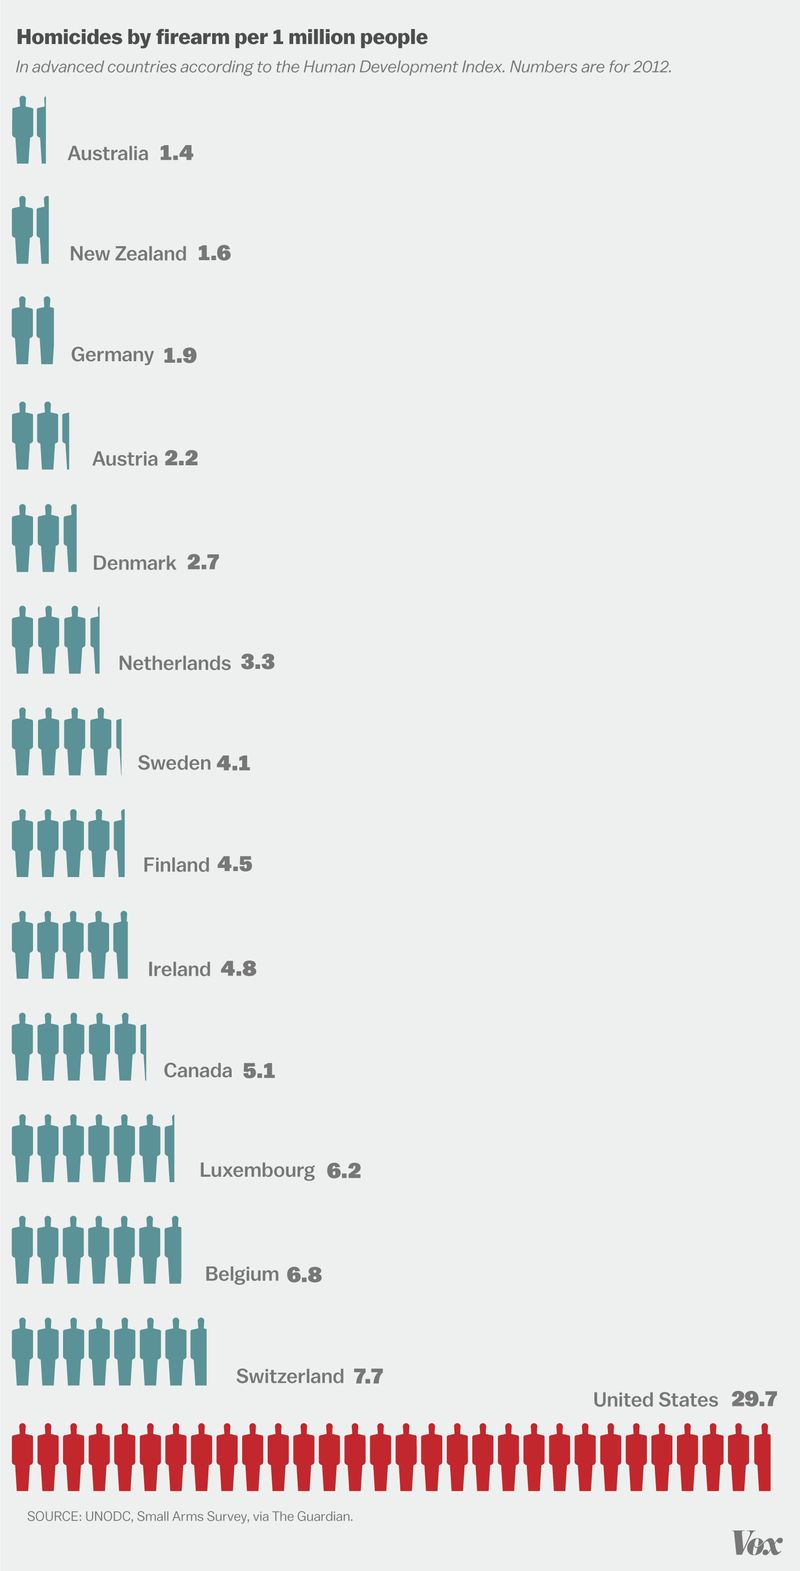
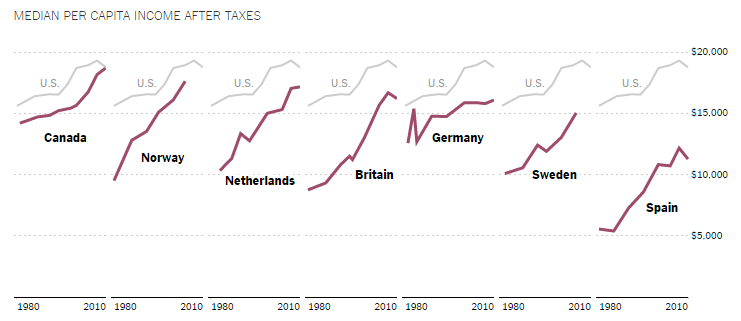
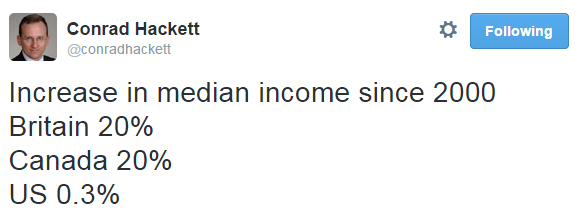
Flashback Friday.
Adam Smith observed in his Lectures on Jurisprudence (1762) — a series of talks that he gave at the University of Glasgow — that national character plays a significant role in economic transactions: the Dutch, he said, are “more faithful to their word” and better at “performing agreements” than the English, and the English more faithful than the Scots.
In the past few months, I’ve observed a similar kind of cultural variation in a much more prosaic setting: the panhandling interaction.
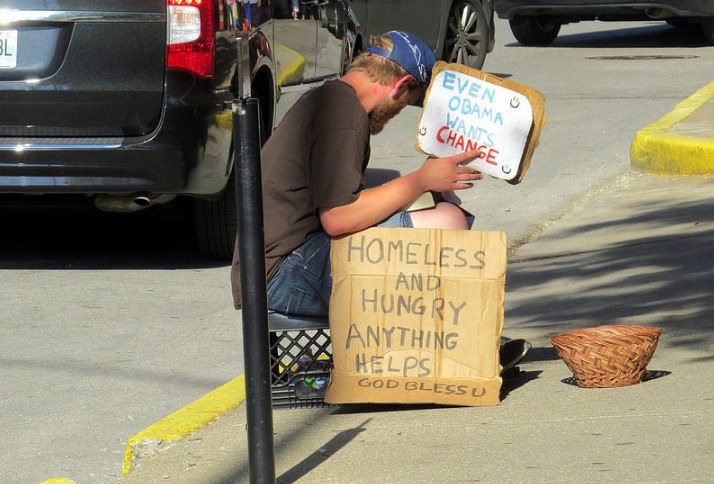
If you’re from North America, as I am, you’ve probably seen people on the street requesting money from strangers using appeals such as “Homeless—Please Help” or “Homeless Veteran.” There are a number of variations, but homelessness is the common theme in many cases.
Elsewhere in the world, panhandlers use quite different rationales—or what the great mid-century sociologist C. Wright Mills would call “vocabularies of motive.” Mills wasn’t interested in what actually motivated people—such as what psychologists would term “needs” or “drives”—but rather in the ideologically-charged terms they used to justify their actions to themselves and others. As he observed, some motives are more acceptable than others, and we can learn something about local cultures based on what passes for a “good reason.”
So it’s sociologically interesting that within the North American context, the concept of “home” has such resonance that the claim of “homelessness” is considered a compelling and sufficient motive for giving money to strangers. But while the need for shelter would seem universal, it’s rare to see a panhandler outside North America requesting a donation on the basis of homelessness.
In Germany, for example, one often finds people begging for trinkgeld—”drinking money.” And they’re not playing for laughs, as one sometimes finds in the US, when panhandlers give a wink and a nod to the stereotype that money given to beggars is only ever used to buy alcohol (or drugs). When a panhandler asks for “drinking money” in the US, it’s sort of an in-joke, or an attempt to appear disarmingly honest; based on the limited examples I’ve seen, this seems to jolly people up and get good results (i.e., quantities of cash).
But in Germany, drinking money is serious business. In the four years I lived in the Rhine Valley, I saw dozens of men (always men) on public transport and on the street, asking for “trinkgeld, bitte” in monotonous, dirge-like tones that seemed to express just how grim a fate it was to lack beer money. Equally surprising to me was the willingness of Germans to open their purses for this reason, as if it was a truth universally acknowledged that a man with empty pockets must be in want of a beer. In the interactions I witnessed, no one on either end of the transaction ever smiled.
Yet another vocabulary of motive can be found on the streets of Istanbul, where panhandlers often approach passers-by with a request for ekmek parası—Turkish for “bread money.” In perhaps 10 visits to Turkey in the last 3 years, I’ve never seen anyone on the street claiming to be homeless. Nor have I seen a cardboard sign of the kind so common in North America.
In all three settings, the vocabularies of motive among panhandlers have a common theme of need: for shelter, drink or food. What’s interesting is how each cultural setting changes the calculus about what kind of motive is most likely to bring in the cash. Perhaps it comes down to what each society views as among the basic human rights: in the US, shelter has a plausible claim to that status, but beer does not; whereas in Germany, it an appeal for trinkgeld succeeds as an appeal to common humanity and decency; in Turkey, hunger seems to trump all other claims.
Originally posted in 2010.
Brooke Harrington is Associate Professor of Economic Sociology at the Copenhagen Business School. She is the author of two books: Pop Finance: Investment Clubs and the New Investor Populism and Deception: From Ancient Empires to Internet Dating. She is currently doing research on offshore banking and blogs at our fellow Society Pages blog, Economic Sociology.