
Business Management offers this great visual for understanding income in equality in the U.S. Each light blue figure in this visual represents 50 years of work at minimum wage (making $15,080 a year); the medium blue figures represent 50 years of work at the average wage (making $40,690 a year); the dark blue figures represent 50 years as the President of the United States (making $400,000 a year).
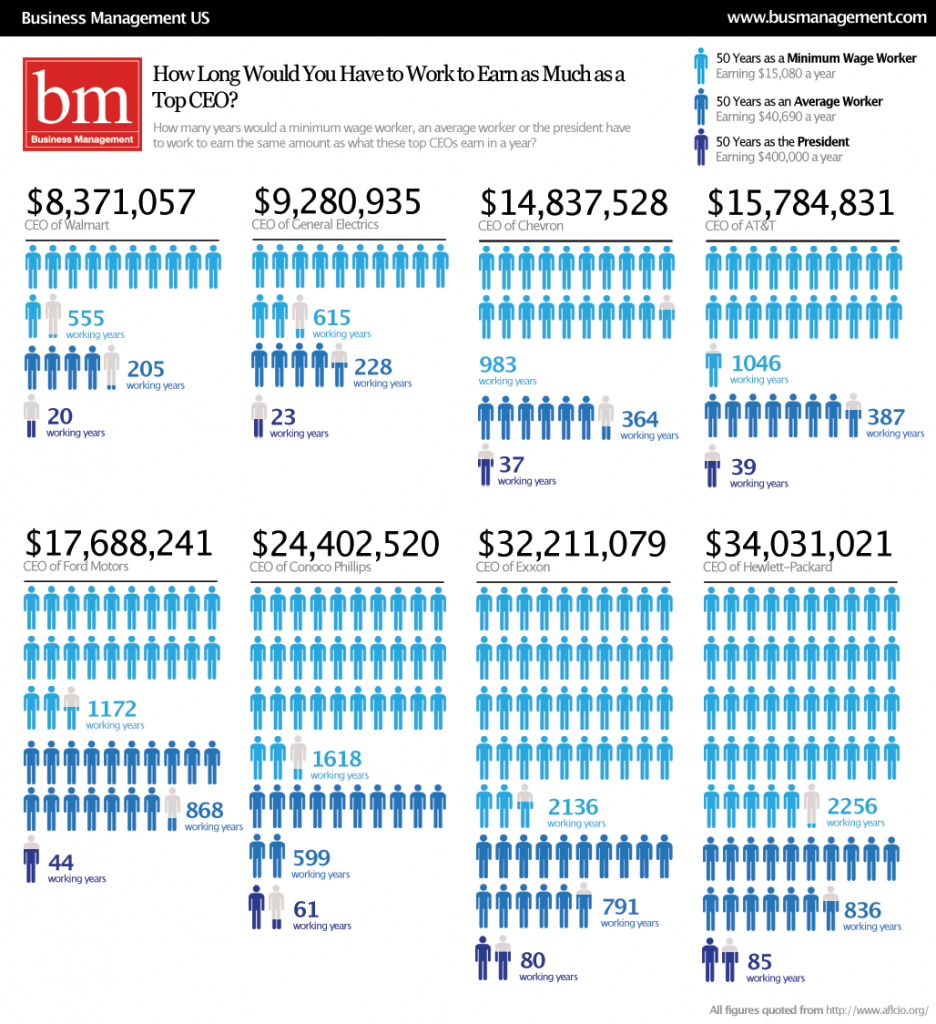
Let’s take the most dramatic example, just for fun: Hewlett-Packard.

A minimum wage worker would have to work for 2,256 years to make what what the CEO of Hewlett-Packard makes in a year.
The average worker would have to work 836 years to match his yearly salary.
And Barack Obama would have to President for 85 years before he made what the CEO of Hewlett-Packard makes in one year.
See other posts on income inequality here, here, here, here, and here.
Via Chartporn.
—————————
Lisa Wade is a professor of sociology at Occidental College. You can follow her on Twitter and Facebook.
Comments 18
Portia — October 27, 2009
I'm pretty sure the math is way off regarding Ford Motors and average-income workers.
But still an interesting chart. I'll be sending that webpage to the professor who teaches my Law, Ethics, and Wall Street class when we talk about exorbitant executive compensation.
mordicai — October 27, 2009
Wealth works when it moves. This is what economic has been slowly figuring out since it started putting itself together as a discipline. Fat paychecks for plutocrats doesn't help.
AG — October 27, 2009
Interesting that they didn't include any companies from the financial sector in this graphic.
Beelzebub — October 27, 2009
Here's another nifty look at income inequality: http://lcurve.org/
Duran2 — October 27, 2009
lisa, where did the post on online dating go?
Carla — October 27, 2009
I don't get why people get so bent out of shape about CEO compensation. CEOs make up such a miniscule portion of the population, getting outraged over their big paychecks is a worthless (and ultimately not very enlightening) endeavor.
lex — October 27, 2009
Carla, the WHOLE POINT is the amount of wealth (and consequently, power) that is concentrated into just a few pockets. The point is how resources are distributed in the world and where those resources could go if more equitably distributed. You cannot separate 'individual income' from larger patterns that affect society. To say that CEO compensation can be considered in isolation from other sociological factors is to gravely misunderstand the point of this post.
LS — October 28, 2009
And the argument used to justify the huge compensation packages is that CEO's are "more valuable" to the company. Well, maybe they are -- the good ones anyway -- but there is no way you're going to convince me that ANYone is 555 times (to use the least dramatic example up there) more valuable than the people actually working in the stores. (WalMart, as I understand it, doesn't pay much more than minimum wage to most employees.) 500 times more valuable? No. Just... no.
Ryan — December 5, 2009
Maybe I missed that this data is only for men? Otherwise, I can't help noticing that the universal symbol for the male gender (and shades of blue) was used to represent workers. Maybe just a coincidence, but still...