what’s trending

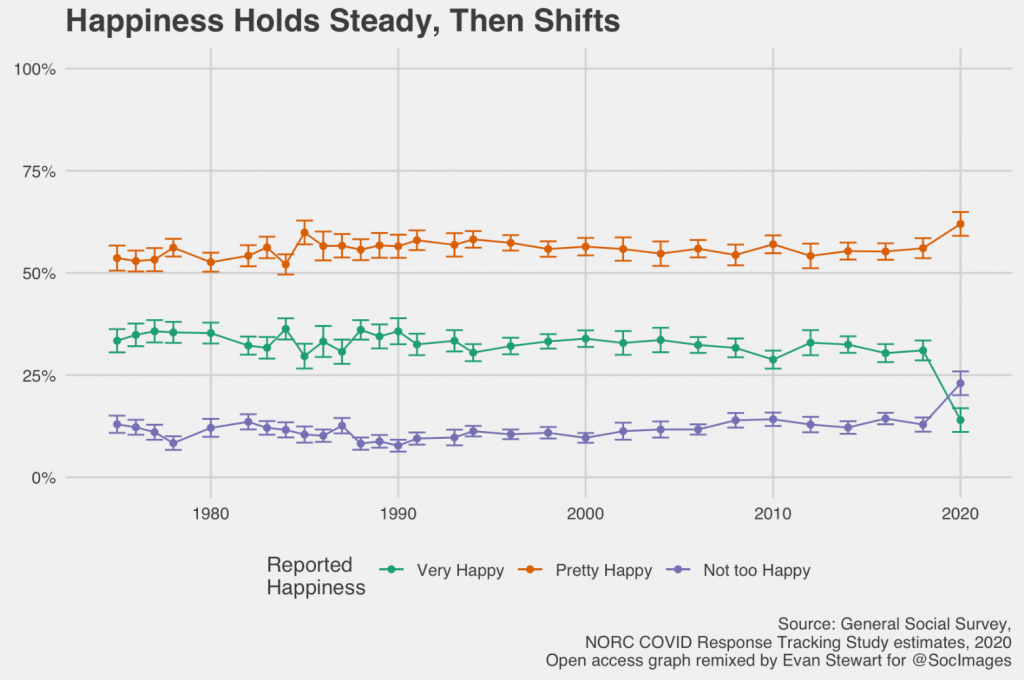
As the new year brings in a new peak in COVID cases across the country, we all have a right to feel a little down in the dumps.

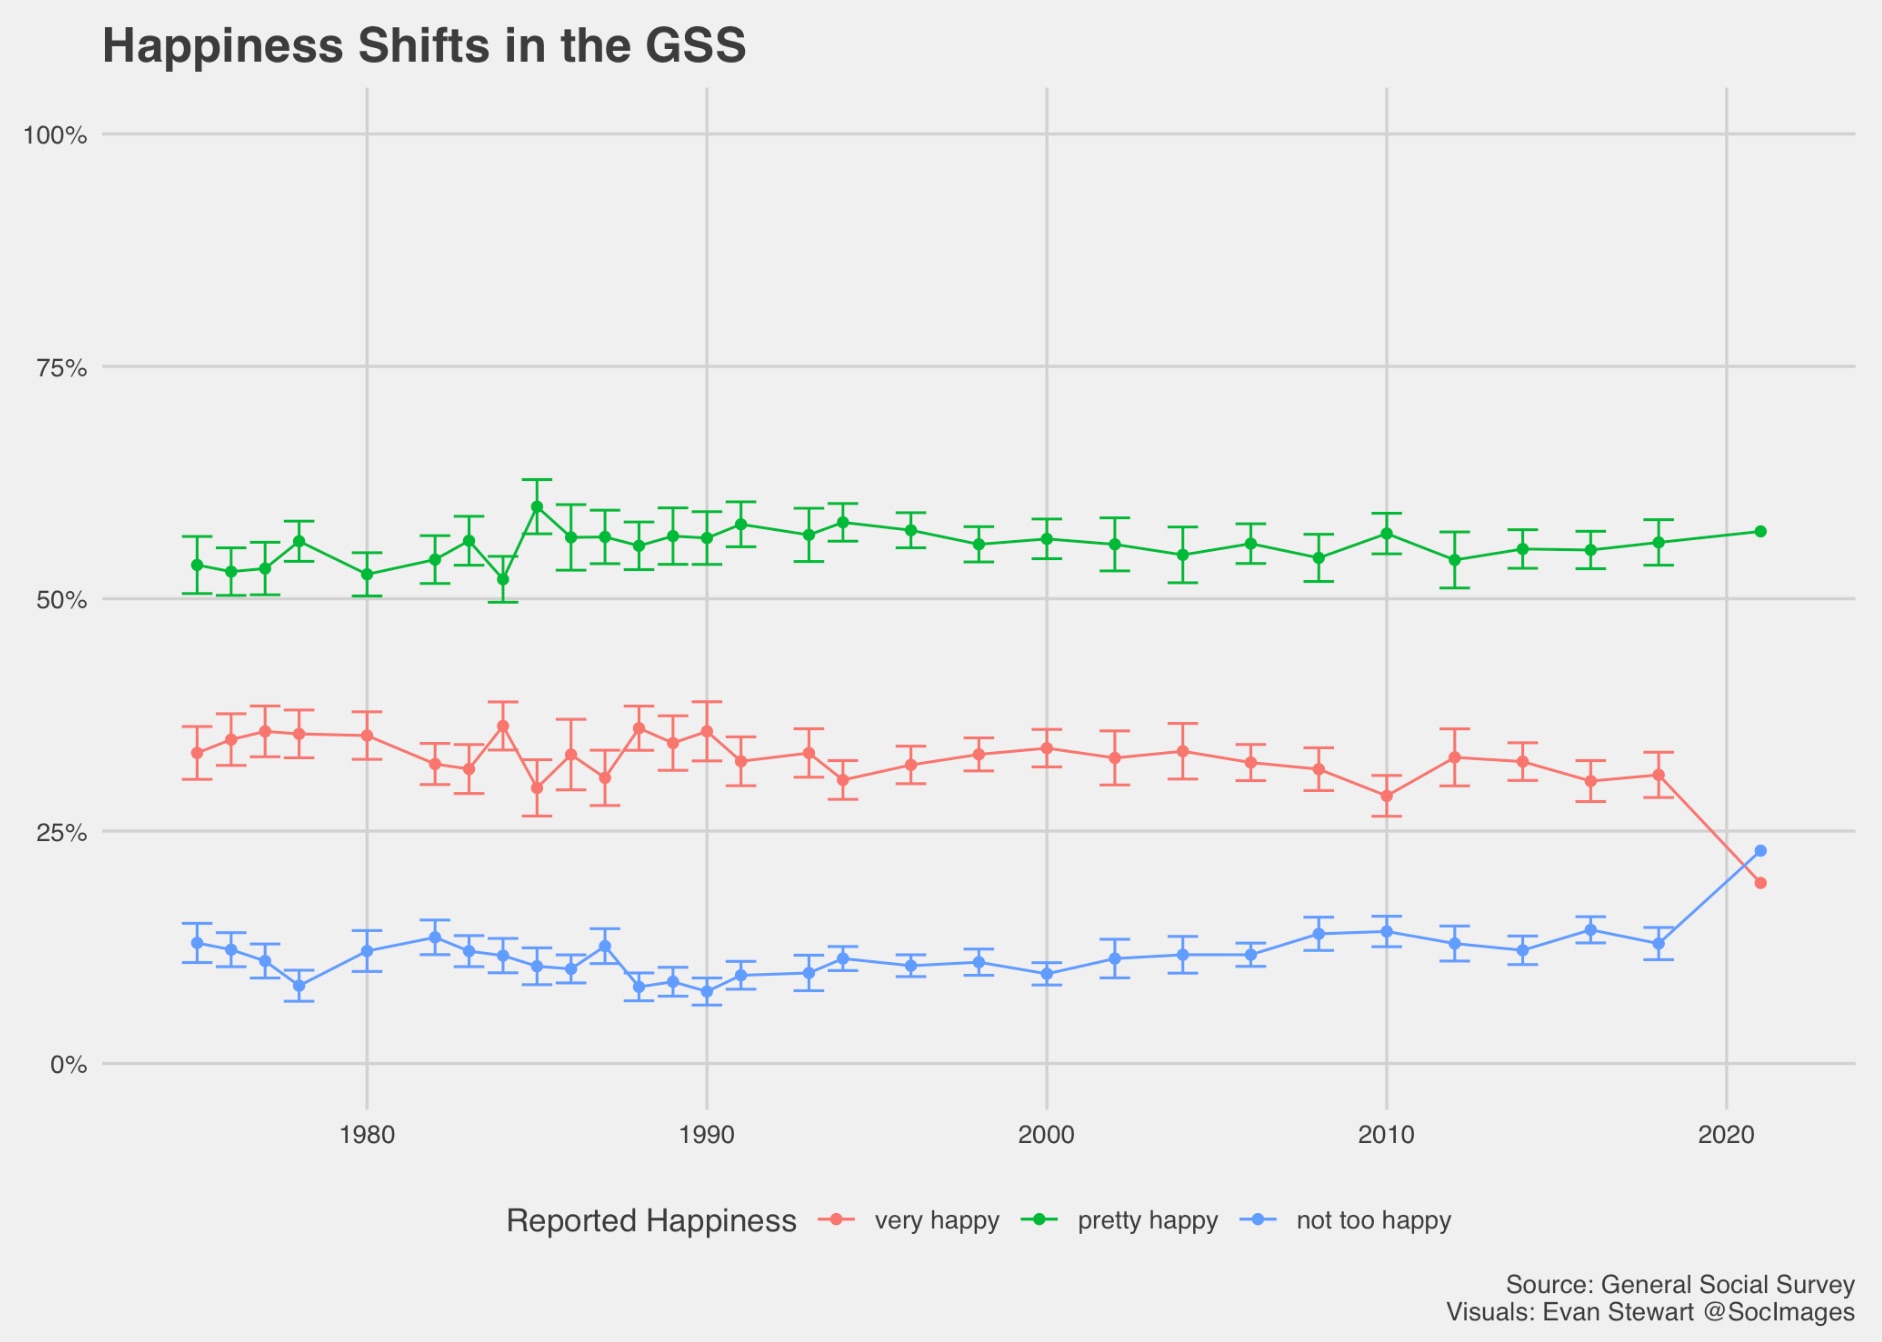
One trend picked up by surveys earlier in the pandemic was a drop in self-reported happiness. Now, with a new year of General Social Survey data released, it looks like the trend continues.

Trends in the General Social Survey show a drop in people saying they are "very happy" and a spike in people saying they are "not too happy" in 2021.
Part of this change could also be explained by the survey’s new online administration method, but the pattern is consistent with NORC’s previous pandemic tracking survey.

I’ve been thinking a lot about happiness and wellbeing as I launch into teaching Introduction to Sociology this year, both because we want to do right by our students in a tough time and because new students thinking about majoring have a right to ask us: how is our field helping the world?

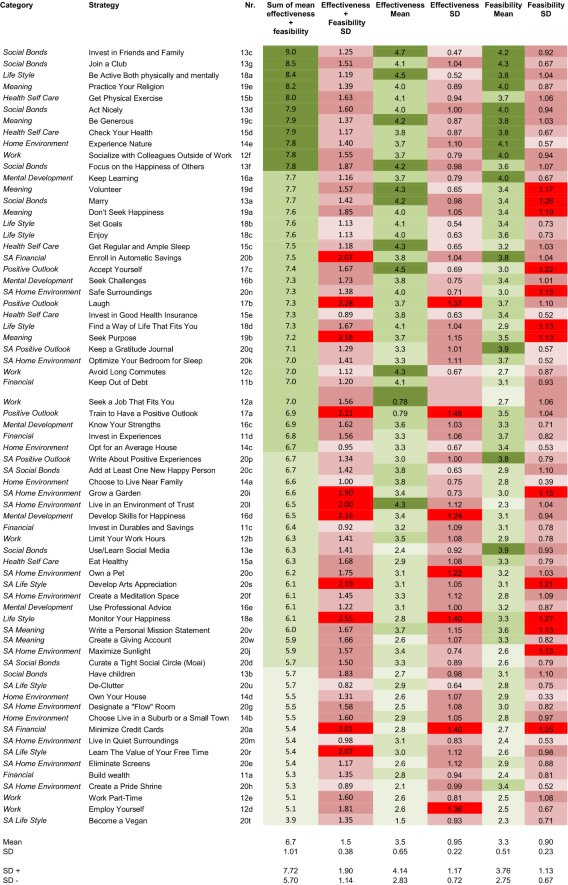
That’s why I was especially hopeful to hear about this study making its way around Twitter. The authors conducted interviews and surveys with experts in the field of happiness research to rank the things they thought would be most likely to increase life satisfaction based on their understanding of the research literature. Two important points caught my attention.

First, the researchers ranked both personal solutions and policy solutions to improve life satisfaction. This is important because we often think about our own happiness as an individual experience and an individual effort (often bolstered by the self-help industry). Focusing on policy reminds us that our individual wellbeing is linked to collective wellbeing, too.

Second, many of these experts’ top ranked solutions were explicitly about social relationships. For personal solutions, two of the top ranked suggestions were investing in friends and family and joining a club. For policy solutions, some of the top answers included promoting voluntary work or civil service and reducing loneliness.

Results from the paper show expert consensus that investing in friends and family and joining a club can improve life satisfaction.
It wasn’t just high expert ratings, low expert standard deviations indicated a lot of agreement about the value of social bonds. You can see the full set of results here, and the full paper here.

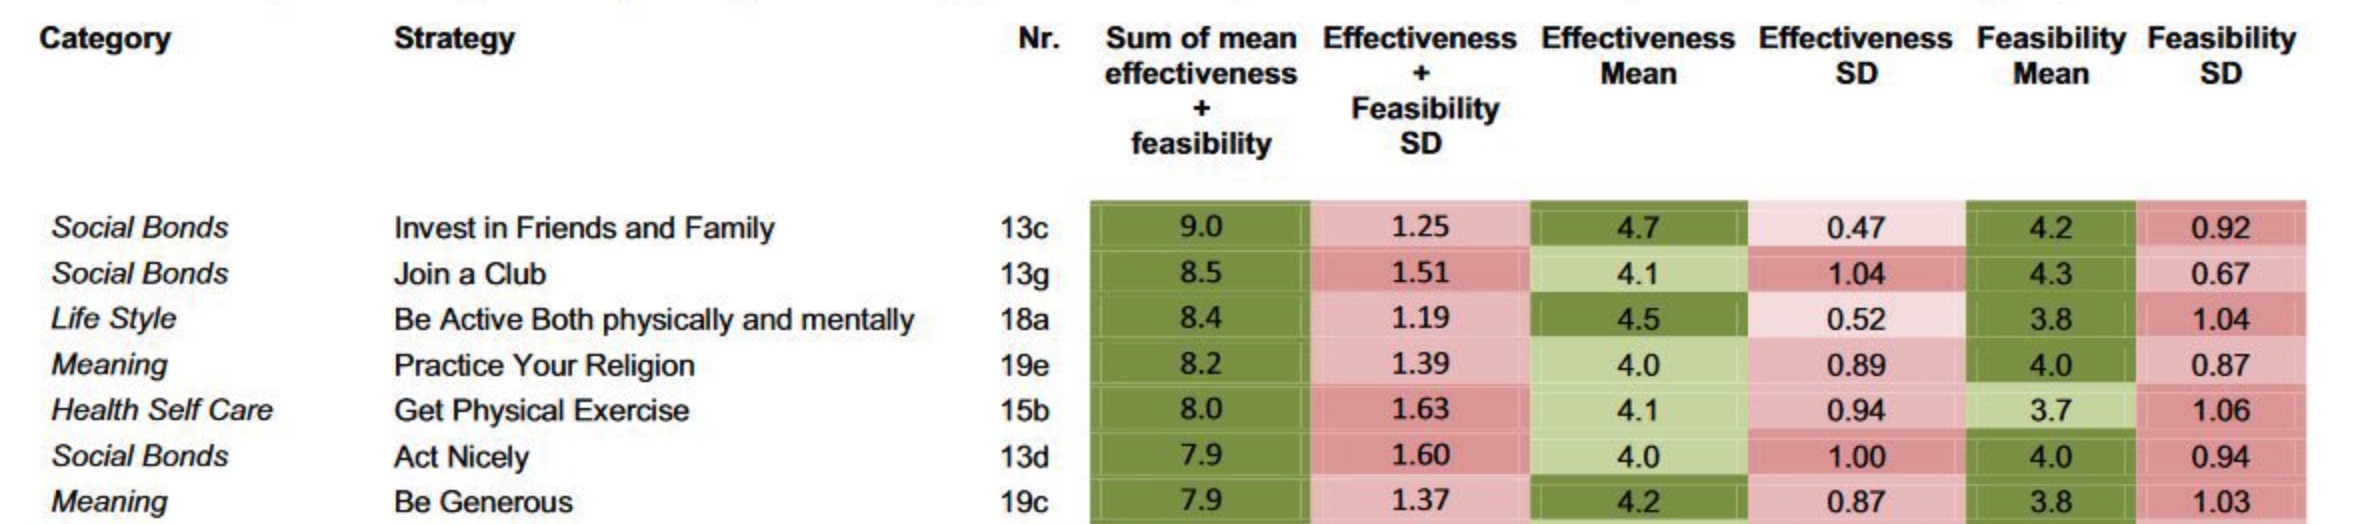
Expert consensus studies like this have a lot of limitations, since they only show us a glimpse of the current conventional wisdom. But this study also shows us the positive stakes of sociology. It reminds us that developing a better understanding of our relationships and investing in those relationships is not just a self-help fad; it can be a social policy priority to get us through tough times together.

Evan Stewart is an assistant professor of sociology at University of Massachusetts Boston. You can follow his work at his website, on Twitter, or on BlueSky.

Photo courtesy Letta Page

Despite, well, everything, we are trying to get back into the classroom as much as we can at the start of a new academic year. I am scheduled to teach Introduction to Sociology for the first time this coming spring and planning the course this fall.

Whether in person or remote, I will be ecstatic to introduce our field to a new batch of students — to show them what sociologists do, how we work, and how we think about the world. Thinking about those foundations, the start of an academic year is a great time to come back and ask “what, exactly, are we doing?”

I have been thinking a lot about that question in our current chaotic moment and in the context of sociology’s changing role in higher eduction. This chart made by Philip Cohen keeps coming to mind:

Source: Philip Cohen – original post at Family Inequality

There are a lot of reasons for the decline in sociology majors, and reflections on our purpose as a field are not new at all (examples hereherehere, and on the social sciences in general here). We all bring different ideas about our common methods and missions, and our field has plenty of room for many different sociologies. I like big-tent approaches like the one here at The Society Pages.

For newcomers, though, that range makes it hard to grasp what sociologists actually do, and that makes it tough to do right by our students. At some point, someone is going to ask a new sociology major the dreaded question: “what do you do with that?” I think we have a responsibility to model ways to answer that question clearly and directly, even if we don’t want to lock students into narrow careerist ambitions. A wonky answer about ~society~ doesn’t necessarily help them.

That’s why I love these recent podcast episodes with Zeynep Tufekci. In each case, the hosts ask her how she got so much right about COVID-19 so early in the pandemic. In both, her answers explicitly show us how insights about relationships, organizations, and stigma helped to guide her thinking. These interviews are a model for showing us what sociological thinking actually can do to address pressing issues.

Far too often, our institutions miss out on the benefits of thinking about social systems and relationships in this way. Sources like these help to sell sociology to our students, and they will be a big part of my upcoming intro course. In the coming weeks, we’ll be running more posts that focus on going back to basics for newcomers in sociology, including updates to our “What’s Trending?” series and more content for the intro classroom. Stay tuned, and share how you sell sociology to your students!

Evan Stewart is an assistant professor of sociology at University of Massachusetts Boston. You can follow his work at his website, on Twitter, or on BlueSky.

One important lesson from political science and sociology is that public opinion often holds steady. This is because it is difficult to get individual people to change their minds. Instead, people tend to keep consistent views as “settled dispositions” over time, and mass opinion changes slowly as new people age into taking surveys and older people age out.

Sometimes public opinion does change quickly, though, and these rapid changes are worth our attention precisely because they are rare. For example, one of the most notable recent changes is the swing toward majority support for same-sex marriage in the United States in just the last decade.

That’s why a new finding is so interesting and so troubling: NORC is reporting a pretty big swing in self-reported happiness since the pandemic broke out using a new 2020 survey conducted in late May. Compared to earlier trends from the General Social Survey, fewer people are reporting they are “very happy,” optimism about the future is down, and feelings of isolation and loneliness are up. The Associated Press has dynamic charts here, and I made an open-access, creative commons version of one visualization using GSS data and NORC’s estimates:

As with any survey trend, we will need more data to get the true shape of the change and see whether it will persist over time. Despite this, one important point here is the consistency before the new 2020 data. Think about all the times aggregated happiness reports didn’t really change: we don’t see major shifts around September 11th, 2001, and there are only small changes around the Gulf War in 1990 or the 2008 financial crisis.

There is something reassuring about such a dramatic drop now, given this past resilience. If you’re feeling bad, you’re not alone. We have to remember that emotions are social. People have a remarkable ability to persist through all kinds of trying times, but that is often because they can connect with others for support. The unprecedented isolation of physical distancing and quarantine has a unique impact on our social relationships and, in turn, it could have a dramatic impact on our collective wellbeing. The first step to fixing this problem is facing it honestly.

Inspired by demographic facts you should know cold, “What’s Trending?” is a post series at Sociological Images featuring quick looks at what’s up, what’s down, and what sociologists have to say about it.

Evan Stewart is an assistant professor of sociology at University of Massachusetts Boston. You can follow his work at his website, on Twitter, or on BlueSky.

Modern policing is often characterized by quasi-militaristic tendencies, from “wars” on drugs and crime to its use armored vehicles and automatic weapons. The Department of Defense 1033 Program, which provides military equipment slated for storage to law enforcement agencies, is a popular way that police and sheriff’s departments acquire military gear. According to data from the Defense Logistics Agency, acquisitions of military equipment by state and local law enforcement sharply rose to a peak in 2016, and then have declined in recent years. But what explains participation in the DOD’s program? Which police departments acquire the most military equipment?

In a recent study published in Criminology, David Ramey and Trent Steidley investigate whether law enforcement agencies participated in the program and how much gear they acquired using 1033 program participation and U.S. Census and American Community Survey data. They find that participation in the 1033 — but not the value of gear acquired — is greater in areas of higher violent arrests. They also find that, after controlling for crime rates and other factors, higher local Black and Hispanic populations correlate with higher levels of participation and greater value acquired.

Las Vegas Metropolitan Police SWAT
Las Vegas Metropolitan Police SWAT, Photo by Tomás Del Coro, Flickr CC

However, these racial patterns are not linear. Agencies operating in areas with very small and very large minority populations have low probabilities of program participation, but agencies that serve a more diverse community are most likely to obtain military equipment through the 1033 program. For those that do participate, increases in minority populations correlated with higher dollar values of equipment acquired, with each subsequent increase garnering even more gear than the last (an exponential increase). In other words, program participation increases in response to racial demographics up to an extent, but once an agency decides to participate, the value of military equipment requested dramatically increases as minority populations increase.

Trends in police militarization highlight two patterns. Law enforcement agencies respond to increasing crime rates with police militarization, possibly in an attempt to deter further crime. In contrast, the racial effects found in this study follow  a “minority threat” model, as military acquisitions correspond to the presence of racial minority groups. This research illustrates how race, net of the crime rates in an area, can pattern not only where police operate, but how they operate.

Ryan Larson is a graduate student from the Department of Sociology, University of Minnesota – Twin Cities. He studies crime, punishment, and quantitative methodology. He is a member of the Graduate Editorial Board of The Society Pages.

The 2018 General Social Survey data was just recently publicly released. We were eager to see how things shifted, especially for the demographic questions on sexual identity. As of 2018, it has officially been one decade that GSS has been asking respondents to characterize their sexual identity on the survey, you can self-classify as “heterosexual or straight,” “gay,” “lesbian,” “homosexual,” “bisexual,” or “don’t know.” This is only one way to measure sexual identity among many,  but the growth in LGB identity has been generally comparable across instruments in the past.

As Tristan has noted before, reporting on shifts in the LGBT population treats the group as homogenous and artificially presents growth in LGBT identity as though it might be equally distributed among the L’s, G’s, B’s, and T’s. But that’s not true. Bisexual women account for the lion’s share on the growth in LGBT identification. And, as Tristan and Mignon Moore showed in 2016, young Black women account for a disproportionate amount of the growth in LGB identification.

Data from GSS shows an increase in LGB identification between 2008 and 2018. Below, we charted shifts in those identifying as lesbian and gay alongside those identifying as bisexual. Consistent with what Tristan showed in 2016, bisexual identification continues to be increasing at a steeper rate.

In fact, when you look at the proportions identifying as lesbian and gay or bisexual in 2008 and compare those with the proportions identifying as lesbian and gay or bisexual in 2018, lesbian and gay identifications have not really moved much. But bisexual identities continue to increase every year.

This is consistent with other national survey work. For example, using the National Survey of Family Growth (NSFG), Compton, Farris and Chang (2015) found that almost nine percent of women in the sample and about four percent of men in the sample in 2008 and 2002 reported behavior as bisexual; that is, having sex with at least one male and at least one female partner in their lifetime. Rates of self-identification as bisexual were much lower (in 2008 0.43% of women and 0.38% of men). Perhaps with increases in social tolerance people are more likely to claim bisexual identities today, regardless of their participation in the behavior.

Previous work has also suggested that much of the growth in LGB identities is happening among women. The GSS data show that the shift appears to be primarily happening among bisexual women. Indeed, bisexuality continues to be a more popular sexual identity than lesbian among women, but a less popular sexual identity than gay among men, as others have shown. As of 2018, almost 6% of women responding to the survey identified as bisexual compared with 1.5% in 2008. Comparatively, shifts in lesbian identities among women and both gay and bisexual identities among men really haven’t shifted much.

And similar to previous analyses (herehere, and here), this shift is particularly pronounced among the young. The figure below shows changes in lesbian and gay identities alongside shifts in bisexual identities for four separate age cohorts. The real shift in among bisexual identification among 18-34 year-olds. Between 7 and 8% identified as  bisexual on the 2018 GSS survey. This is all the more interesting when you look at the 2008 data on these figures. Bisexuality did not stand out in these data in 2008. In fact, in 2008, more people identified as lesbian and gay than bisexual. This shift has emerged and grown in an incredibly short period of time.

As other data have shown as well (see here and here, for instance), people of color account for a disproportionate amount of this shift. Black bisexuals accounted for almost 7% of Black respondents on the 2018 GSS. That’s a big shift as well. And while bisexual and lesbian/gay identities were moving along similar trajectories for Black Americans through 2016, as of 2018, bisexuality was much more common (as has been true for White respondents and those of other races… yes “other race” is actually the category GSS uses… and no, it’s not a good idea).

So what do we do with all of this? One thing that we ought to take from this is to take scholarship on bisexuality more seriously. As a sexual identity, bisexuality is less studied than it ought to be. But bisexuality has continued to grow and continues to represent a larger number of people’s sexual identities than lesbian and gay combined. This is interesting for a number of reasons, but one is that much of the growth in the LGBT community might actually be the result of changes in the population of bisexual identifying people (and this is a group that is disproportionately composed of women). Whether bisexual identifying people understand themselves as a part of a distinct sexual minority, though, is a question that deserves more scholarship. If we are going to continue to group bisexuals with lesbian women and gay men when we report on shifts in LGB populations, this might be something that deserves better understanding and more attention. Context matters in how we understand identities and how they change or evolve over time.

Originally posted at Inequality by Interior Design. Read more and dive into the details there!

D’Lane R. Compton, PhD is an associate professor of sociology at the University of New Orleans with a background in social psychology, methodology, and a little bit of demography, they are usually thinking about food, country roads, stigma, queer nooks and places, sneakers and hipster subcultures. You can follow them on twitter.

Tristan Bridges, PhD is a professor at the University of California, Santa Barbara. He is the co-editor of Exploring Masculinities: Identity, Inequality, Inequality, and Change with C.J. Pascoe and studies gender and sexual identity and inequality. You can follow him on Twitter here. Tristan also blogs regularly at Inequality by (Interior) Design.

Social institutions are powerful on their own, but they still need buy-in to work. When people don’t feel like they can trust institutions, they are more likely to find ways to opt out of participating in them. Low voting rates, religious disaffiliation, and other kinds of civic disengagement make it harder for people to have a voice in the organizations that influence their lives.

And, wow, have we seen some good reasons not to trust institutions over the past few decades. The latest political news only tops a list running from Watergate to Whitewater, Bush v. Gore, the 2008 financial crisis, clergy abuse scandals, and more.

Using data from the General Social Survey, we can track how confidence in these institutions has changed over time. For example, recent controversy over the Kavanaugh confirmation is a blow to the Supreme Court’s image, but strong confidence in the Supreme Court has been on the decline since 2000. Now, attitudes about the Court are starting to look similar to the way Americans see the other branches of government.

(Click to Enlarge)
Source: General Social Survey Cumulative File
LOESS-Smoothed trend lines follow weighted proportion estimates for each response option.

Over time, you can see trust in the executive and legislative branches drop as the proportion of respondents who say they have a great deal of confidence in each declines. The Supreme Court has enjoyed higher confidence than the other two branches, but even this has started to look more uncertain.

For context, we can also compare these trends to other social institutions like the market, the media, and organized religion. Confidence in these groups has been changing as well.

(Click to Enlarge)
Source: General Social Survey Cumulative File

It is interesting to watch the high and low trend lines switch over time, but we should also pay attention to who sits on the fence by choosing some confidence on these items. More people are taking a side on the press, for example, but the middle is holding steady for organized religion and the Supreme Court.

These charts raise an important question about the nature of social change: are the people who lose trust in institutions moderate supporters who are driven away by extreme changes, or “true believers” who feel betrayed by scandals? When political parties argue about capturing the middle or motivating the base, or the church worries about recruiting new members, these kinds of trends are central to the conversation.

Inspired by demographic facts you should know cold, “What’s Trending?” is a post series at Sociological Images featuring quick looks at what’s up, what’s down, and what sociologists have to say about it.Evan Stewart is an assistant professor of sociology at University of Massachusetts Boston. You can follow his work at his website, on Twitter, or on BlueSky.

The recent controversy about local news stations in the Sinclair Broadcasting Group reading a coordinated, nationwide message against “fake news” raises questions about the state of news consumption in the United States. Where are Americans getting their news from? If more people are reading the news online, did the Sinclair message have a large impact?

The General Social Survey asks respondents where they get most of their information about the news. This graph shows big changes in Americans’ primary news source, including the rise of online news and the decline of television and newspapers. Notably, in the 2016 GSS, the Internet overtook TV as Americans’ primary source of news for the first time.

(Click to Enlarge)

Another survey, The Cooperative Congressional Election Survey, takes a different approach. They ask respondents to select whether they use newspapers, blogs, television, or other sources for their news information. When a survey doesn’t ask respondents to pick a primary source, we see that use rates are more steady over time as people still use a variety of sources.

(Click to Enlarge)

Reported rates of news watching have also stayed pretty stable over the last eight years, with about three-quarters of Americans getting some of their news from TV. Of people who watch news on TV, many respondents report that they watch both local and national news, and this choice has stayed relatively stable over time. Since local news is still a steady part of our news diet, the Sinclair broadcast had a much broader potential reach than we would typically assume about news today.

(Click to Enlarge)

Ryan Larson is a graduate student from the Department of Sociology, University of Minnesota – Twin Cities. He studies crime, punishment, and quantitative methodology. He is a member of the Graduate Editorial Board of The Society Pages, and his work has appeared in Poetics, Contexts, and Sociological Perspectives.

Evan Stewart is a Ph.D. candidate in sociology at the University of Minnesota. You can follow him on Twitter.

Andrew M. Lindner is an Associate Professor at Skidmore College. His research interests include media sociology, political sociology, and sociology of sport.

Inspired by demographic facts you should know cold, “What’s Trending?” is a post series at Sociological Images featuring quick looks at what’s up, what’s down, and what sociologists have to say about it.

Today students across the country are walking out of school to protest violence and demand gun control reform. Where do Americans stand on this issue, and have their views changed over time? Government policy makes it difficult to research gun violence in the United States, but we do have some trend data from the General Social Survey that offers important context about how Americans view this issue.

For over forty years, the GSS has been asking its respondents whether they “favor or oppose a law which would require a person to obtain a police permit before he or she could buy a gun”—a simple measure to take the temperature on basic support for gun control. Compared to other controversial social policies, there is actually widespread and consistent support for this kind of gun control.

(Click to Enlarge)

In light of the Second Amendment, however, the U.S. has a reputation for having a strong pro-gun culture. Is this true? It turns out there has been a dramatic shift in the proportion of respondents who report even having a gun in their homes. Despite this trend, gun sales are still high, suggesting that those sales are concentrated among people who already own a gun.

(Click to Enlarge)

Recent controversies over gun control can make it seem like the nation is deeply and evenly divided. These data provide an important reminder that gun control is actually pretty popular, even though views on the issue have become more politically polarized over time.

Inspired by demographic facts you should know cold, “What’s Trending?” is a post series at Sociological Images featuring quick looks at what’s up, what’s down, and what sociologists have to say about it.

Ryan Larson is a graduate student from the Department of Sociology, University of Minnesota – Twin Cities. He studies crime, punishment, and quantitative methodology. He is a member of the Graduate Editorial Board of The Society Pages, and his work has appeared in Poetics, Contexts, and Sociological Perspectives.

Evan Stewart is a Ph.D. candidate in sociology at the University of Minnesota. You can follow him on Twitter.