nation: Russia

Cross-posted at Reports from the Economic Front.

The Pew Research Center recently published a report titled “Pervasive Gloom About the World Economy.” The following two charts come from Chapter 4 which is called “The Causalities: Faith in Hard Work and Capitalism.”

The first suggests that the belief that hard work pays off remains strong in only a few countries: Pakistan (81%), the U.S. (77%), Tunisia (73%), Brazil (69%), India (67%) and Mexico (65%). The low scores in China, Germany, and Japan are worth noting. This is not to say that people everywhere are not working hard, just that many no longer believe there is a strong connection between their effort and outcome.

The second chart highlights the fact that growing numbers of people are losing faith in free market capitalism.  Despite mainstream claims that “there is no alternative,” a high percentage of people in many countries do not believe that the free market system makes people better off.

GlobeScan polled more than 12,000 adults across 23 countries about their attitudes towards economic inequality and, as the chart below reveals, the results were remarkably similar to those highlighted above.  In fact, as GlobeScan noted, “In 12 countries over 50% of people said they did not believe that the rich deserved their wealth.

It certainly seems that large numbers of people in many different countries are open to new ways of organizing economic activity.

Martin Hart-Landsberg is a professor of economics at Lewis and Clark College. You can follow him at Reports from the Economic Front.

In a previous post I discussed how the U.S. became more religious in the 1950s, in part in response to its the Cold War enemies (atheist communists).  In fact, the U.S. is among the most religious countries in the world.  Using data from the International Social Survey Programme, Sociologist Tom Smith paints wildly different religious portraits of 28 nations (full text).

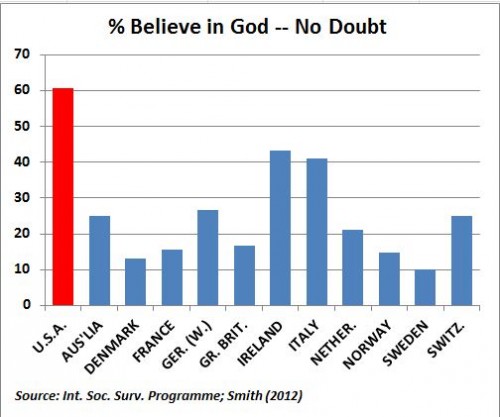
When asked whether they “know that God really exists and… have no doubt about it,” 61% of Americans say “yes.”  Of the 28 nations studied, only four were more likely to say “yes” to this question: Poland, Israel, Chile, and the Philippines. Here’s how we look compared to similar countries:

Here’s all 28 in rank order (borrowed from LiveScience).  Notice how wide the divergence is.  In Japan, the least religious country according to this measure, only 4% say they have no doubt God exists.  In The Philippines, 84% have no doubt.

% Have No Doubt God Exists:

  • Japan: 4.3 percent
  • East Germany: 7.8 percent
  • Sweden: 10.2
  • Czech Republic: 11.1
  • Denmark: 13.0
  • Norway: 14.8
  • France: 15.5
  • Great Britain: 16.8
  • The Netherlands: 21.2
  • Austria: 21.4
  • Latvia: 21.7
  • Hungary: 23.5
  • Slovenia: 23.6
  • Australia: 24.9
  • Switzerland: 25.0
  • New Zealand: 26.4
  • West Germany: 26.7
  • Russia: 30.5
  • Spain: 38.4
  • Slovakia: 39.2
  • Italy: 41.0
  • Ireland: 43.2
  • Northern Ireland: 45.6
  • Portugal: 50.9
  • Cyprus: 59.0
  • United States: 60.6
  • Poland: 62.0
  • Israel: 65.5
  • Chile: 79.4
  • The Philippines: 83.6

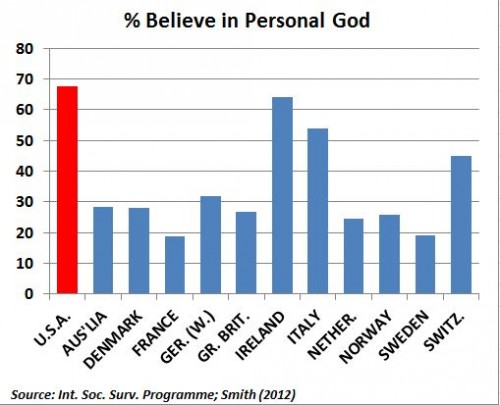
Americans are also particularly likely to believe in a “personal God,” one who is closely attentive to the lives of each and every person.

Quite interestingly, the U.S. is in the minority in that Americans tend to become increasingly religious as they age.  In most countries, people become less religious over time.  This graph (confusingly labeled), shows changes in DISbelief over the life course.  The U.S. is the only country among these in which disbelief declines:

Lifetime Change in Religiosity (from increase in disbelief to increase in belief):

  • The Netherlands: -14.0
  • Spain: -12.4
  • Australia: -12.0
  • France: -11.3
  • Norway: -11.0
  • Great Britain: -10.1
  • Switzerland: -8.2
  • Germany (East): -6.9
  • Denmark: -6.1
  • Czech Republic: -5.5
  • Sweden: -5.5
  • Germany (West): -5.4
  • New Zealand: -4.0
  • Italy: -2.7
  • Poland: -1.8
  • Japan: -1.5
  • Ireland: -0.9
  • Chile: +0.1
  • Cyprus: +0.2
  • Portugal: +0.6
  • The Philippines: +0.8
  • Hungary: +1.0
  • Northern Ireland: +1.0
  • United States: +1.4
  • Israel: +2.6
  • Slovakia: +5.6
  • Slovenia: +8.5
  • Latvia: +11.9
  • Russia: +16.0

Rates of atheism — a strong disbelief in God — also vary tremendously.  East Germany is the most atheist, with more than half of citizens claiming disbelief.  The country is a stark contrast to the atheist among them, Poland and the U.S. (only 3% atheist), Chile and Cyprus (2%), and The Phillipines (1%).

% Atheist:

  • East Germany: 52.1
  • Czech Republic: 39.9
  • France: 23.3
  • The Netherlands: 19.7
  • Sweden: 19.3
  • Latvia: 18.3
  • Great Britain: 18.0
  • Denmark: 17.9
  • Norway: 17.4
  • Australia: 15.9
  • Hungary: 15.2
  • Slovenia: 13.2
  • New Zealand: 12.6
  • Slovakia: 11.7
  • West Germany: 10.3
  • Spain: 9.7
  • Switzerland: 9.3
  • Austria: 9.2
  • Japan: 8.7
  • Russia: 6.8
  • Northern Ireland: 6.6
  • Israel: 6.0
  • Italy: 5.9
  • Portugal: 5.1
  • Ireland: 5.0
  • Poland: 3.3
  • United States: 3.0
  • Chile: 1.9
  • Cyprus: 1.9
  • The Philippines: 0.7

As a post-9/11 American watching another election cycle, I can’t help but notice how so much of our rhetoric revolves — sometimes overtly and sometimes not — around people who are the wrong religion.  Notably, Muslims.  And yet, the U.S. and many Muslim countries are alike in being strongly religious, at least in comparison to the many strongly secular countries.

This is odd because stands in contrast to recent data on American attitudes.  Within the U.S., people express much less tolerance for atheists than they do Muslims (homosexuals, African Americans, and immigrants). Weirdly, we think we have more in common with more secular nations like Great Britain than we do with countries like Pakistan or Saudi Arabia. In certain ways, the opposite might be true.

Thanks to Claude Fischer for the graphs.  Fischer, a sociologist at UC Berkeley, is the author of Made in America: A Social History of American Culture and Character.

Lisa Wade, PhD is an Associate Professor at Tulane University. She is the author of American Hookup, a book about college sexual culture; a textbook about gender; and a forthcoming introductory text: Terrible Magnificent Sociology. You can follow her on Twitter and Instagram.

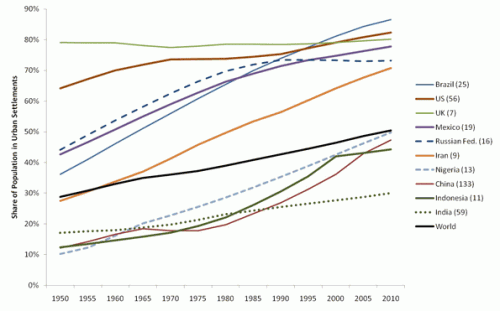
Urban Demographics posted some graphs from the UN’s State of the World’s Cities 2010/2011 report on global urbanization trends. A snapshot of urbanization in 11 countries:

You can see a few other notable trends here that illustrate various national trajectories, as Phil McDermott at Cities Matter points out. For instance, notice that while Russia underwent rapid urbanization between 1950 and 1980, it has leveled off since then. Similarly, Indonesia’s urbanization slowed significantly in the late ’90s and has continued at a much slower pace since then. We also see quite different patterns between the world’s two most populous nations: While China’s urbanization rate sped up in the early ’90s (after urbanization actually dipped in the ’70s), India has experienced fairly slow urbanization.

Credit Suisse released a report on urbanization and emerging markets, if you’re interested in the impacts of urbanization on a wide array of economic development indicators, from electricity and steel consumption to projections of future housing needs to incomes and standards of living.

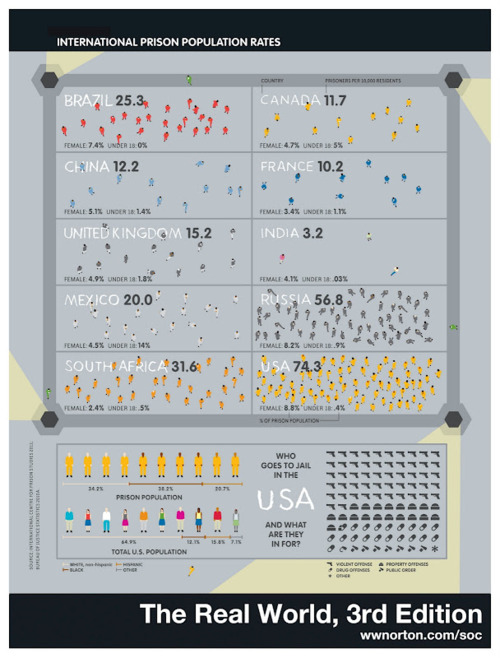
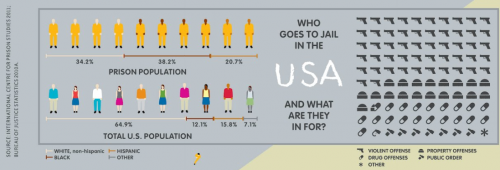
Norton Sociology recently posted an image that illustrate differences in rates of imprisonment in a number of countries. Imprisonment rates are influenced by a number of factors — what is made illegal, how intense law enforcement efforts are, preference for prison time over other options, etc. The U.S. does not compare favorably, with 74.3 per 100,000 10,000 of our population behind bars (click here for a version you can zoom in on, and sorry for the earlier typo!):

Here’s a close-up of the breakdown of the U.S. prison population:

Via Urban Demographics.

For the last week of December, we’re re-posting some of our favorite posts from 2011.

————————

In Sway: The Irresistible Pull of Irrational Behavior, Ori and Rom Brafman discuss a contestant on Qui Veut Gagner des Millions?, the French version of Who Wants to Be a Millionaire?, who asks the audience for help with the question, “Which of these revolves around the Earth?” His options are the sun, the moon, Venus, and Mars. While it might be surprising that he doesn’t know, more shocking is the result of the audience poll — 56% say the sun:

How can we explain this? The easiest answer, and the video’s title, is that French people appear to be stupid, or were never informed about the Copernican Revolution. But the Brafmans have an explanation based on different cultural attitudes toward reality shows and, ultimately, ideas about fairness.

The general outlines of Who Wants to Be a Millionaire? are the same regardless of country. But distinct cultural patterns have emerged in how audiences act when asked for help. In the U.S., contestants can count on the audience’s goodwill; regardless of the question asked, audiences appear to do their best to help contestants out and the Brafmans report that data shows the audience is right over 90% of the time. I must admit it had never occurred to me that audiences would do anything other than try to be helpful. Though I don’t watch game shows now, as a kid I regularly watched The Price Is Right, among others, with my family, and we always inherently rooted for the contestant, cringing if they seemed to make a bad choice and rejoicing if they won big. We truly wanted these complete strangers to win.

But not all national audiences are so cooperative. When the show was introduced in Russia, contestants quickly learned to be wary of asking the audience for help because Russian audiences frequently mislead them, intentionally giving the wrong answer. It doesn’t seem to have anything to do with the players or the questions they ask for help on.

In France, audiences seem to fall in the middle. They don’t regularly attempt to trick players, as Russian (and according to my googling, Ukrainian) audiences do. But unlike U.S. audiences, they don’t seem willing to help under any circumstances, either. They appear to intentionally give the wrong answer if the contestant asks for help on a question the audience perceives as too easy. If they think the player ought to know the answer they give the wrong response, apparently thinking the contestant deserves to lose if they’re so stupid. In the video you can hear audience laughter when Henri decides to go with the results of the audience poll.

Ori and Rom Brafman suggest this relates to notions of fairness, which have been shown to vary widely by culture. They say that in the U.S., we think it’s fair for people to win large sums of money even if they seem dumb, while in France, there is more concern about whether the individual deserves to win. They consulted historians of Russian society who suggest audience behavior there results from a general mistrust of those who gain sudden wealth. However, they provide no data to directly connect the audience members’ intentional wrong answers to cultural perceptions of fairness more broadly, so I’m somewhat hesitant about this theoretical leap. If you’re an enterprising grad student looking for a dissertation topic, perhaps you can take this project on and get back to me with your results.

But I think this topic is also interesting for the way it highlights the intersection of globalization and local cultures. Who Wants to Be a Millionaire?, like other reality shows such as the various varieties of Idol, are international franchises (Millionaire is owned by Sony), designed to be easily transferable to and implemented in many countries with the same basic blueprint — simply add local talent and you’ve got a successful TV show. But as the variation in Millionaire shows, differences inevitably creep in as a global product or process is used or interpreted on the local level, sometimes in superficial ways but other times to a degree that significantly alters the original product.

Thanks to Kelly V. for the tip about the book!


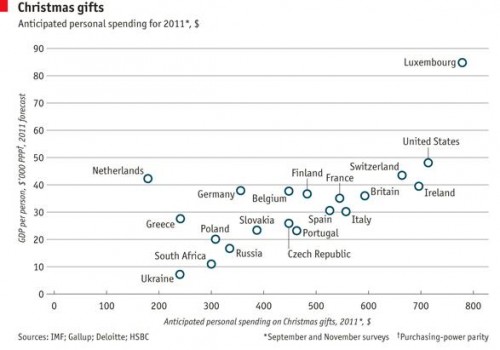
As we enter the last frenzied days of Christmas shopping, Dmitriy T.M. thought it was worth looking at international comparisons in spending on the holiday. The Economist posted a graph based on Gallup polls and other data sources about how much individuals in various countries in Europe, plus the U.S. and South Africa, plan to spend on Christmas shopping this year, plotted against national GDP. Overall, Christmas spending correlates with national wealth, with the Netherlands being a noticeable outlier (spending less than we’d expect) and Luxembourg in a spending league of its own:


Cross-posted at Family Inequality.

I have criticized sloppy statistical work by some international feminist organizations, so I’m glad to have a chance to point out a useful new report and website.

The Progress of the World’s Women is from the United Nations Entity for Gender Equality and the Empowerment of Women. The full-blown site has an executive summary, a long report, and a statistics index page with a download of the complete spreadsheet. I selected a few of the interesting graphics.

Skewed sex ratios (which I’ve written about here and here) are in the news, with the publication of Unnatural Selection, by Mara Hvistendahl. The report shows some of the countries with the most skewed sex ratios, reflecting the practice of parents aborting female fetuses (Vietnam and Taiwan should  be in there, too). With the exception of Korea, they’ve all gotten more skewed since the 1990s, when ultrasounds became more widely available, allowing parents to find out the sex of the fetus early in the pregnancy.

The most egregious inequality between women of the world is probably in maternal mortality. This chart shows, for example, that the chance of a woman dying during pregnancy or birth is about 100- 39-times higher in Africa than Europe. The chart also shows how many of those deaths are from unsafe abortions.

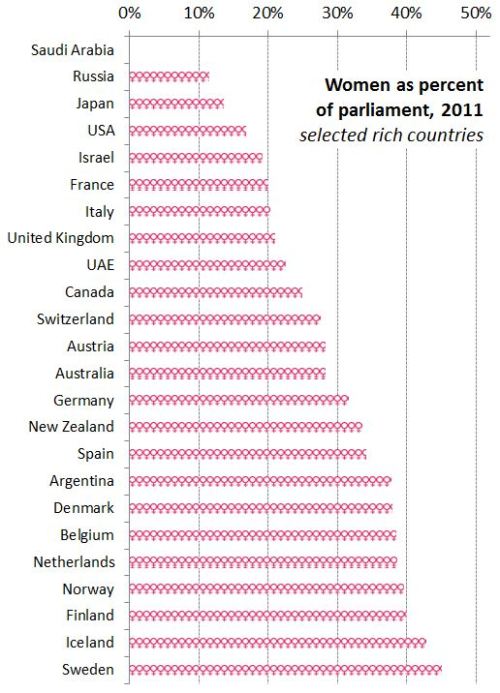
Finally, I made this one myself, showing women as a percentage of parliament in most of the world’s rich countries (the spreadsheet has the whole list). The USA, with 90 women out of 535 members of Congress, comes in at 17%.

The report focuses on law and justice issues, including rape and violence against women, as well as reparations, property rights, and judicial reform. They boil down their conclusions to: “Ten proven approaches to make justice systems work for women“:

1. Support women’s legal organizations

2. Support one-stop shops and specialized services to reduce attrition in the justice chain [that refers to rape cases, for example, not making their way from charge to conviction -pnc]

3. Implement gender-sensitive law reform

4. Use quotas to boost the number of women legislators

5. Put women on the front line of law enforcement

6. Train judges and monitor decisions

7. Increase women’s access to courts and truth commissions in conflict and post-conflict contexts.

8. Implement gender-responsive reparations programmes

9. Invest in women’s access to justice

10. Put gender equality at the heart of the Millennium Development Goals

I’ve argued that the visual aids used in computer programs designed to help us learn new languages are ethnocentric, generic, and uninformative.  Since then, I have been working on an alternative to these images, compiling a database of culturally organized images called the Culturally Authentic Pictorial Lexicon (CAPL).

What strikes me as both a student and a professor of language and culture is that the visual world differs so greatly across cultures and even minor differences are telling in how we organize and perceive our world. Color is one of the easiest ways to find differences in cultures. I have previously discussed the linguistic and cognitive differences of color, but now I want to show some simple examples of color in culture through analysis of various postal systems.

In China, the postal system uses a deep hunter green:

(source)

 In Japan, it is a bright red, much like England.

England:

(source)

Japan:

(source)

 In Germany, it is a bright yellow (think DHL):

(source)

In Russia, it is a lighter but similar shade of the deep postal blue in the U.S.

Russia:

(source)

 The U.S.:

(source)

This example of postal systems is an easy way to illustrate how color becomes one of the central ways to communicate and, although the same message is shared across cultures, the path to that message varies through color.

Michael Shaughnessy is an Associate Professor of German and Chair of Modern Languages at Washington & Jefferson College.  In addition to German language, literature, and culture, he has a professional interest in educational technology, especially the authenticity of multimedia imagery.  His book German Pittsburgh (Arcadia Publishing) highlights the contributions of German speaking immigrants to our area.