nation: Greece

Cross-posted at Montclair SocioBlog.

As I speculated years ago (here and here), it may be hard for Americans to imagine a world where the law guarantees them at least 20 paid vacation days per year.  But such a world exists.  It’s called Europe.*

Americans are the lucky ones.  As Mitt Romney has warned us “European-style benefits” would   “poison the very spirit of America.”  Niall Ferguson, who weighs in frequently on history and economics, contrasts America’s “Protestant work ethic” with what you find in Europe – an “atheist sloth ethic.”

The graph is a bit misleading. It shows only what the law requires of employers.  Americans do get vacations.  But here in America, how much vacation you get, or whether you get any at all, and whether it’s paid – that all depends on what you can negotiate with your employer.

Since American vacations depend on what the boss will grant, some people get more paid vacation, some get less, and some get none.  So it might be useful to ask which sectors of our economy are beehives of the work ethic and which are sloughs of sloth.  (Ferguson’s employer, for example, Harvard University, probably gives him three months off in the summer, plus a week or two or more in the winter between semesters, plus spring break, and maybe a few other days.  I wonder how he would react if Harvard did away with these sloth-inducing policies.)

The Wall Street Journal recently (here) published a graph of BLS data on access to paid vacations; they break it up by industry near the bottom.

Those people who are cleaning your hotel room and serving your meals while you’re on vacation — only about one in four can get any paid vacation days.  And at the other end, which economic sector is most indulgent of sloth among its workforce?  Wall Street.  Four out of five there get paid vacation.

How much paid vacation do we get?  That depends on sector, but it also depends on length of service.  As the Journal says,

Europeans also get more time off: usually a bare minimum of four weeks off a year. Most Americans have to stay in a job for 20 years to get that much, according to BLS data.

—————————

* The graph is from five years ago, but I doubt things have changed much. The US still has no federal or state laws requiring any paid vacation days.

Cross-posted at Reports from the Economic Front.

The Pew Research Center recently published a report titled “Pervasive Gloom About the World Economy.” The following two charts come from Chapter 4 which is called “The Causalities: Faith in Hard Work and Capitalism.”

The first suggests that the belief that hard work pays off remains strong in only a few countries: Pakistan (81%), the U.S. (77%), Tunisia (73%), Brazil (69%), India (67%) and Mexico (65%). The low scores in China, Germany, and Japan are worth noting. This is not to say that people everywhere are not working hard, just that many no longer believe there is a strong connection between their effort and outcome.

The second chart highlights the fact that growing numbers of people are losing faith in free market capitalism.  Despite mainstream claims that “there is no alternative,” a high percentage of people in many countries do not believe that the free market system makes people better off.

GlobeScan polled more than 12,000 adults across 23 countries about their attitudes towards economic inequality and, as the chart below reveals, the results were remarkably similar to those highlighted above.  In fact, as GlobeScan noted, “In 12 countries over 50% of people said they did not believe that the rich deserved their wealth.

It certainly seems that large numbers of people in many different countries are open to new ways of organizing economic activity.

Martin Hart-Landsberg is a professor of economics at Lewis and Clark College. You can follow him at Reports from the Economic Front.

Cross-posted at Reports from the Economic Front.

The Supreme Court has ruled favorably on the legality of the Affordable Care Act.  Actually, despite its name, the Act has more to do with extending and attempting to improve private health insurance coverage than it does with improving care or reducing its cost.

Unfortunately for us, the effort to improve our health care system has remained within bounds set by the needs of private health care providers and insurers.  As President Obama made clear from the start of his push for health care reform, there would be no consideration of a universal system.

Critics of such a universal system are always quick to argue that only market forces driven by the private pursuit of profit can ensure an efficient health care system.  Of course, in determining whether this is true, we need to recognize that efficiency is a complex term and that our health care system, like all systems, produces multiple outcomes.  The most obvious ones are private profit as well as the quality and cost of the relevant health care.

In terms of private profit there can be no doubt that our health care system functions well.  However, the story is quite different if we evaluate it in terms of quality and cost.  The fact that we continue to embrace a private health care system makes clear which measures of efficiency are considered most important and by whom.

The following map shows the countries, colored green, that have adopted a universal health care system.

mf-healthcaremap-p-thumb-615x314-91612.jpg

As Max Fisher explains:

What’s astonishing is how cleanly the green and grey separate the developed nations from the developing, almost categorically. Nearly the entire developed world is colored, from Europe to the Asian powerhouses to South America’s southern cone to the Anglophone states of Australia, New Zealand, and Canada. The only developed outliers are a few still-troubled Balkan states, the Soviet-style autocracy of Belarus, and the U.S. of A., the richest nation in the world.

The handful of developing countries that provide universal access to health care include oil-rich Saudi Arabia and Oman, Latin success story Costa Rica, Kyrgyzstan, and, famously, Cuba, among a few others. A number of countries have attempted universal health care but failed, such as South Africa, which maintains a notoriously inefficient and troubled public plan to complement the private plans popular among middle- and upper-class citizens…

That brings us to another way that America is a big outlier on health care. The grey countries on this map tend to spend significantly less per capita on health care than do the green countries — except for the U.S., where the government spends way more on health care per person than do most countries with free, universal health care. This is also true of health care costs as a share of national GDP — in other words, how much of a country’s money goes into health care.

The OECD just published a major study on the health care systems of its 34 member nations.  It found that:

 Health spending accounted for 17.6% of GDP in the United States in 2010, down slightly from 2009 (17.7%) and by far the highest share in the OECD, and a full eight percentage points higher than the OECD average of 9.5%. Following the United States were the Netherlands (at 12.0% of GDP), and France and Germany (both at 11.6% of GDP).

The United States spent 8,233 USD on health per capita in 2010, two-and-a-half times more than the OECD average of 3,268 USD (adjusted for purchasing power parity). Following the United States were Norway and Switzerland which spent over 5,250 USD per capita. Americans spent more than twice as much as relatively rich European countries such as France, Sweden and the United Kingdom.

combined1.jpg
What does all of this mean in terms of health outcomes?  According to the OECD report:

Most OECD countries have enjoyed large gains in life expectancy over the past decades. In the United States, life expectancy at birth increased by almost 9 years between 1960 and 2010, but this is less than the increase of over 15 years in Japan and over 11 years on average in OECD countries. As a result, while life expectancy in the United States used to be 1½ year above the OECD average in 1960, it is now, at 78.7 years in 2010, more than one year below the average of 79.8 years. Japan, Switzerland, Italy and Spain are the OECD countries with the highest life expectancy, exceeding 82 years.

One possible explanation for this lagging performance, highlighted in an earlier OECD report, is that the U.S. ranked 26th in terms of the number of practicing physicians relative to its population, 29th in terms of the number of doctor consultations per capita, 29th in terms of the number of hospital beds per capita, and 29th in terms of the average length of hospital stay.  At the same time, the “U.S. health system does do a lot of interventions… it has a lot of expensive diagnostic equipment, which it uses a lot. And it does a lot of elective surgery — the sort of activities where it is not always clear cut about whether a particular intervention is necessary or not.”

Private health care providers and insurers are clear about how they measure health care efficiency.  And as long as we rely on them to set the terms of the debate we will continue to suffer the consequences.

Cross-posted at Reports from the Economic Front.

There is big trouble brewing in Europe.  John Ross, in his blog Key Trends in the World Economy, highlights this brewing crisis in a series of charts, some of which I repost below.

This first chart shows the extent of the recovery from the recent economic crisis in the U.S., the EU, and Japan.  While the U.S. GDP has finally regained its past business cycle peak, the same cannot be said for Europe (or Japan).  As of the 3rd quarter 2011, EU GDP was still 1.7% below its previous business cycle peak.  The Eurozone was 1.9% below.

Recent GDP estimates for the 4th quarter show European GDP once again contracting, which strongly suggests that the region is headed back into recession without having regained its previous business cycle peak.  This development implies that Europe faces serious stagnationist pressures.

gdp1.jpg

This chart looks at the growth record for the 5 largest European economies.  Germany has regained its previous GDP peak.  France is making progress toward that end.  These two countries account for 36.2% of European GDP.  However, things are quite different for the UK, Italy, and Spain.  These three countries account for 34.7% of European GDP and not only do they each remain far below their respective previous GDP peaks, their economies are once again heading downward.

gdp2.jpg

The third chart highlights the economic performance of the three countries which have received the most media attention because of fears that their governments will be unable to repay their respective debts.  They are clearly in trouble, adding to the downward pressure on European GDP.  However, despite all the attention paid to them, their combined economies are only one-eighth the size of the combined economies of the UK, Italy and Spain.

gdp3.jpg

The next two charts highlight the fact that economic trends are also dire throughout much of Eastern Europe.

gdp4.jpg

gdp5.jpg

The take-away is that European economic problems are not limited to a few smaller countries.  Some of the largest are also performing poorly and apparently headed back into recession without ever having regained their past business cycle peaks.  It is hard to see Europe escaping recession.  And it is hard to see the U.S., Asia, and Africa escaping the consequences.

How does the U.S. compare to other developed countries on measures of social justice? According to the New York Times, not very well.  The visual below compares countries’ poverty rates, poverty prevention measures, income inequality, spending on pre-primary education, and citizen health.  The “overall” rating is on the far left and the U.S. ranks 27th out of 31.


Via Feministing.  See also how the U.S. ranks on measures of equality and prosperity(33 out of 33, for what it’s worth). Thanks to Dolores R. for the link!

Lisa Wade, PhD is an Associate Professor at Tulane University. She is the author of American Hookup, a book about college sexual culture; a textbook about gender; and a forthcoming introductory text: Terrible Magnificent Sociology. You can follow her on Twitter and Instagram.

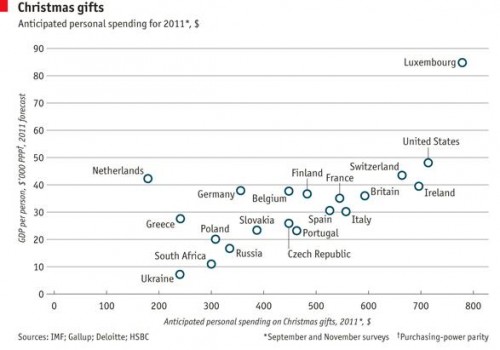
As we enter the last frenzied days of Christmas shopping, Dmitriy T.M. thought it was worth looking at international comparisons in spending on the holiday. The Economist posted a graph based on Gallup polls and other data sources about how much individuals in various countries in Europe, plus the U.S. and South Africa, plan to spend on Christmas shopping this year, plotted against national GDP. Overall, Christmas spending correlates with national wealth, with the Netherlands being a noticeable outlier (spending less than we’d expect) and Luxembourg in a spending league of its own:


Cross-posted at Montclair SocioBlog.

The equation of wealth and virtue seems to come almost naturally, at least among the wealthy.  The logic is simple:  Virtue leads to success, therefore wealth is evidence of one’s virtue.  Virtue, in this case, means the Protestant Ethic – hard work and a willingness to forgo or postpone pleasures.  It follows then that those who are not wealthy must have turned their back on virtue.

David Brooks, in his Friday column (here),  applies this explanation to the wealth of nations.

Why are nations like Germany and the U.S. rich? . . . It’s because many people in these countries believe in a simple moral formula: effort should lead to reward as often as possible.

People who work hard and play by the rules should have a fair shot at prosperity. Money should go to people on the basis of merit and enterprise. Self-control should be rewarded while laziness and self-indulgence should not.

The US, Germany, and the Netherlands are Brooks’s exemplars of these virtues (Brooks uses the word ethos).  The bad countries, the ones whose economies are teetering on the brink, are the grasshoppers to our ant.  There they were – Brooks points his finger at Greece, Italy, and Spain – fiddling and dancing the summer away, refusing to live within their means or “reinforce good values.”

This seems accurate, doesn’t it – the dolce far niente Italians and other Mediterraneans, taking hours at midday for meals and siestas while the industrious Americans, Germans, and Dutch are working away, wolfing down a sandwich at their desks.

Just to be sure I downloaded some OECD data from 2007 – the last year before the big crash – on the number of hours people in different countries work. (Brooks’s three “ant” countries are red, the “grasshoppers” dark blue.)This is puzzling.  The US is slightly above the OECD average, but workers in Greece and Italy spend more hours at work than do Americans, while the Dutch and Germans are down at the low end of the scale.  (I do not know why the OECD still gives data for West Germany as well as Germany.)

I noticed that the OECD also had a measure of “employment protection,” which is basically how hard it is to fire someone.  I figured that workers in non-virtuous countries would be highly protected.  Since it’s nearly impossible for them to be fired, they know they can slack off on the job.  By contrast, virtuous countries would foster Brook’s ethos of “effort, productivity and self-discipline”  in workers, rewarding the industrious, firing the lazy and self-indulgent.I wasn’t surprised that the US anchored the low end of the scale.  Workers here have less job-protection than those in any of the other countries.  And Greece and Spain are above the average.  But so are Germany and the Netherlands, though only slightly, while Italy is slightly below the average.  There’s really not much difference between these three.  And if you look at the array of countries, there seems to be no strong connection between job protection and how well the country is weathering the current long recession.  I’m not sure what the best measure of the overall economy is, but the OECD has composite figure made up from ten main economic indicators.* I just wish we had better measure of Brooks’s “ethos.”

——————-

*  “The Labour Force Survey (MEI) dataset itself covers countries that compile labour statistics from sample household surveys on a monthly or quarterly basis. It is widely accepted that household surveys are the best source for labour market key statistics. In such surveys, information is collected from people living in households through a representative sample. Surveys are based on standard methodology and procedures used all over the world. The 10 subjects available cover labour force, employment, unemployment (including harmonised unemployment), and employees.”


Does American prosperity translate into long retirements?  Not compared to other developed countries in the world.  Flowing Data borrowed OECD numbers on life expectancy and age of retirement to calculate the average number of years in retirement for men and women across many different countries.  The portion of each bar with the line is the average number of years working, while the non-lined portion represents years in retirement.

Largely because of life expectancy, women enjoy more years than men in all states except Turkey, but the number of years varies quite tremendously, from an average of zero years for men in Mexico, to an average of 26 years for women in Austria and Italy.  The United States is way down on this list, not doing so well relatively after all.

Lisa Wade, PhD is an Associate Professor at Tulane University. She is the author of American Hookup, a book about college sexual culture; a textbook about gender; and a forthcoming introductory text: Terrible Magnificent Sociology. You can follow her on Twitter and Instagram.