nation: France

UPDATE:  Since posting this, I’ve discovered that the numbers do not accurately reflect the ratio of CEO vs. worker pay.  Writes PolitiFact:

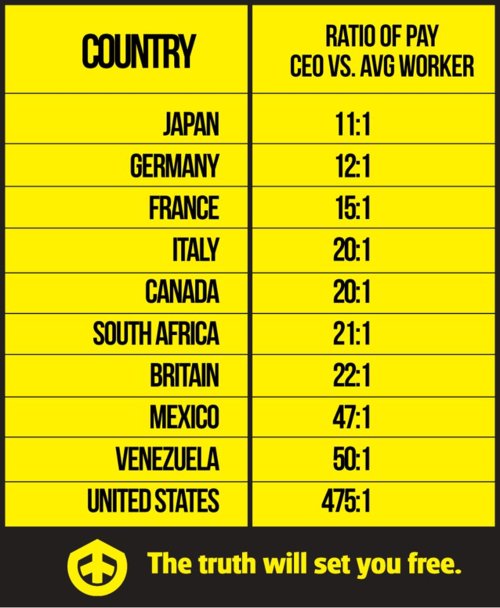
We don’t doubt the chart’s underlying point that the ratio of CEO pay to worker pay is high in the United States, and is likely higher in our free-wheeling economy than it is in the historically more egalitarian nations of Europe.

But in its claim that the U.S. ratio is 475 to 1, the chart conveys a sense of certitude and statistical precision that simply isn’t warranted — and which is contradicted by the facts. The latest number for the U.S. is 185 to 1 in one study and 325 to 1 in another [though in previous years, those ratios have reached as high as 525 to 1] — and those numbers were not generated by groups that might have an ideological interest in downplaying the gaps between rich and poor. We rate the claim on the U.S. ratio False.

I apologize for not vetting this more carefully.

H/T KeepYourHopesUpHigh via GlobalSociologyBlog.

Lisa Wade, PhD is an Associate Professor at Tulane University. She is the author of American Hookup, a book about college sexual culture; a textbook about gender; and a forthcoming introductory text: Terrible Magnificent Sociology. You can follow her on Twitter and Instagram.

Cross-posted at Family Inequality.

In 1994, Sara McLanahan and Gary Sandefur published, Growing Up With A Single Parent: What Hurts, What Helps. The growth of children living with only their mothers was — then as now — a matter of concern not only for children’s well-being, but for intergenerational mobility. One of their empirical conclusions was this:

For children living with a single parent and no stepparent, income is the single most important factor in accounting for their lower well-being as compared with children living with both parents. It accounts for as much as half of their disadvantage. Low parental involvement, supervision, and aspirations and greater residential mobility account for the rest.

The biggest problem, in other words, is economic. The other factors —  involvement, supervision, aspirations, mobility — are related to social class and the time poverty that economically-poor parents experience.

Examples

Here are some bivariate illustrations — that is, head-to-head comparisons of the difference between children of poor and non-poor versus single and married parents.

These are the “skill group” rankings by teachers of children by socioeconomic status (or SES, a composite of parents’ education, occupational prestige and income) versus race/ethnicity, gender and family structure. SES shows the widest spread in reading teachers’ group placement of first graders.

Source: Condron (2007)

Similarly, the poor/nonpoor difference is greater than the two-parent/single-parent difference in kindergarten entry scores:

Source: Early Childhood Longitudinal Study (2009)

Those are just two examples from early-childhood assessments. More importantly, here is the breakdown seen in a longitudinal study of children growing up. When women grow up to be mothers, their poverty level in childhood is more important than their family structure for predicting whether they will be in poverty themselves. The poverty difference is large, the family structure difference is not:

Source: Musik & Mare (2006)

This study included a more sophisticated set of multivariate analyses than this simple graph, but the author’s conclusion fits it:

Net of the correlation between poverty and family structure within a generation, the intergenerational transmission of poverty is significantly stronger than the intergenerational transmission of family structure, and neither childhood poverty nor family structure affects the other in adulthood.

That is, childhood poverty matters more.

Fewer single parents, or less poverty?

But if single parenthood and poverty are so closely related, some people say, we should spend hundreds of millions of dollars promoting marriage to help children avoid poverty (and other problems). That’s what the government has done, with money from the welfare budget. Even if it worked, which it apparently doesn’t, it’s only one approach. What about reducing poverty? And, more specifically, reducing the relative likelihood of poverty in single-parent families versus those with married parents. That is, address the poverty gap between the two groups, rather than the size of the two groups. This has the added advantage of not singling out one group — single mothers — for social stigmatization (of the kind I mentioned here). And, because it defines the problem as economic rather than moral, may make it easier to build public support for helping the poor.

Consider a recent paper by David Brady and Rebekah Burroway, which will be published in Demography. They analyzed the relative poverty of single mothers versus the total population — that is, what percentage had incomes below half the median (per person, after accounting for taxes and government transfers). Such a relative poverty measure is really a measure of inequality, but specifically inequality at the low end. (Regardless of how rich the rich are, it’s theoretically possible to have no one below half the median income). Here is my graph showing that result, with only the countries that have reliable sample sizes in the survey:

The Nordic countries have the lowest overall poverty rates. But in absolute terms their advantage is much bigger for single mothers. (The red line shows equal poverty rates for single mothers and the total population.) The US and UK have the largest difference in poverty rates between single mothers and overall poverty. That is, we have the largest poverty penalty for single motherhood. If the relative poverty rates for single mothers were lower in the US, we might spend more time and money addressing poverty and less trying to change family structures.

Cross-posted at Reports from the Economic Front.

There is big trouble brewing in Europe.  John Ross, in his blog Key Trends in the World Economy, highlights this brewing crisis in a series of charts, some of which I repost below.

This first chart shows the extent of the recovery from the recent economic crisis in the U.S., the EU, and Japan.  While the U.S. GDP has finally regained its past business cycle peak, the same cannot be said for Europe (or Japan).  As of the 3rd quarter 2011, EU GDP was still 1.7% below its previous business cycle peak.  The Eurozone was 1.9% below.

Recent GDP estimates for the 4th quarter show European GDP once again contracting, which strongly suggests that the region is headed back into recession without having regained its previous business cycle peak.  This development implies that Europe faces serious stagnationist pressures.

gdp1.jpg

This chart looks at the growth record for the 5 largest European economies.  Germany has regained its previous GDP peak.  France is making progress toward that end.  These two countries account for 36.2% of European GDP.  However, things are quite different for the UK, Italy, and Spain.  These three countries account for 34.7% of European GDP and not only do they each remain far below their respective previous GDP peaks, their economies are once again heading downward.

gdp2.jpg

The third chart highlights the economic performance of the three countries which have received the most media attention because of fears that their governments will be unable to repay their respective debts.  They are clearly in trouble, adding to the downward pressure on European GDP.  However, despite all the attention paid to them, their combined economies are only one-eighth the size of the combined economies of the UK, Italy and Spain.

gdp3.jpg

The next two charts highlight the fact that economic trends are also dire throughout much of Eastern Europe.

gdp4.jpg

gdp5.jpg

The take-away is that European economic problems are not limited to a few smaller countries.  Some of the largest are also performing poorly and apparently headed back into recession without ever having regained their past business cycle peaks.  It is hard to see Europe escaping recession.  And it is hard to see the U.S., Asia, and Africa escaping the consequences.

How does the U.S. compare to other developed countries on measures of social justice? According to the New York Times, not very well.  The visual below compares countries’ poverty rates, poverty prevention measures, income inequality, spending on pre-primary education, and citizen health.  The “overall” rating is on the far left and the U.S. ranks 27th out of 31.


Via Feministing.  See also how the U.S. ranks on measures of equality and prosperity(33 out of 33, for what it’s worth). Thanks to Dolores R. for the link!

Lisa Wade, PhD is an Associate Professor at Tulane University. She is the author of American Hookup, a book about college sexual culture; a textbook about gender; and a forthcoming introductory text: Terrible Magnificent Sociology. You can follow her on Twitter and Instagram.

For the last week of December, we’re re-posting some of our favorite posts from 2011.

————————

In Sway: The Irresistible Pull of Irrational Behavior, Ori and Rom Brafman discuss a contestant on Qui Veut Gagner des Millions?, the French version of Who Wants to Be a Millionaire?, who asks the audience for help with the question, “Which of these revolves around the Earth?” His options are the sun, the moon, Venus, and Mars. While it might be surprising that he doesn’t know, more shocking is the result of the audience poll — 56% say the sun:

How can we explain this? The easiest answer, and the video’s title, is that French people appear to be stupid, or were never informed about the Copernican Revolution. But the Brafmans have an explanation based on different cultural attitudes toward reality shows and, ultimately, ideas about fairness.

The general outlines of Who Wants to Be a Millionaire? are the same regardless of country. But distinct cultural patterns have emerged in how audiences act when asked for help. In the U.S., contestants can count on the audience’s goodwill; regardless of the question asked, audiences appear to do their best to help contestants out and the Brafmans report that data shows the audience is right over 90% of the time. I must admit it had never occurred to me that audiences would do anything other than try to be helpful. Though I don’t watch game shows now, as a kid I regularly watched The Price Is Right, among others, with my family, and we always inherently rooted for the contestant, cringing if they seemed to make a bad choice and rejoicing if they won big. We truly wanted these complete strangers to win.

But not all national audiences are so cooperative. When the show was introduced in Russia, contestants quickly learned to be wary of asking the audience for help because Russian audiences frequently mislead them, intentionally giving the wrong answer. It doesn’t seem to have anything to do with the players or the questions they ask for help on.

In France, audiences seem to fall in the middle. They don’t regularly attempt to trick players, as Russian (and according to my googling, Ukrainian) audiences do. But unlike U.S. audiences, they don’t seem willing to help under any circumstances, either. They appear to intentionally give the wrong answer if the contestant asks for help on a question the audience perceives as too easy. If they think the player ought to know the answer they give the wrong response, apparently thinking the contestant deserves to lose if they’re so stupid. In the video you can hear audience laughter when Henri decides to go with the results of the audience poll.

Ori and Rom Brafman suggest this relates to notions of fairness, which have been shown to vary widely by culture. They say that in the U.S., we think it’s fair for people to win large sums of money even if they seem dumb, while in France, there is more concern about whether the individual deserves to win. They consulted historians of Russian society who suggest audience behavior there results from a general mistrust of those who gain sudden wealth. However, they provide no data to directly connect the audience members’ intentional wrong answers to cultural perceptions of fairness more broadly, so I’m somewhat hesitant about this theoretical leap. If you’re an enterprising grad student looking for a dissertation topic, perhaps you can take this project on and get back to me with your results.

But I think this topic is also interesting for the way it highlights the intersection of globalization and local cultures. Who Wants to Be a Millionaire?, like other reality shows such as the various varieties of Idol, are international franchises (Millionaire is owned by Sony), designed to be easily transferable to and implemented in many countries with the same basic blueprint — simply add local talent and you’ve got a successful TV show. But as the variation in Millionaire shows, differences inevitably creep in as a global product or process is used or interpreted on the local level, sometimes in superficial ways but other times to a degree that significantly alters the original product.

Thanks to Kelly V. for the tip about the book!


Cross-posted at Montclair SocioBlog.

Children in American movies are typically superior to adults.  The kids are not only all right, they are wiser, less corrupt, and more competent.  “Home Alone” is a classic example, where the plucky, resourceful kid triumphs over both the vindictiveness of the burglars and the mindlessness of his parents.  (An earlier post on children in films is here.)

“The Descendants,” the recent film with George Clooney (I saw it last night), starts more like a French film, where children are, well, children, and it’s the parents who must endure and learn to cope with the kids’ immaturity and thoughtlessness.

Clooney is Matt King, and the name is a deliberate irony.  Kinglike, he must decide the fate of a huge tract of pristine Kauai land that his family has owned for many generations.  The money from the sale will make him and his many cousins and their families rich.  Which developer will he sell the land to?But as a husband and father he is far being monarch of all he surveys.  His wife has been in an accident and lies in a coma.  His two daughters are unapologetically impudent and insufferable.  As the film starts, Scottie, age ten, has sent a nasty, obscene text to a classmate.  Alex, seventeen, now at an expensive private rehab/therapeutic school, first appears on screen drunk, having  sneaked out of her room at night with another girl.  Then there’s Sid, Alex’s friend, a slightly older boy, all stupidity and insensitivity, a chubby incarnation of Beavis and Butthead.Then the film magically transforms the kids.  Each has been introduced as obtuse, obscene, or obnoxious. But now Alex, it turns out, knows more than her father does, at least in one crucial area – that his wife, now on life support, had been cheating on him.

The kids change from being French, a burden for the grown-up, to becoming almost classically American, not superior but equal.  They are now his partners.  Teens and adult are a team trying to discover the identity and location of the seducer so that King can confront him.  The teenagers are suddenly much less difficult and much more helpful, while King sometimes appears uncertain and even silly, peering over hedges to spy on his wife’s lover.   He asks his daughter for advice.  He even asks Sid what he should do.(You can get some sense of this transformation in the trailers here and here, which also outline the rest of the story.)

Still, the movie doesn’t go pure Hollywood.  It does not present the world as a character contest where good faces evil, where the right action is clear and the only question is how the hero will come to make it.  Instead, it shows a grown-up trying to understand and cope with problems and people he cannot really control.

And nobody blows up a helicopter.

As we enter the last frenzied days of Christmas shopping, Dmitriy T.M. thought it was worth looking at international comparisons in spending on the holiday. The Economist posted a graph based on Gallup polls and other data sources about how much individuals in various countries in Europe, plus the U.S. and South Africa, plan to spend on Christmas shopping this year, plotted against national GDP. Overall, Christmas spending correlates with national wealth, with the Netherlands being a noticeable outlier (spending less than we’d expect) and Luxembourg in a spending league of its own:


Cross-posted at Reports From the Economic Front.

The media generally talk about the economy in national terms — as if economic trends affect us all equally and we all share a common interest in supporting or opposing the same economic policies.  This comforting view tends to promote political passivity — since we are all in the same “boat,” it makes sense to leave policy making to the experts.

A recently published study on income distribution by economists Anthony Atkinson, Thomas Piketty and Emmanuel Saez stands as a welcome corrective.  Uwe E. Reinhardt discusses some of the main implications of their work in his New York Times blog.

Reinhardt’s Figure 1 shows average annual income growth for households in the United States and the different experiences of the top 1% and the bottom 99%.  From 1976 to 2007, average household income grew at an average annual rate of 1.2%.  Over the same period, the top 1% of households experienced an average annual income gain of 4.4% while the bottom 99% of households gained only 0.6% a year.  Household income gains were higher in both subperiods (1993-2000 and 2002-2007), in large part because these subperiods were recession free.

02economix-growth-chart1-blog480.jpg

Figure 2 shows the share of total income growth in each time period that was captured by the top 1% of households.  Over the years 1976 to 2007, these households captured 58% of all income generated.  Their share was an astounding 65% in the period 2002 to 2007.

02economix-growth-chart2-blog480.jpg

This skewed income distribution means that average income figures present a highly misleading picture of the American experience.  As Reinhardt explains:

So if an American macroeconomist — a specialist who tends to think of nations as people — or high-level government officials or politicians mimicking a macroeconomist boasted on a television talk show that “average family income grew by 3 percent during 2002-7, more than in most European economies,” about 99 percent of American viewers, reflecting on their own experience, would probably scratch their heads and wonder, “What is this guy talking about?”

Figure 3 highlights the growth in real GDP per capita and median household income from 1975 to 2007.  The data show a growing divergence between what working people produced and what the average household received from that production.  Real GDP per capita rose by an annual compound rate of 1.9% while real median household income increased by less than 0.5%.

02economix-growth-chart3-blog480.jpg

As Reinhardt points out: “Other than national pride in league tables, that 1.9 percent average economic growth does not mean much for the experience of the median household in the United States.”

This brings us back to the issue of whether it makes sense to talk in “national” terms, especially given the dominance of the top 1% of households.  According to Anthony Atkinson, Thomas Piketty and Emmanuel Saez:

Average real income per family in the United States grew by 32.2 percent from 1975 to 2006, while they grew only by 27.1 percent in France during the same period, showing that the macroeconomic performance in the United States was better than the French one during this period. Excluding the top percentile, average United States real incomes grew by only 17.9 percent during the period while average French real incomes — excluding the top percentile — still grew at much the same rate (26.4 percent) as for the whole French population. Therefore, the better macroeconomic performance of the United States and France is reversed when excluding the top 1 percent.

None of this is to suggest that U.S. society is best understood in terms of a simple division between the top 1% and the bottom 99%; the latter group is far from homogeneous.  Still, this division alone is big enough to establish that talking in simple national terms hides more than it illuminates about the American experience.  Said differently, just because the top 1% of U.S. households have reason to celebrate the U.S. economic model doesn’t mean that the rest of us should join in the celebration.