globalization


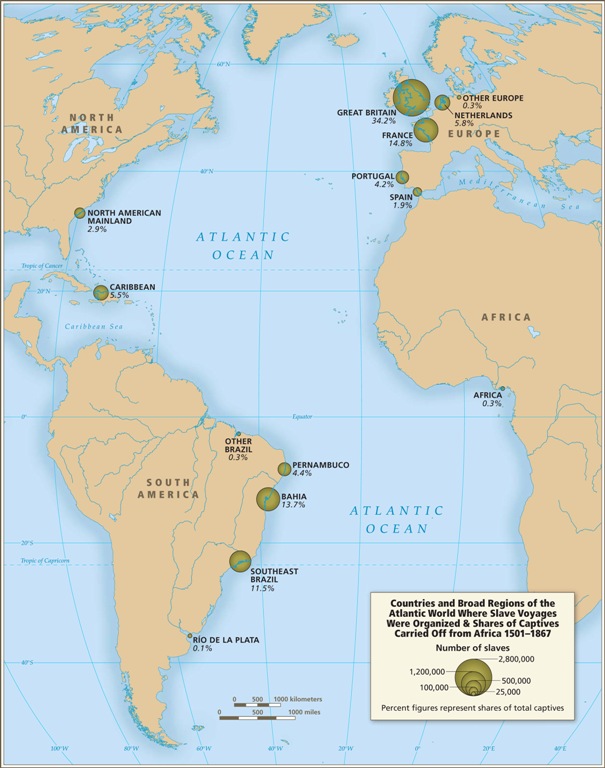
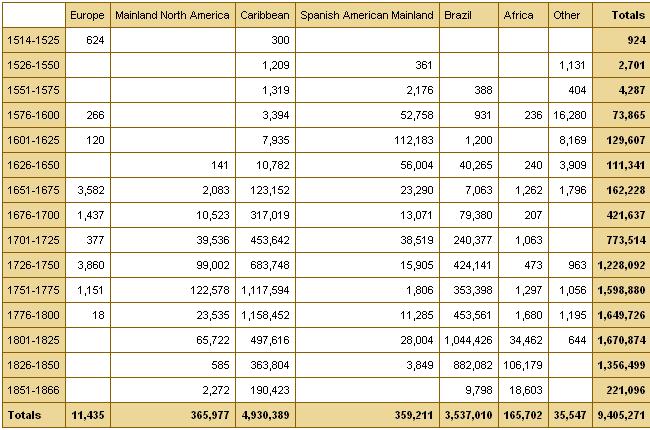
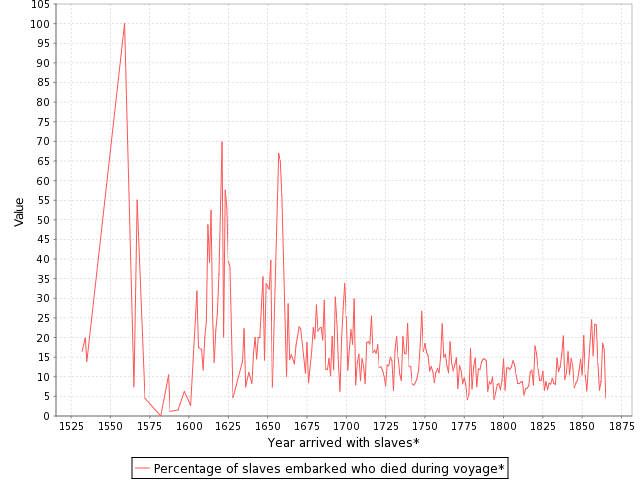
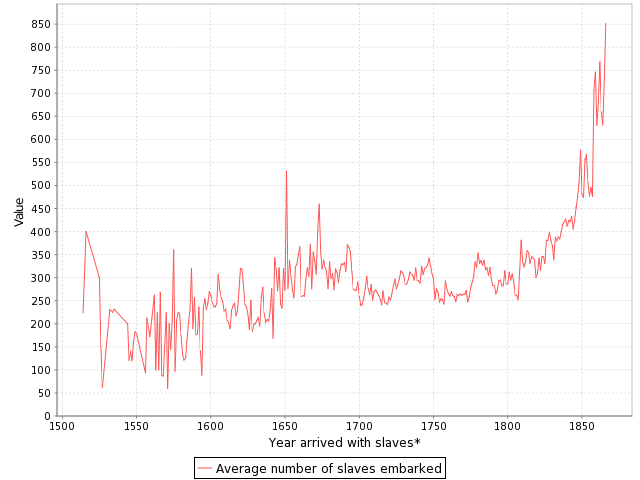
In the first five minutes of the clip below, economist Jeffrey Sachs explains to Dalton Conley that ending poverty in Africa requires a demographic transition, one where we move from high fertility and high mortality to low fertility and low mortality.

How to encourage such a transition?

1. Bring down mortality with advanced medicine. Declines in childhood mortality lead families to choose to have fewer children (’cause they don’t have to).

2. Make sure girls go and stay in school; they’ll get married later, and have less babies.

3. Provide free contraceptive services and family planning education.

Also see Dr. Sachs explain why Africa ended up so poor in the first place.

Lisa Wade, PhD is an Associate Professor at Tulane University. She is the author of American Hookup, a book about college sexual culture; a textbook about gender; and a forthcoming introductory text: Terrible Magnificent Sociology. You can follow her on Twitter and Instagram.

Emory University has a very detailed database about the Atlantic slave trade, titled Voyages: The Trans-Atlantic Slave Trade Database, which I don’t believe we’ve posted before (my apologies if we have). It includes nine maps providing information on major points of departure and destination ports for the trans-Atlantic trade; here’s a general overview:

Initially the vast majority of slave voyages were organized by firms or individuals in Spain and Portugal; however, over time the slave trade was dominated by groups from northern Europe. Great Britain eventually played a major role, and over 1/3 of documented slave voyages were organized there.The description of Map 6 explains, “vessels from the largest seven ports, Rio de Janeiro, Bahia, Liverpool, London, Nantes, Bristol, and Pernambuco carried off almost three-quarters of all captives removed from Africa via the Atlantic Ocean.”

This map shows where voyages were organized, and the % of all documented African slaves that voyages from that country/area transported:

In the U.S., students generally learn about slavery in relation to cotton plantations and, to a lesser extent, tobacco. However, overall those two crops played a relatively minor role in the growth of the global slave trade. It was the growing taste for sugar, and the creation of sugar plantations, particularly in the Caribbean and South American coastal areas, that produced such an enormous demand for African slaves in the Americas. According to the Voyages website, less than 4% of all Africans captured were sold in North America.

The website also has a database of thousands of documented trips in the trans-Atlantic slave trade, including everything from point of origin, destination, number of slaves, % who died during voyage, length of trip, and so on. Some include many more details than others, as you’d expect. You can also create tables to display the variables you’re interested in. Here’s the table showing the slave trade, broken into 25-year intervals and by destination. We can clearly see that the slave trade made one big jump in the late 1500s (going from 4,287 in the 1551-1575 interval to 73,865 between 1576 and the end of the century) and another huge jump in the late 1600s, with the height of the slave trade occuring in the 1700s through the mid-1800s:

You can also create various graphs and charts. Here is a graph of the % of slaves who died during the trip, by year:

I presume the extremely high numbers in the 1550s must be skewed by some ships that sank or met some other disaster that led to the death of everyone aboard.

Over time, ships carried larger numbers of individuals per trip:

The individuals taken as part of the slave trade were predominantly male:

Documented types of resistance from captives or from Africans trying to free them:

You can spend quite a bit of time on this, I warn you — creating timelines, graphs, and so on. It’s taken me an hour to write this post because I keep getting distracted creating charts and tables. Overall, the site is a fantastic resource for both specific information and for helping illuminate the enormity of the Atlantic slave trade. Thanks to Shamus Khan for the tip.

Well, it’s 2011. Sometime this year, the global population will pass the 7 billion mark. Jessica B. sent in this video, from National Geographic, that puts that into some perspective, showing the rapid increase in the pace of population growth over time:

Michael Konczal summarizes a depressing story for today’s unemployed and all of us in nations hardest hit by the current recession (via ginandtacos).

Till von Wachter, Jae Song and Joyce Manchester show that unemployment’s negative effect on your pocketbook persists long after re-employment. The figure below shows what happened to the incomes of people who did and did not lose their job during the 1982 recession. It shows that those that lost their jobs (the grey line) saw a decrease in earnings that has yet to recover. Controlling for inflation, on average the unemployed make less now than they did before they lost their jobs 20 years ago.

Quotes Konczal:

…the net loss to a displaced worker with six years of job tenure is approximately $164,000, which exceeds 20 percent of the average lifetime earnings of these workers. These future earnings losses dwarf the losses associated from the period of unemployment itself.

This same pattern can be found at the society level. Michael Greenstone and Adam Looney made the same comparison across countries that were hit the hardest by the recession (purple line) and countries hit less hard (green line). The incomes of individuals in the hardest hit nations were harmed long-term:

Greenstone and Looney show the same pattern for the unemployment rate:

Lisa Wade, PhD is an Associate Professor at Tulane University. She is the author of American Hookup, a book about college sexual culture; a textbook about gender; and a forthcoming introductory text: Terrible Magnificent Sociology. You can follow her on Twitter and Instagram.


Annie Leonard tackles e-waste (what happens after we’re done with our computers, cell phones, etc) in the latest 7-minute edition in her Story of Stuff series (see also her first story of stuff and her analysis of bottled water and cap and trade).

Via Reports from the Economic Front.

Lisa Wade, PhD is an Associate Professor at Tulane University. She is the author of American Hookup, a book about college sexual culture; a textbook about gender; and a forthcoming introductory text: Terrible Magnificent Sociology. You can follow her on Twitter and Instagram.

When companies advertise their products in largely segregated markets, they can tell different, even opposing stories to different groups of people with confidence that the messages will reach their intended audience, and not the unintended one. In an earlier post, for example, we showed how Basil Hayden Bourbon, Miller Lite, and Crown Royal were advertised differently in separated markets.

I was reminded of this phenomenon when DPK, as well as Sean M. of Santa Fe College, submitted this ad for Coca Cola in China.   The ad ran during the 2008 Olympics.  In fact, the Coca Cola company has partnered with the Olympics for over 80 years, so the fact that they advertised there isn’t surprising; they spent $75 million dollars advertising in China that year.

The slogan, “Red Around the World,” clearly references the color of Coca Cola marketing, but it is also the color China uses to represent itself, as well as the color associated with communism.  Meanwhile, the visual of the ad invokes communist propaganda.  Coca Cola appears to be solidly on China’s side in this ad, even leading the charge towards a Chinese communist take-over of the world (if I may be a bit dramatic).

This is in stark contrast to the long-standing effort by Coca Cola to market itself as a distinctly American drink.

I am supposing here that the ability to target their marketing to the Chinese (even during the Olympics?) offered Coca Cola some protection from a backlash against the company from both the left and the right (based on the argument that Coca Cola is pro-China/pro-communism/anti-human rights).

Lisa Wade, PhD is an Associate Professor at Tulane University. She is the author of American Hookup, a book about college sexual culture; a textbook about gender; and a forthcoming introductory text: Terrible Magnificent Sociology. You can follow her on Twitter and Instagram.


In this seven-minute video, Economist Jeffrey Sachs explains why economic development in Africa remains elusive. He summarizes the geographical, technological, social, and political conditions that held Africa back but propelled parts of Asia forward (he compares to India). Development, he notes, is not simply a matter of wishful thinking and hard work on the part of Africans (as many like to claim), nor is it a matter of just doing what worked elsewhere (as others like to say), but instead requires institutional commitments, economic resources, and global political will.

Lisa Wade, PhD is an Associate Professor at Tulane University. She is the author of American Hookup, a book about college sexual culture; a textbook about gender; and a forthcoming introductory text: Terrible Magnificent Sociology. You can follow her on Twitter and Instagram.

Cross-posted at Reports from the Economic Front.

How do corporations escape paying taxes?  Businessweek recently ran a story on Google that helps to explain how they do it.

The story begins by noting that: “Google has made $11.1 billion overseas since 2007.  It paid just 2.4 percent in taxes.  And that’s legal.”   This is pretty incredible because Google does business in many advanced capitalist countries with high tax rates.  For example, “The corporate tax rate in the U.K., Google’s second-largest market after the U.S., is 28 percent.”

While the article focuses on Google, and how it avoids paying taxes, it made clear that most of the leading high-technology companies use remarkably similar techniques to achieve similar results.

Ok, so how does Google do it?  Google’s office in Ireland is the center of the company’s international operations.  In 2009 it “was credited with 88 percent of the search juggernaut’s $12.5 billion in sales outside the U.S.”  But Google doesn’t pay taxes on that amount, because most of the profits went to Bermuda, where there is no corporate income tax.

So, how did Google get its profits to Bermuda?  Businessweek explains:

Google’s profits travel to the island’s white sands via a convoluted route known to tax lawyers as the “Double Irish” and the “Dutch Sandwich.” In Google’s case, it generally works like this: When a company in Europe, the Middle East, or Africa purchases a search ad through Google, it sends the money to Google Ireland. The Irish government taxes corporate profits at 12.5 percent, but Google mostly escapes that tax because its earnings don’t stay in the Dublin office, which reported a pretax profit of less than 1 percent of revenues in 2008.

Irish law makes it difficult for Google to send the money directly to Bermuda without incurring a large tax hit, so the payment makes a brief detour through the Netherlands, since Ireland doesn’t tax certain payments to companies in other European Union states. Once the money is in the Netherlands, Google can take advantage of generous Dutch tax laws. Its subsidiary there, Google Netherlands Holdings, is just a shell (it has no employees) and passes on about 99.8 percent of what it collects to Bermuda. (The subsidiary managed in Bermuda is technically an Irish company, hence the “Double Irish” nickname.)

This set-up (as Businessweek describes it) also helps Google lower its tax bill in the U.S.  Google Ireland licenses its search and advertizing technology from Google’s headquarters in Mountain View, California.  Obviously this technology is worth a lot—but Google headquarters keeps the licensing fee to Google Ireland low.  Doing so means that Google headquarters can minimize its U.S. earnings and thus its tax obligations to the U.S. government.  And of course, Google Ireland knows how to move its profits around to minimize its tax liabilities.

Not surprisingly, corporations are always eager to learn from each other.  Thus, “Facebook is preparing a structure similar to Google’s that will send earnings from Ireland to the Cayman Islands, according to company filings and a person familiar with the arrangement.”  Microsoft already has one in place.

According to one study cited by Businessweek (done by Kimberly A Clausing, an economics professor at Reed College), these kinds of profit shifting arrangements cost the U.S. government as much as $60 billion a year.  And of course Ireland also loses plenty.  Too bad that the governments of Ireland and the U.S. are suffering from large federal deficits and under immense pressure to slash spending.   Collateral damage I guess to the profit-making drive.

What is being done to change this apparently legal racket?  According to Businessweek:

The government has made halting steps to change the rules that let multinationals shift income overseas. In 2009 the Treasury Dept. proposed levying taxes on certain payments between U.S. companies’ foreign subsidiaries, potentially including Google’s transfers from Ireland to Bermuda. The idea was dropped after Congress and Treasury officials were lobbied by companies including General Electric, Hewlett-Packard, and Starbucks, according to federal disclosures compiled by the nonprofit Center for Responsive Politics. In February the Obama Administration proposed measures to curb companies’ ability to shift profits offshore, but they’ve largely stalled.

nice cozy system, isn’t it.