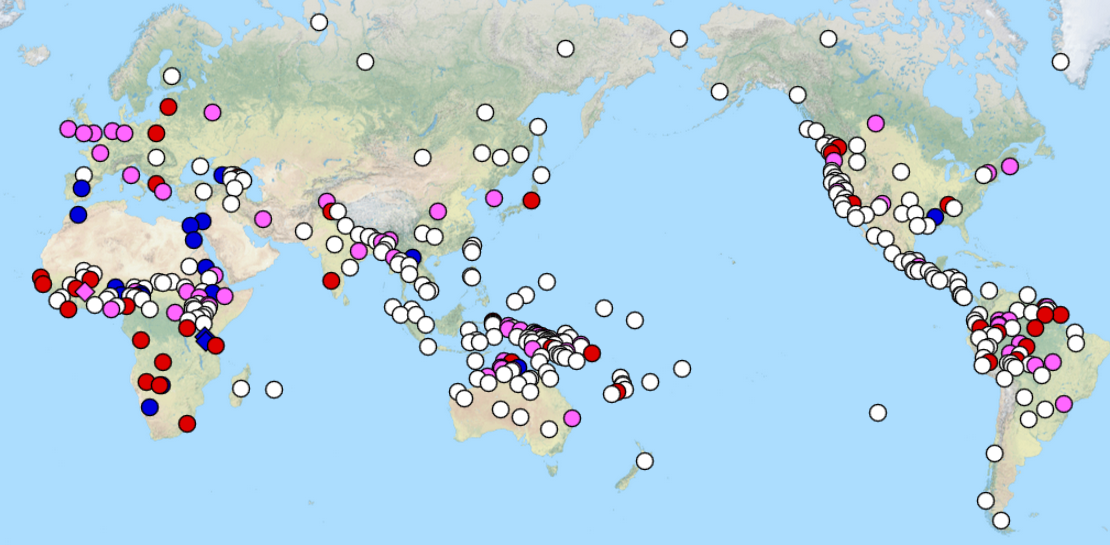
The map below is an interactive available at the World Atlas of Language Structures. It represents an extensive, but not quite comprehensive collection of world languages. Each dot represents one. White dots are languages that do not include gendered pronouns. No “he” or “she.” Just a gender neutral word that means person.
The colored dots refer to languages with gendered pronouns, but there are more than one kind, as indicated by the Values key. The number on the right, further, indicates how many languages fit into each group. Notice that the majority of languages represented here (57%) DO NOT have gendered pronouns.
The map at the site is interactive. Go there to click on those dots and explore.
Laura A. sent in a video in which African American men ask people in Fuzhou, China, what race they believe people in some photos are:
It’s a good example of the social construction of race. Notice how several people in the photos who would be considered Black in the U.S. don’t seem Black to the Chinese people looking at them, because they don’t have the features that they assume Black people have (such as big lips). Since they don’t have those features…they can’t be Black. We also see here that racial differences that would be easily identified in one culture (such as the U.S.) aren’t necessarily recognized in the same way in another. If race were a fixed, biological characteristic, we’d expect more consistency in how it’s defined, how many races people are divided into, and so on.
At about 3:45 you can see the African American men compare their skin color to some Chinese teens (?), who initially define themselves as “yellow people.” But after comparing their skin color, the Black men tell them they’re Black too. I wouldn’t say that the teens seem to be taking the news with great excitement.
Of course, it’s also interesting that the filmmakers refer to the people in the pictures as “really” Black, and tell the Chinese people who are guessing whether they are right or wrong in guessing their race, which implies there actually is a specific race that they belong to. They’re correct in saying that’s the race most people in the U.S. would place those individuals in, but since race is socially constructed, you can’t really say any way of categorizing people by race is “right” or “wrong.”
Originally posted in 2009.
Gwen Sharp is an associate professor of sociology at Nevada State College. You can follow her on Twitter at @gwensharpnv.
As workers battle to raise the minimum wage it is nice to see more evidence that doing so helps both low wage workers and state economies.
Thirteen states raised their respective minimum wages in 2014: AZ, CA, CT, FL, MO, MT, NJ, NY, OH, OR, RI, VT, and WA. Elise Gould, an economist at the Economic Policy Institute, compared labor market changes in these thirteen states with changes in the rest of the states from the first half of 2013 to the first half of 2014.
Economic analyst Jared Bernstein summarizes the results as follows:
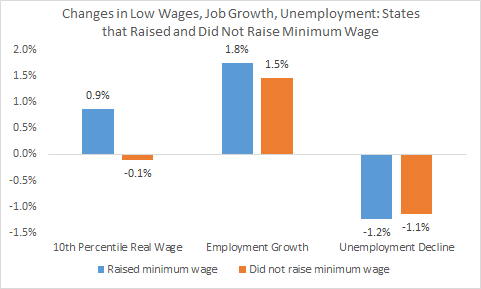
[Gould] compares the 10th percentile [lowest earners] wage growth among these thirteen states that increased their minimums with the rest that did not. The results are the first two bars in the figure below.
Real wages for low-wage workers rose by just about 1% over the past year in the states that raised their minimum wages, and were flat (down 0.1%) in the other states.
OK, but did those increases bite into employment growth, as opponents typically insist must be the case? Not according to the other two sets of bars. They show that payroll employment growth was slightly faster in states that raised, and the decline in unemployment, slightly greater.
In short, raising the minimum wage did boost the earnings of those at the bottom of the income distribution. Moreover, workers in states that raised the minimum wage also enjoyed greater employment growth and a greater decline in unemployment than did workers in states that did not.
I don’t yet have a copy of Matt Richtel’s new book, A Deadly Wandering: A Tale of Tragedy and Redemption in the Age of Attention. Based on his Pulitzer-prize winning reporting for the New York Times, however, I’m afraid it’s unlikely to do justice to the complexity of the relationship between mobile phones and motor vehicle accidents. Worse, I fear it distracts attention from the most important cause of traffic fatalities: driving.
A bad sign
The other day Richtel tweeted a link to this old news article that claims texting causes more fatal accidents for teens than alcohol. The article says some researcher estimates “more than 3,000 annual teen deaths from texting,” but there is no reference to a study or any source for the data used to make the estimate. As I previously noted, that’s not plausible.
In fact, only 2,823 teens teens died in motor vehicle accidents in 2012 (only 2,228 of whom were vehicle occupants). So, I get 7.7 teens per day dying in motor vehicle accidents, regardless of the cause. I’m no Pulitzer-prize winning New York Times journalist, but I reckon that makes this giant factoid on Richtel’s website wrong, which doesn’t bode well for the book:
In fact, I suspect the 11-per-day meme comes from Mother Jones (or someone they got it from) doing the math wrong on that Newsdaynumber of 3,000 per year and calling it “nearly a dozen” (3,000 is 8.2 per day). And if you Google around looking for this 11-per day statistic, you find sites like textinganddrivingsafety.com, which, like Richtel does in his website video, attributes the statistic to the “Institute for Highway Safety.” I think they mean the Insurance Institute for Highway Safety, which is the source I used for the 2,823 number above. (The fact that he gets the name wrong suggests he got the statistic second-hand.) IIHS has an extensive page of facts on distracted driving, which doesn’t have any fact like this (they actually express skepticism about inflated claims of cellphone effects).
After I contacted him to complain about that 11-teens-per-day statistic, Richtel pointed out that the page I linked to is run by his publisher, not him, and that he had asked them to “deal with that stat.” I now see that the page includes a footnote that says, “Statistic taken from the Insurance Institute for Highway Safety’s Fatality Facts.” I don’t think that’s true, however, since the “Fatality Facts” page for teenagers still shows 2,228 teens (passengers and drivers) killed in 2012. Richtel added in his email to me:
As I’ve written in previous writings, the cell phone industry also takes your position that fatality rates have fallen. It’s a fair question. Many safety advocates point to air bags, anti-lock brakes and wider roads — billions spent on safety — driving down accident rates (although accidents per miles driven is more complex). These advocates say that accidents would’ve fallen far faster without mobile phones and texting. And they point out that rates have fallen far faster in other countries (deaths per 100,000 drivers) that have tougher laws. In fact, the U.S. rates, they say, have fallen less far than most other countries. Thank you for your thoughtful commentary on this. I think it’s a worthy issue for conversation.
I appreciate his response. Now I’ll read the book before complaining about him any more.
The shocking truth
I generally oppose scare-mongering manipulations of data that take advantage of common ignorance. The people selling mobile-phone panic don’t dwell on the fact that the roads are getting safer and safer, and just let you go on assuming they’re getting more and more dangerous. I reviewed all that here, showing the increase in mobile phone subscriptions relative to the decline in traffic accidents, injuries, and deaths.
That doesn’t mean texting and driving isn’t dangerous. I’m sure it is. Cell phone bans may be a good idea, although the evidence that they save lives is mixed. But the overall situation is surely more complicated than TEXTING-WHILE-DRIVING EPIDEMIC suggests. The whole story doesn’t seem right — how can phones be so dangerous, and growing more and more pervasive, while accidents and injuries fall? At the very least, a powerful part of the explanation is being left out. (I wonder if phones displace other distractions, like eating and putting on makeup; or if some people drive more cautiously while they’re using their phones, to compensate for their distraction; or if distracted phone users were simply the worst drivers already.)
Beyond the general complaint about misleading people and abusing our ignorance, however, the texting scare distracts us (I know, it’s ironic) from the giant problem staring us in the face: our addiction to private vehicles itself costs thousands of lives a year (not including the environmental effects).
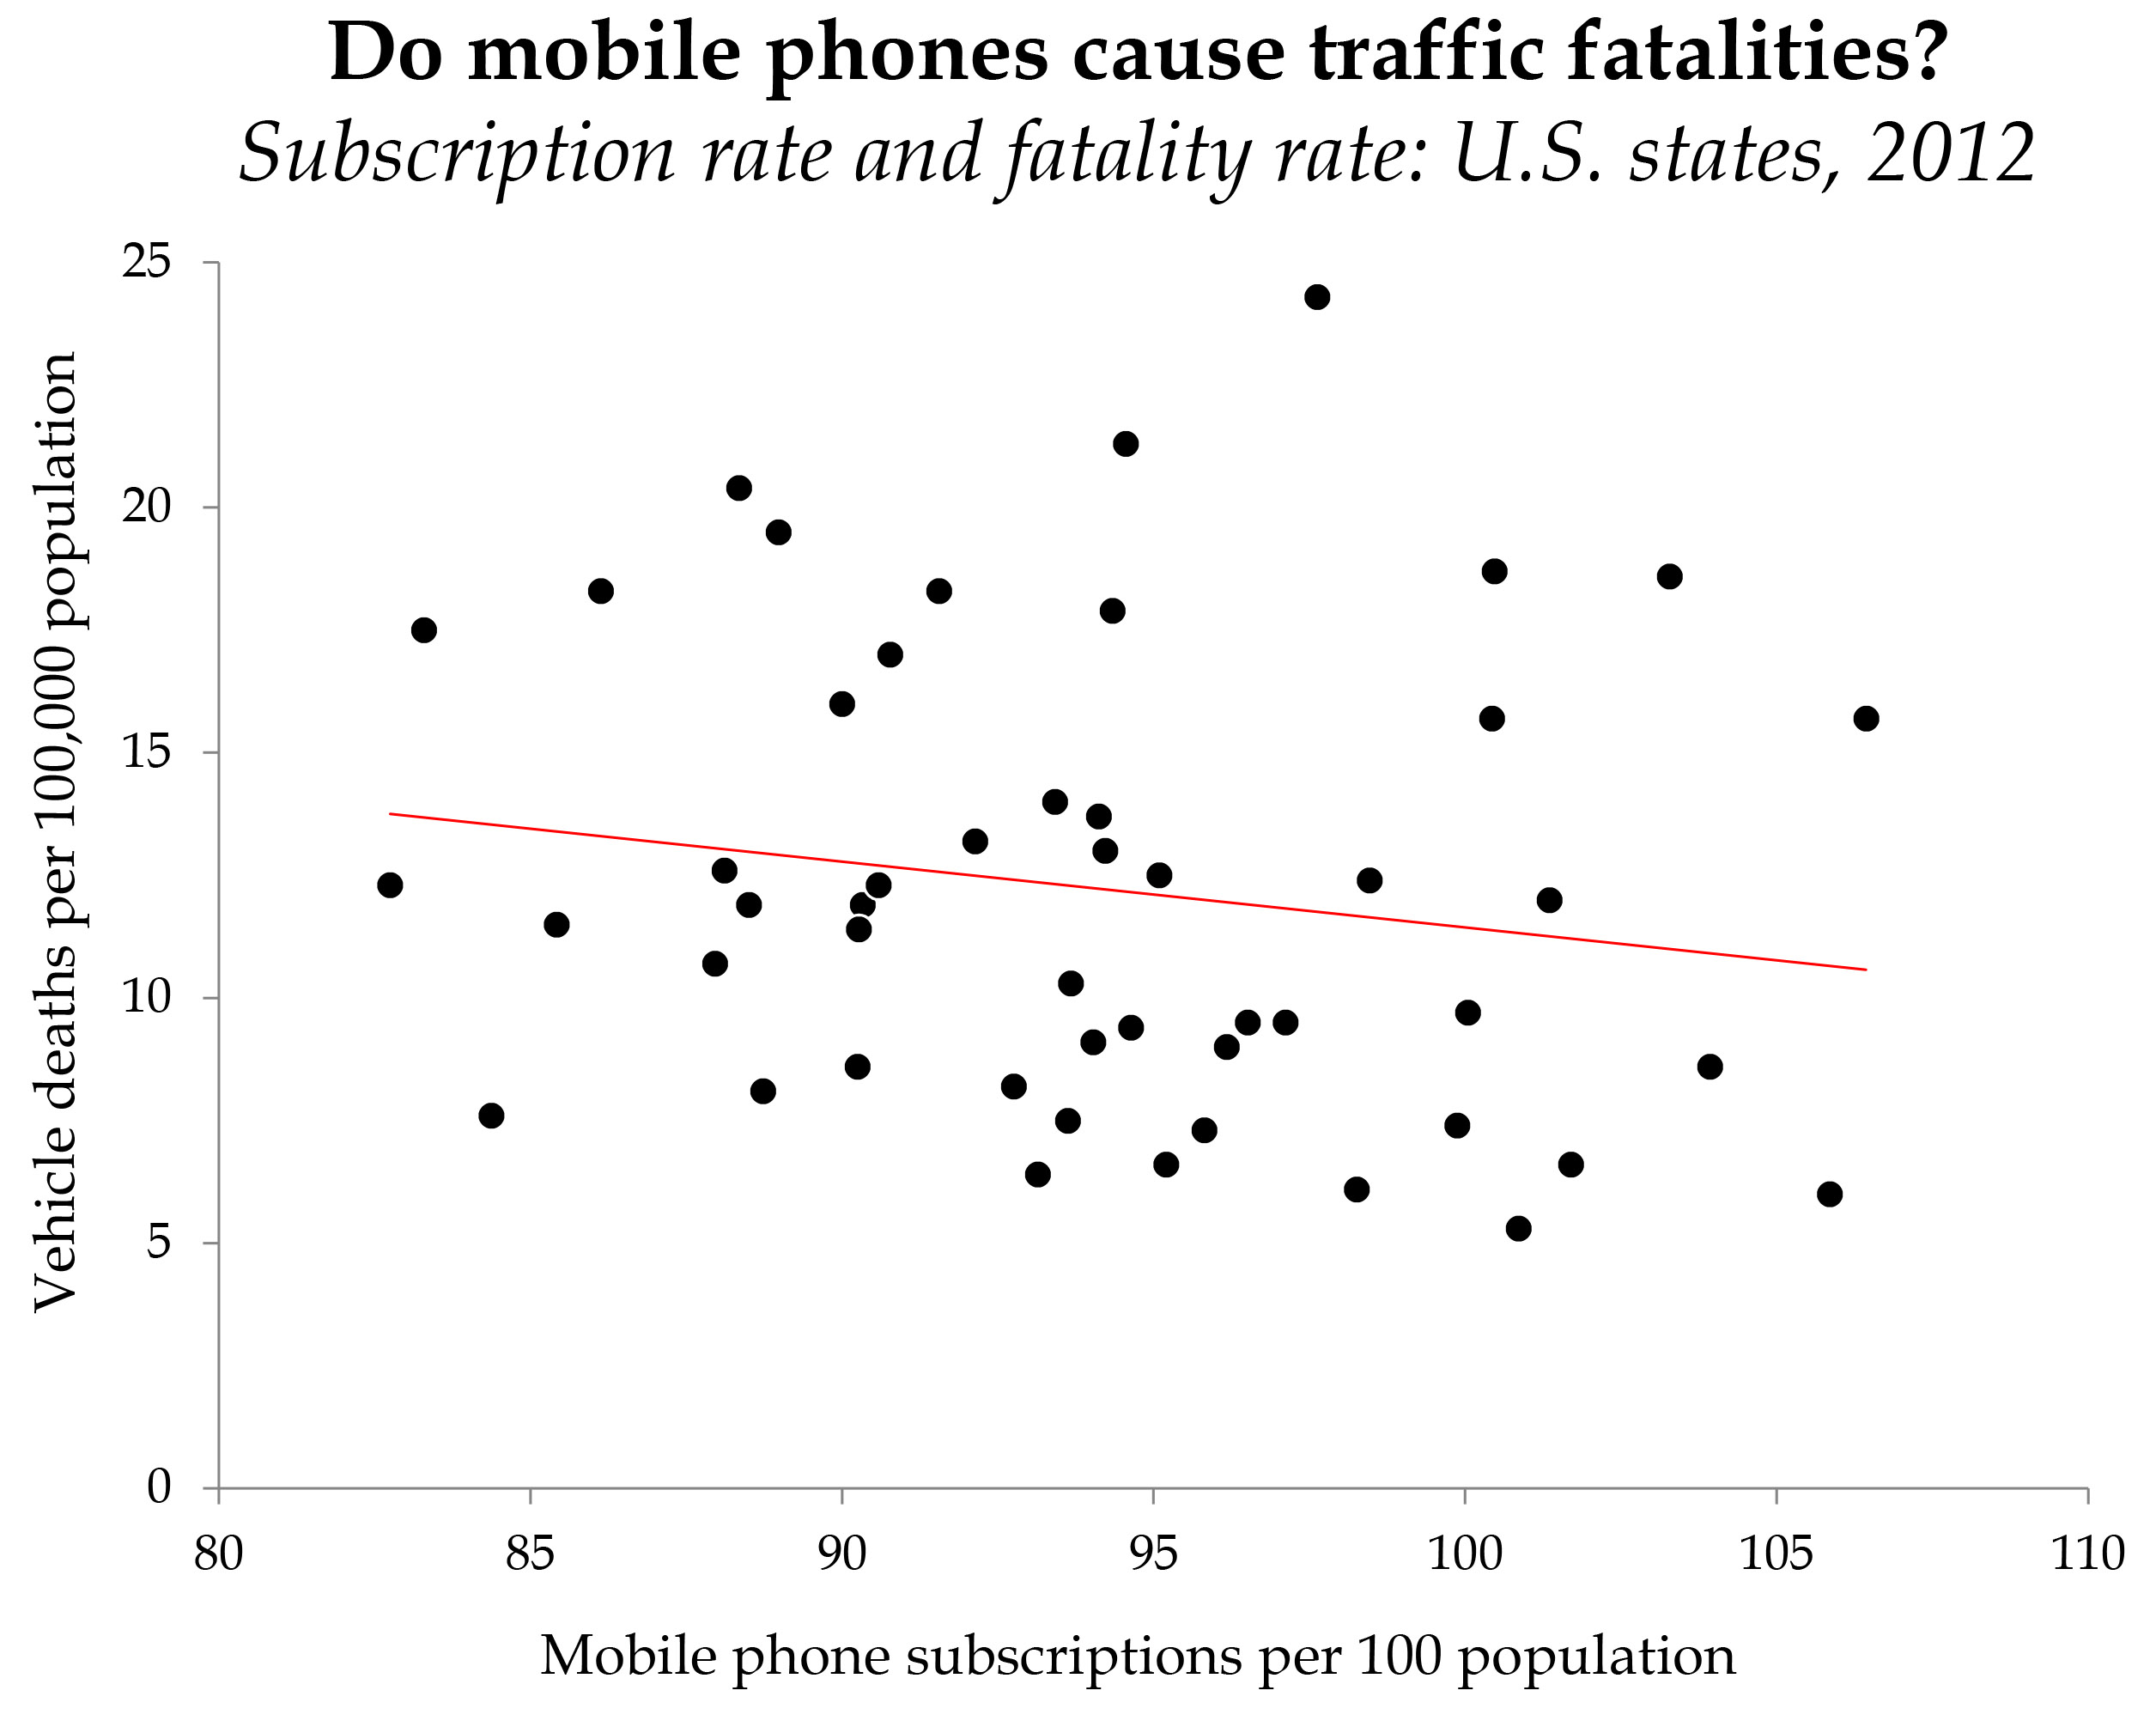
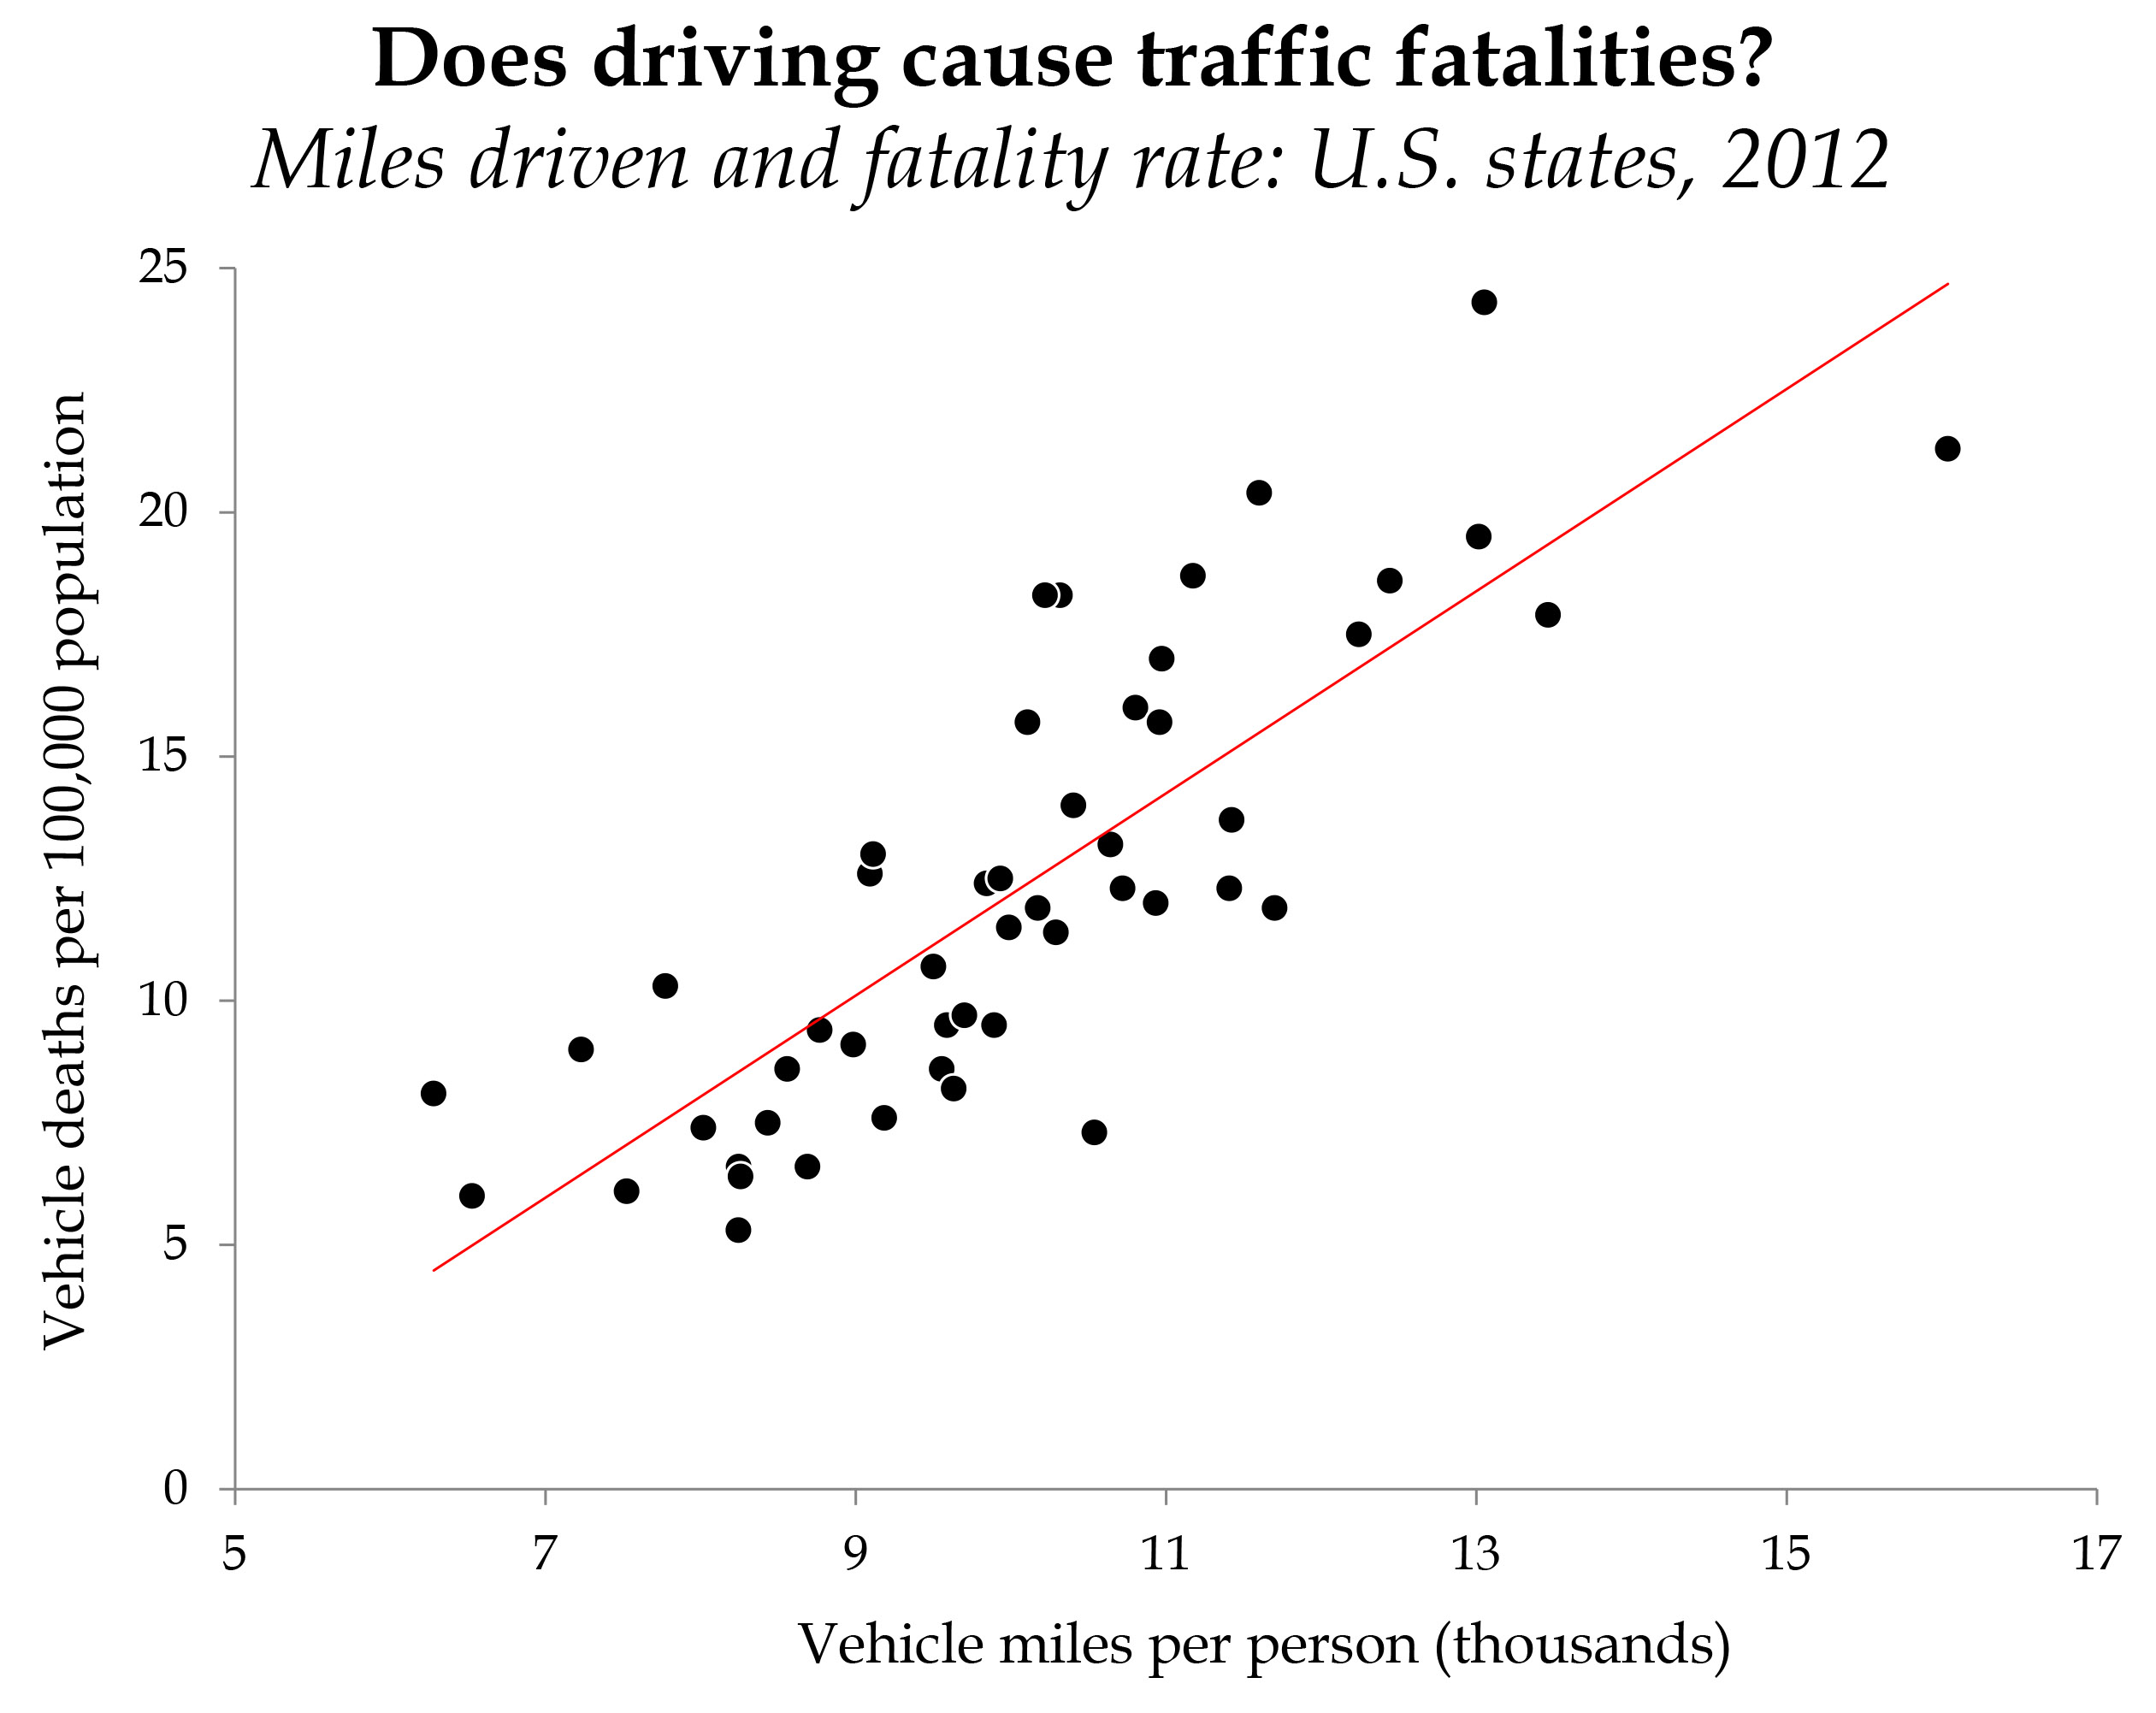
What does predict deaths? Driving. This isn’t a joke. Sometimes the obvious answer is obvious because it’s the answer:
If you’re interested, I also put both of these variables in a regression, along with age and sex composition of the states, and the percentage of employed people who drive to work. Only the miles and drive-to-work rates were correlated with vehicle deaths. Mobile phone subscriptions had no effect at all.
Also, pickups?
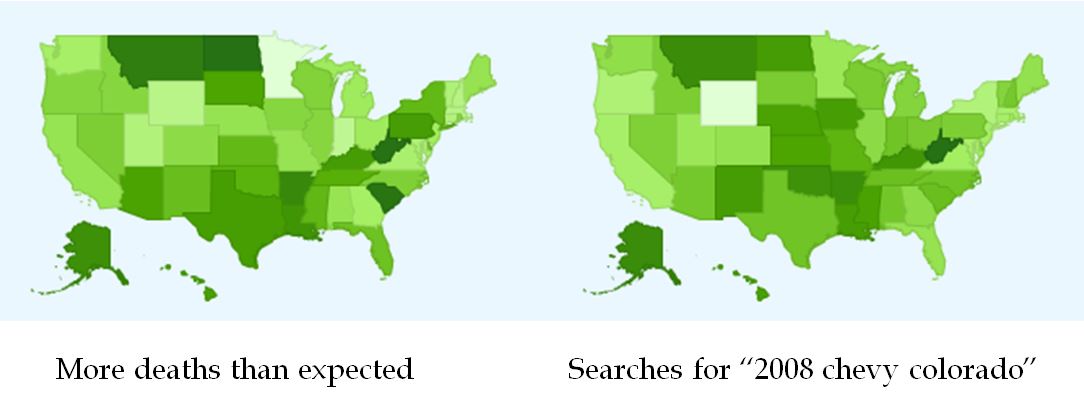
Failing to find a demographic predictor that accounts for any of the variation after that explained by miles driven, I tried one more thing. I calculated each state’s deviation from the line predicted by miles driven (for example Alaska, where they only drive 6.3 thousand miles per person, is predicted to have 4.5 deaths per 100,000 but they actually have 8.1, putting that state 3.6 points above the line). Taking those numbers and pouring them into the Google correlate tool, I asked what people in those states with higher-than-expected death rates are searching for. And the leading answer is large, American pickup trucks. Among the 100 searches most correlated with this variable, 10 were about Chevy, Dodge, or Ford pickup trucks, like “2008 chevy colorado” (r = .68), shown here:
I could think of several reasons why places where people are into pickup trucks have more than their predicted share of fatal accidents.
So, to sum up: texting while driving is dangerous and getting more common as driving is getting safer, but driving still kills thousands of Americans every year, making it the umbrella social problem under which texting may be one contributing factor.
I used this analogy before, and the parallel isn’t perfect, but the texting panic reminds me of the 1970s “Crying Indian” ad I used to see when I was watching Saturday morning cartoons. The ad famously pivoted from industrial pollution to littering in the climactic final seconds:
Conclusion: Keep your eye on the ball.
Philip N. Cohen is a professor of sociology at the University of Maryland, College Park, and writes the blog Family Inequality. You can follow him on Twitter or Facebook.
When sports stories wind up in the headlines and network news, something’s usually very wrong. The news biz, whether print or TV, usually keeps athletes confined in the sports section. So now we have the network anchors talking about Adrian Peterson leaving welts on the flesh of his son, age four, or showing us the video of Ray Rice coldcocking his fiancee in the elevator. Other NFL domestic violence stories, previously ignored (no superstar players, no video), are now mentioned since they fit the news theme.
These incidents all suggest that maybe football players are just violent people – men with a streak of violence in their dispositions. This personality trait that allows them to flourish on the field, but too often it gets them in trouble after they leave the stadium.
This is the kind of psychological “kinds of people” explanation that I ask students to avoid or at least question, and to question it with data. Conveniently, we have some data. USA Today has the entire NFL rap sheet, and it looks like a long one – more than 700 arrests since 2000. Nearly 100 arrests for assault, another 85 or so for domestic violence. And those are just the arrests. No doubt many battered wives or girlfriends and many bruised bodies in bars didn’t make it into these statistics. Are football players simply violent people – violent off the field as well as on?
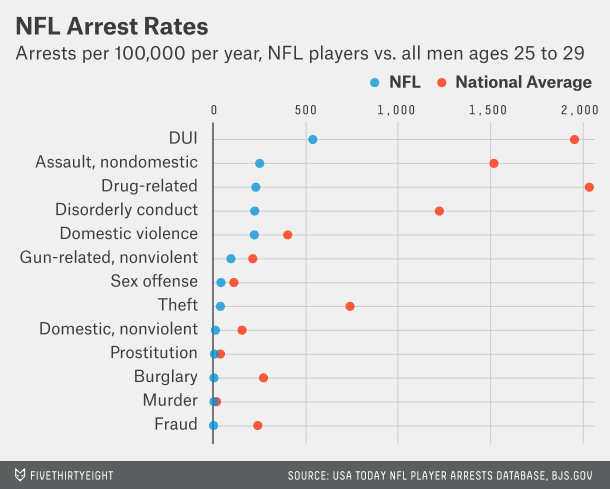
Well, no. The largest category of arrests is drunk driving – potentially very harmful, but not what most people would call violent. And besides, NFL players are arrested at a lower rate than are their uncleated counterparts – men in their late twenties.
This suggests that the violence we see in the stadiums on Sunday is situational (perhaps like the piety and moral rectitude we encounter elsewhere on Sunday). The violence resides not in the players but in the game. On every down, players must be willing to use violence against another person. Few off-the-field situations call for violence, so we shouldn’t be surprised that these same men have a relatively low rate of arrest (low relative to other young men).
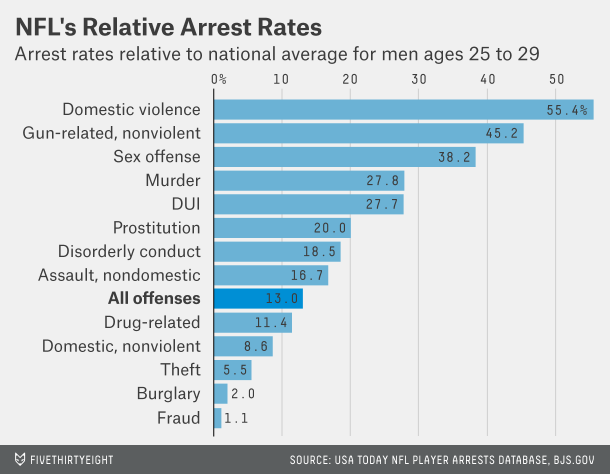
But let’s not discard the personal angle completely. If we look at arrests within the NFL, we see two things that suggest there might be something to this idea that violence, or at least a lack of restraint, might have an individual component as well. First, although NFL arrests are lower for all crimes, they are much, much lower for non-violent offenses like theft. But for domestic violence, the rate is closer that of non-footballers. The NFL rate for domestic violence is still substantially lower than the national average – 55 NFL arrests for every 100 among non-NFL men. But for theft, the ratio is one-tenth of that – 5.5 NFL arrests per 100 non-NFL. Also on the higher side are other offenses against a person (murder, sex offenses) and offenses that might indicate a careless attitude toward danger – DUI, guns.
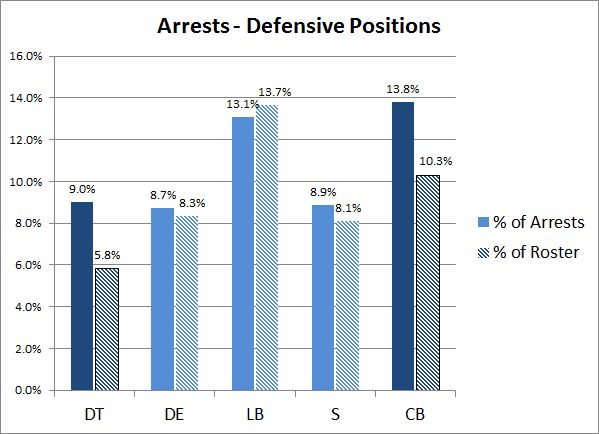
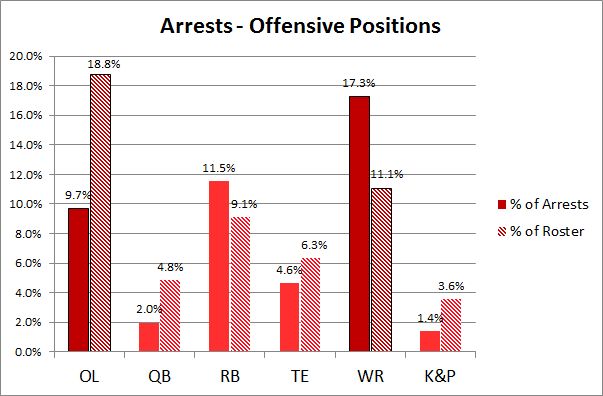
Second, some positions have a disproportionate number of offenders. The graphs below show the percent of all arrests accounted for by each position and also the percent the position represents of the total NFL roster. For example, cornerbacks make up about 10% of all players, but they accounted for about 14% of all arrests. (The difference is not huge, but it’s something; there would be a very slight overlap in the error bars if my version of Excel made it easy to include them.)
The positions disproportionately likely to be arrested are wide receivers and defensive tackles. Those most under-represented in arrests are the offensive linemen.
This fits with my own image of these positions. The wide-outs seem to have more than their share of free-spirits – players who care little for convention or rules. Some are just oddball amusing, like Chad Ochocinco formerly of the Bengals. Others are trouble and get traded from team to team despite their abilities, like Terrell Owens of the 49ers, Eagles, Cowboys, Bills, and Bengals.
As for the linemen, the arrest differential down in the trenches also might be expected. Back in the 1970s, a psychiatrist hired by the San Diego Chargers noted this difference on his first visit to the locker room. It wasn’t the players – the offensive and defensive lineman themselves looked about the same (huge, strong guys) – it was their lockers. They were a metaphor for on-the-field play. Defensive linemen charge, push, pull, slap – whatever they can do to knock over opponents, especially the one holding the ball. Their lockers were messy, clothes and equipment thrown about carelessly. Offensive lineman, by contrast, are more restricted. Even on a run play, their movements are carefully co-ordinated, almost choreographed. Watch a slo-mo of the offensive line on a sweep, and you’ll see legs moving in chorus-line unison. Correspondingly, their lockers were models of organization and restraint.
Maybe these same personal qualities prevail off the field as well. Those offensive lineman get arrested at a rate only half of what we would expect from their numbers in the NFL population. Arrests of defensive linemen and wide receivers are 50% more likely than their proportion on the rosters. That can’t be the entire explanation of course. Running counter to this “kinds of people” approach are the other hard-hitting defensive players – defensive ends and linebackers. According to the principle of violent people in violent positions, they should be over-represented in arrest figures just like the defensive tackles and cornerbacks. But they are not.
If this were a real article, a journal article, this final paragraph would be where the author calls for more data. But the trend in NFL arrests has been downward, and if fewer arrests means less data but also less domestic violence, that’s fine with me.
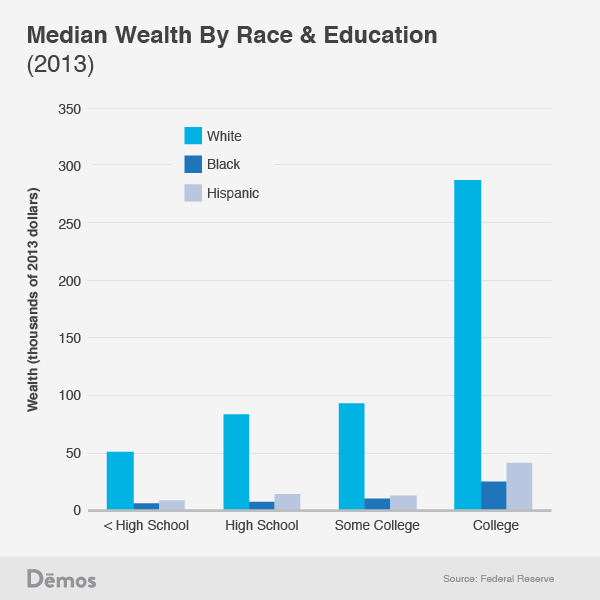
Here’s a doozy in the theme of the racial wealth gap: households headed by white people who dropped out of high school have greater assets than those headed by blacks and Latinos with college degrees.
At Demos, where Matt Bruenig posted this graph, he writes:
The median white family with an education level below high school has a net worth of $51.3k, while the median black and hispanic family with a college degree has a net worth of $25.9k and $41k respectively.
You’re better off being a white high school dropout than a black or Latino college grad. Ouch.
When I was in grad school studying sociology of agriculture, one thing we talked about was organic agriculture and the difference between “organic” and “sustainable.” Most consumers think of these words interchangeably. So, when many people think of an organic dairy farm they imagine something along the lines of these images, the top results for an image search of “organic dairy farm”:
So happy! So content! And, we assume, raised on a small family farm in a way that is humane and environmentally responsible. Those, are, after all, two of the things we expect when something is defined as “sustainable”: it is environmentally benign and humane. We also usually assume that workers would be treated decently as well.
But there is no reason that those elements considered essential to sustainability have to have much to do with organic agriculture. Depending on who is doing the defining, being “organic” can involve very little difference from conventional agriculture. Having an organic dairy mostly just requires that the cows not have antibiotics or homones used on them, eat organic feed, and have access to grass a certain number of days per year. In and of itself, organic certifications don’t guarantee long-term environmental sustainability or overall humane treatment of livestock.
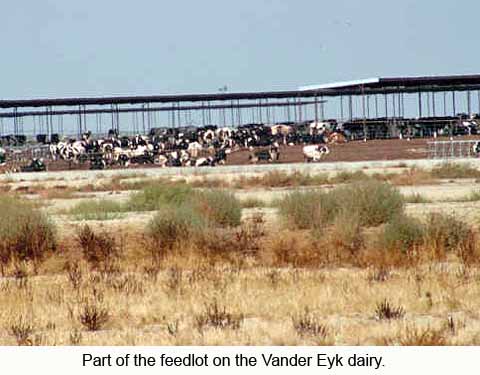
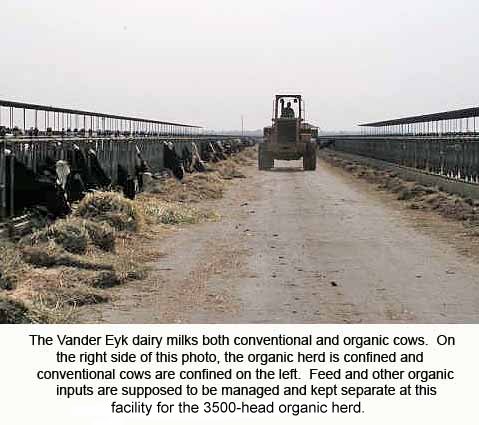
A great illustration of how little the modes of production on organic farms may differ from conventional agriculture is the Vander Eyk dairy. It is an operation in California with over 10,000 dairy cows. Here are some images (found here and here):
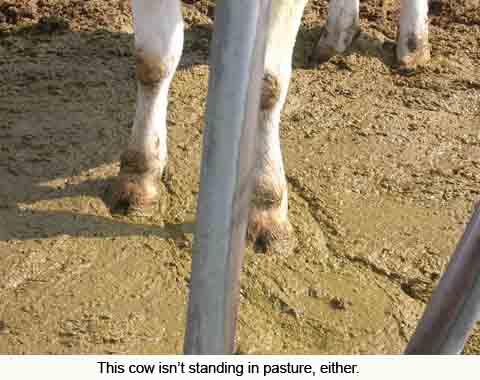
As the caption to the last image makes clear, the Vander Eyk dairy had two herds on the same property, but segregated from one another: the majority of the herd produced conventional milk, while 3,500 cows produced organic milk for sale under the Horizon brand:
In 2007 the Vander Eyk dairy lost its organic certification for violating the requirement that organic dairy cows spend a certain amount of time on pasture. They had cows on pasture, but they were non-milking heifers, not cows that were being milked at the time. What we see here is that the label “organic” doesn’t guarantee most of the things we associate with the idea of organic or sustainable agriculture (and in cases like Vander Eyk, may not even guarantee the things the label is supposed to cover).
This isn’t just in the dairy industry. As Julie Guthman explains in her book Agrarian Dreams: The Paradox of Organic Farming in California, many types of organic agriculture include things you might not expect. For instance, organic producers in California joined with other producers to oppose making the short-handled hoe illegal — the bane of agricultural workers everywhere (and most infamously associated with sharecropping in the South in the early 20th century) — because they want workers to do lots of close weeding to make up for not spraying crops with pesticides. So, though we often assume organic farmers would be labor-friendly, in that case they opposed a change that agricultural workers supported.
Many organic crops are grown on farms that are the equivalent of the Vander Eyk dairy; most of the land is in conventional production, but a certain number of acres are used to grow organic versions of the same thing. Often the producer, which may be an individual farmer or a corporation such as Dole, isn’t very committed to organics; if a pest infestation threatens to ruin a crop, they’ll just spray it and then sell it on the conventional market rather than lose it. They may then have to have the land re-certified as “in transition,” meaning it hasn’t been pesticide-free long enough to be declared completely organic, but many consumers don’t pay too much attention to such distinctions.
The Vander Eyk dairy — and lots more examples of large containment-facility operations selling to Horizon and other brands at the Cornucopia Institute’s photo gallery — are interesting examples of how terms like “organic,” “green,” and “eco-friendly” don’t necessarily mean that the item is produced according to any of the standards we often assume they imply.
Originally posted in 2009.
Gwen Sharp is an associate professor of sociology at Nevada State College. You can follow her on Twitter at @gwensharpnv.
About Sociological Images
Sociological Images encourages people to exercise and develop their sociological imaginations with discussions of compelling visuals that span the breadth of sociological inquiry. Read more…