Jeremiah sent in a fascinating post by Nicola at edible geography about how Prohibition, which outlawed liquor in the U.S. from 1920-1933, changed our culture in a number of ways that aren’t immediately apparent. Nicola draws heavily on historian David Okrent’s book Last Call.

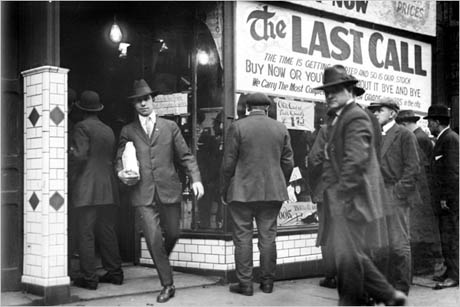
An image from Detroit the day before Prohibition went into effect in 1920:

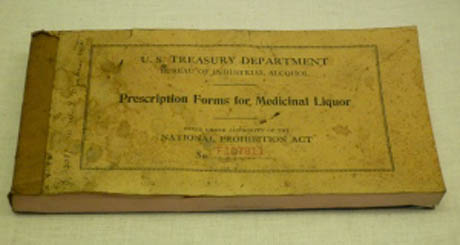
Although Prohibition made liquor illegal, there were a number of loopholes, including certain alcoholic “fruit juices” (which in effect meant wine and hard ciders were often allowed), medicinal uses of alcohol, and industrial alcohols. Nicola provides an image of a prescription booklet for medicinal alcohol:

These loopholes led to a dramatic rise in the popularity of wine in the U.S.: “American wine consumption increased from 70 million gallons in 1917 to 150 million gallons in 1925,” according to Nicola. That change affected the agriculture of California, in particular, where many acres of other crops were replaced with wine grapes. In another unexpected consequence, Okrent argues that the medicinal use loophole was a central factor in the success of drugstores such as Walgreen’s, since sales of alcohol for medical purposes were very profitable.

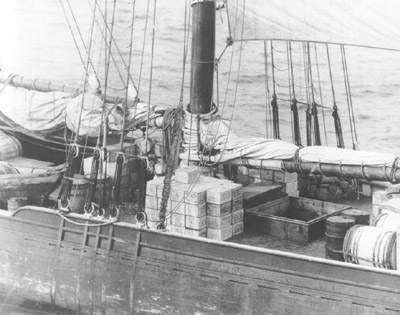
Prohibition also affected international maritime laws. At that time nations controlled the areas up to three miles off their shores. Along much of the U.S. coast, “Rum Rows” emerged, strings of generally foreign-owned ships anchored just outside the 3-mile jurisdiction limit, all full of liquor. They would openly advertise prices. This is an image of the Kirk and Sweeney loaded with illegal alcohol in 1924 (via):

The U.S. Coast Guard has a collection of images of its efforts to stop the illegal importation of liquor. This image shows one of the small rum runner boats that would sail from the shore to Rum Row to load up on alcohol, as it approaches a British-owned boat called the Katherine in 1923:

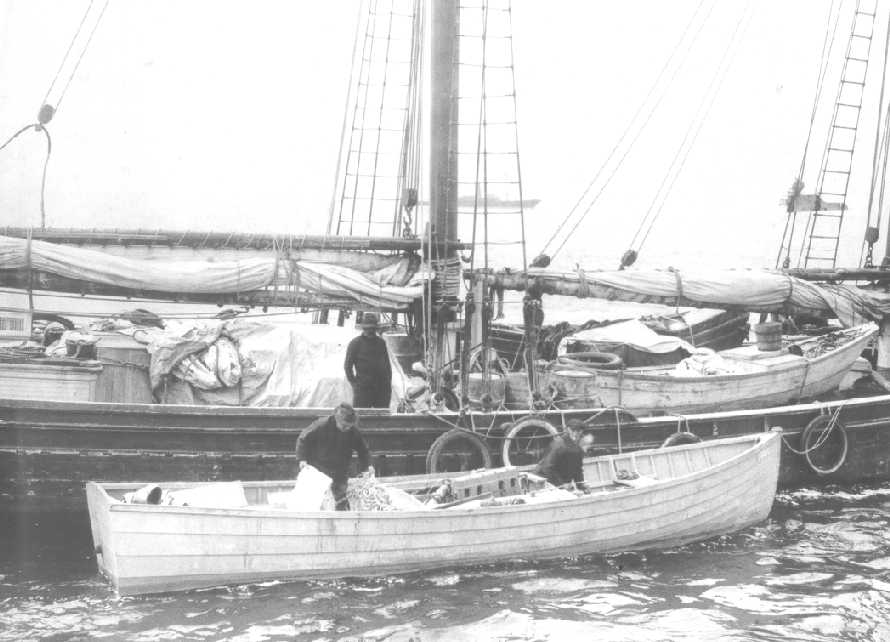
Nicola describes the scene:

…a floating ship-city, thousands of miles in length, bobbing up and down in place along the coast of America, and serviced by a fleet of much smaller, nimble rum runners that slipped to and from the mainland under cover of night.

The U.S. government began to push for an extension of the area of the ocean over which governments have jurisdiction, from 3 miles to 12, which would make it much more difficult, time-consuming, and dangerous to run liquor in from the larger ships. The U.S. eventually succeeded in pushing its national borders outward, expanding national sovereignty over oceans, another unexpected consequence of our anti-alcohol policies. Rum Row dutifully relocated farther offshore.

Apparently Prohibition also fueled the popularity of mixed drinks (the mixers helped mask the smell and often unpleasant taste of bootleg liquor) and dinner parties (since you couldn’t buy liquor openly at restaurants but were relatively safe serving it in your home).  According to a set of Life photos about Prohibition, sales of Coca Cola tripled, since soda served as both a substitute and mixer for alcohol:

From the Life photoessay:

“People don’t realize,” Okrent told LIFE.com, “how much drinking there was in this country before Prohibition. We were awash in booze. In 1830, for example, the per capita consumption of alcohol was three times what it is today — 90 bottles of booze per year per person over the age of 15. By 1933, drinking was around 70 percent of pre-Prohibition levels, and with some fluctuations has stayed well below pre-Prohibition levels ever since.

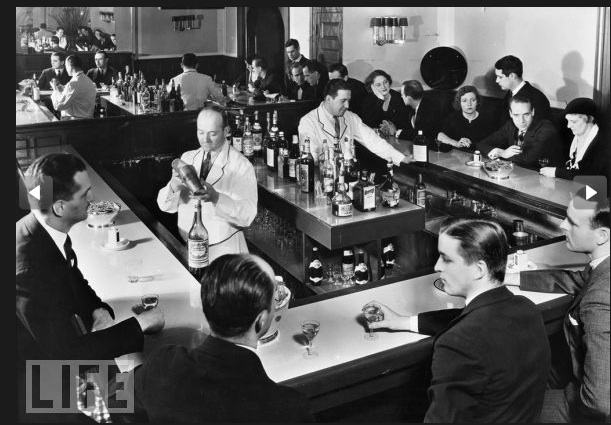
Okrent says that contrary to what we often see in movies, where speakeasies are built to be easily dismantled or disguised as legal businesses in case the cops raided, by the late 1920s, many speakeasies were set up as permanent structures that were clearly serving liquor, and customers felt fairly secure going to them:

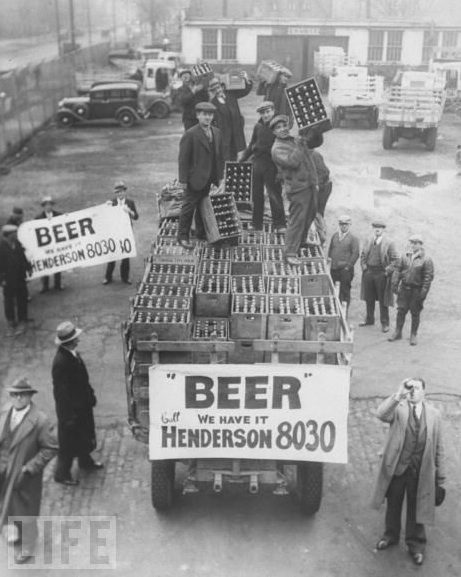
As soon as liquor became legal again, Americans enthusiastically returned to openly buying and selling it, though, as Okrent said, not at pre-Prohibition levels (photo from a different Life photoessay):

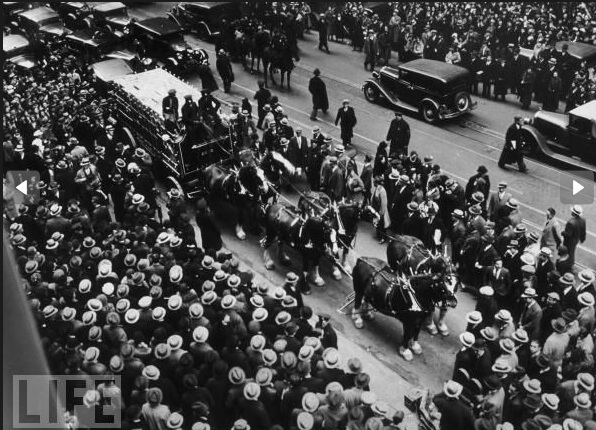
The Budweiser company decided to deliver beer to several high-profile locations by horse-drawn cart as a marketing stunt, giving us the iconic Budweiser Clydesdales. Here they are on their way to the Empire State Building:

And if you buy Okert’s argument, Prohibition even gave us NASCAR; he says it emerged in the South after Prohibition ended, when all the former runners of liquor needed new uses for their driving skills and fast cars now that they could no longer make a profit smuggling booze.

So there you have it: some of the unintended consequences of Prohibition, and example of the way public policy can have implications for areas of social life that seem far removed from the topic at hand.

Rick T. sent in a link to a post at Global Research about some new U.S. Census data about 2009 poverty rates. As is usually true, children suffer higher levels of poverty than other age groups:

Poverty is significantly higher for African Americans than for the U.S. population overall — notice the Y axis goes up to 45%, whereas above it ends at 30%:

From the post:

Being American gives you a one in seven chance of being poor. Being young raises this chance to one in four. Further, being black in America means a one in four chance of being poor. Being young and black raises your chance of being poor up to one in 2.5.

Not surprisingly, poverty is highly related to education level:

I went to the original Census report and grabbed some more images. This graph makes the over-representation of children among the poor even more obvious:

There’s tons of information in the report if you’re interested in the demographics of poverty in the current economic recession.

Dmitriy T.M. pointed out a post at Jezebel about an odd aspect of the Forbes “Power Women” list. Forbes has a general list of the “world’s most powerful people” (with 67 entrants, 3 of whom are women), as well as one specifically of the world’s 100 most powerful women. Here’s a sample bio from the general list, which is representative of what they all look like (I didn’t include the paragraph below each photo that explains why they’re powerful):

Now let’s check out a profile from the powerful women list:

Notice the difference? Almost all of the women’s profiles, but none of the profiles on the “general” power list, include their marital status (84 do, 16 don’t), and many list how many children they have. It’s fairly common to have a woman listed as married but without any comment about children; I could only find one (Ana Patricia Botin, #38) where she is listed as having children but her marital status isn’t provided, and none who were listed as single (as opposed to married, divorced, or widowed) but having children. (Also, Jenny Goudreau wrote an article about diversity on the list that’s rather interesting.)

To be fair, on some occasions Forbes has included marital/parental information on lists that are dominated by men. Why they didn’t decide to be consistent here, I don’t know. The inconsistency in this case leaves the unfortunate impression that Forbes is endorsing the tendency to see powerful men are individually interesting, while still judging powerful women by their family roles.

Julie M. came across a bow and arrow set for sale at a Wholesale Sports store in Nanaimo, British Columbia, Canada. The set is called the “Lil’ Sioux.” Notice any oddness about the description?

It’s the Lil’ Sioux…and also the “Sherwood Forester” set. What’s Sherwood Forest? Why, where Robin Hood and his Merry Men hung out. Because when you’re appropriating Native American cultures, you might as well conflate them with mythologized, and possibly entirely fictional, noble outlaws from another continent.

But given the popularity of “Native American” fashions these days, I guess it shows restraint that the kid isn’t wearing a feathered headdress.

Gwen Sharp is an associate professor of sociology at Nevada State College. You can follow her on Twitter at @gwensharpnv.

We haven’t had up any blatant phallic ad imagery in a while, so I thought I’d share with you this Skyy Vodka ad, sent in by Dmitriy T.M. (found at AdRants):

From the AdRants post:

Defending the ad, Skyy Marketing Director Maura McGinn…said, “It’s about the content of our product. We’re an adult product consumed mostly in the evening and in flirtatious situations.”

Of course, it doesn’t actually show the product ejaculating, so it’s pretty tame, really.

Flavia Dzodan, of Red Light Politics, sent in a link to the Global Media Monitoring Project’s new report, Who Makes the News? The document looks at the gender imbalance in news production, based on an analysis of 1,281 newspapers, TV, and radio stations in 108 countries on November 10, 2009.The results indicate that women are still under-represented as news subjects, and that stories about women often reinforce stereotypes (focusing on women in family roles, using women for “ordinary person” quotes rather than experts, emphasizing women in stories about criminal victimization, birth control, and so on but not economic policy or politics, etc.).

A note on the methodology:

The research covered 16,734 news items, 20769 news personnel (announcers, presenters and reporters), and 35,543 total news subjects, that is people interviewed in the news and those who the news is about.

Internet sources were analyzed separately.

Overall, the analysis shows that both local and international news show a world in which men are highly over-represented as subjects, though women are more likely to be represented as victims, to have their family status mentioned, or to be in newspaper photos:

Interestingly, those reporting the news are more gender balanced, indicating that having more women producing the news doesn’t lead to an automatic reduction in under-representation of women in the news:

The representation of women as news subjects differs widely by category of news, from 12% of subjects in stories about agriculture to 58% in stories about family relations or single parenting (and 69% in a category they called the “girl-child,” stories about cultural practices impinging on or harming specifically female children, as opposed to children in general):

I’ll put the rest after the jump since there are quite a few images.

Female news subjects generally hold stereotypically female occupations. Here is the % female in different occupations that were clearly identified in the analysis:

Female news subjects also serve different purposes:

And female subjects are more likely to have their family status mentioned than are male subjects:

Finally, the analysis found that news stories were much more likely to reinforce than challenge gender stereotypes, with less than 10% of stories in any of the major categories challenging them:

The percent reinforcing stereotypes varies greatly by region; however, the % challenging stereotypes is much more stable, with only Latin American media outlets standing out:

Stories that reinforce gender stereotypes seem to be somewhat less likely to have female reporters, while those that challenge them are more likely to have female reporters:

You can download the full report here.

Jezebel recently posted this Australian PSA about the dangers of fast food:

It made me think of this British PSA from 1967 that addressed childhood obesity. Our ideas of what you should be eating may have changed in the past 40 years, but the tendency to rely on individualistic explanations and to blame moms for not providing children better food, as though the food they choose for their kids exists outside of any larger social context, seems to have quite the shelf life.

Third Way, which describes itself as “the leading moderate think-tank of the progressive movement,” proposes that taxpayers should get a receipt showing where their taxes go. They point out,

For many Americans, the amount they pay in taxes is larger than any purchase they make during the year, but studies show they know almost nothing about where that money goes to. This contributes to ridiculous beliefs, like the view that 20% of government spending goes to foreign aid, for example.

They provide a sample receipt for a taxpayer making $34,140, the median income in 2008; the receipt doesn’t include everything, but major categories of interest or that taxpayers tend to be very unclear how much money is spent on:

Via Talking Points Memo.

It’s not a receipt, but you can calculate how much you pay in taxes to various programs based on your income here.