The extent of our labor market problems has been highlighted many times and in many ways.  Yet, with little being done to correct them, it is worth keeping the issue in the public eye.

What follows are three charts from the Economic Policy Institute.  This one highlights the ratio of unemployed persons to job openings.  Although the ratio has fallen since the “end” of the recession, it remains considerably higher than a decade ago.  It currently stands at 4 unemployed per job opening.

dec2011_jolts.png

This one breaks down the data by industry.  It reveals that there are problems across the board. 

unemployed_openings_by_industry.png

This final one shows that the job crisis is hitting everyone.  As the Economic Policy Institute explains: “Those with higher levels of education are leaving (or never entering) the workforce at the same rate as those with just a high school degree.” Only those with less than a high school diploma seem to be experiencing improved employment opportunities.

snapshot_labor_force_erosion_main.png

And the response of many political and business leaders to this dismal situation?  Primarily calls for austerity–or better said cuts in social spending.  Some economists have even developed a theory of austerity-led growth, arguing that slashing government spending will unleash private investment and job creation. 

We have been witnessing a test of this theory in Europe and not surprisingly it hasn’t produced positive results.  As the economist Kevin O’Rourke explains:  “One lesson that the world has learned since the financial crisis of 2008 is that a contractionary fiscal policy means what it says: contraction. Since 2010, a Europe-wide experiment has conclusively falsified the idea that fiscal contractions are expansionary.”

I am willing to bet that this outcome wasn’t a surprise to most workers.

L. Edmondson sent in a commercial for Littlewoods, a catalog-based company in the U.K. Like much advertising around this time of year, it reminds us that holidays are women’s work.  It is your mother who is responsible for buying gifts, but also for making holidays magical.  So you know who to blame if you’re left unsatisfied.

Lisa Wade, PhD is an Associate Professor at Tulane University. She is the author of American Hookup, a book about college sexual culture; a textbook about gender; and a forthcoming introductory text: Terrible Magnificent Sociology. You can follow her on Twitter and Instagram.

Katrin sent in an interesting example of an effort to (re)masculinize an occupation. Often when we see these efforts, they’re aimed at attracting men to traditionally-female jobs such as nursing by asserting that only “real men” would be able to handle the demands of the job, or emphasizing compatibility with masculinity.

In this case, the occupation that is being framed as highly masculine isn’t one dominated by women; it is, in fact, open only to men: the Catholic priesthood. The image, originally posted at NYPriest, is taken from Fishers of Men, a video released as part of the Archdiocese of New York’s Office of Vocations “The World Needs Heroes” campaign, meant to attract men to the priesthood:

Usually, a male-dominated occupation wouldn’t be in need of having its masculinized character stressed so openly. However, the child sex abuse scandals that have rocked the Catholic Church in the U.S. and elsewhere have damaged the image of the priesthood. Not only did many priests sexually abuse children, but many of the abused children where boys. Had the abuse involved primarily girls girls in late childhood or their teens, the public may very well have expressed revulsion and disgust, but we also have cultural narratives available, such as the idea of the sexually precocious Lolita who entices men against their better judgement, that are often used to at least partially justify or explain adult men’s sexual attraction to or abuse of even young girls (such as the judge who, in 1982, called a 5-year-old rape victim “unusually sexually promiscuous” and gave the adult man who assaulted her only 90 days in a work-release program).

But the fact that so many victims were boys meant those cultural narratives, which implicitly reinforce assumptions about adult masculine sexuality (men can’t quite control themselves; they’re easily led astray by female temptresses, even inappropriately young ones) didn’t apply. Abusing boys undermines the assumption of heterosexuality that is essential to hegemonic masculinity.

Given this social context, it’s not surprising that the NY Archdiocese felt the need to reassert the priesthood as masculine as one element of their image rehabilitation campaign.

In the video below, borrowed from Geoffrey Arnold’s blog on heightism, people on the street in New York are asked to evaluate the likely occupational and class status of two men: one short, one tall.  The results are striking (if also edited and non-random, but still):

See also Arnold’s guest posts introducing the concept of heightism as a gendered prejudice and discussing heightism (and other icky stuff) at Hooters.

Lisa Wade, PhD is an Associate Professor at Tulane University. She is the author of American Hookup, a book about college sexual culture; a textbook about gender; and a forthcoming introductory text: Terrible Magnificent Sociology. You can follow her on Twitter and Instagram.

Cross-posted at Family Inequality.

There’s an interesting example of how to interpret scientific results — and draw policy implications from them — from the world of birth practices and safety.

The subject of the debate is a major new study from the British Medical Journal. The study followed more than 60,000 women in England with uncomplicated pregnancies, excluding those who had planned caesarean sections and caesarean sections before the start of labor. They compared the number of bad outcomes — from death to broken clavicles – for women depending on where they had their births.

One comparison stands out in the results. From the abstract: “For nulliparous women [those having their first birth], the odds of the primary outcome [that is, any of the negative events] were higher for planned home births” than among those planned for delivery in obstetric units. That is, the home births had higher rates of negative events. The difference is large. Here’s a figure to illustrate:
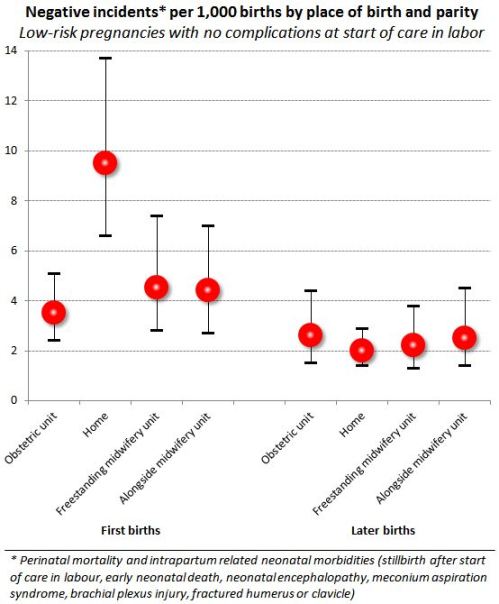
The error bars show 95% confidence intervals, so you can see the difference between home births and obstetric-unit births is statistically significant at that level. These are the raw comparisons, but the home-versus-obstetric comparison was unchanged when the analysts controlled for age, ethnicity, understanding of English, marital or partner status, body mass index, “deprivation score,” previous pregnancies, and weeks of gestation. Further, by restricting the comparison to uncomplicated pregnancies and excluded all but last-minute c-sections, it seems to be a very strong result.

But what to make of it?

In their conclusion, the authors write:

Our results support a policy of offering healthy nulliparous and multiparous women with low risk pregnancies a choice of birth setting. Adverse perinatal outcomes are uncommon in all settings, while interventions during labour and birth are much less common for births planned in non-obstetric unit settings. For nulliparous women, there is some evidence that planning birth at home is associated with a higher risk of an adverse perinatal outcome.

But in what way do the results “support a policy”? The “higher risks” they found for planned home births are still “uncommon,” by comparison, with those in poor countries, for example. But the home birth risk is 2.7-times greater.

The Skeptical OB, who is a reliable proponent of modern medical births, titled her post, “It’s official: homebirth increases the risk of death.” She added some tables from the supplemental material, showing the type of negative events and conditions that occurred. Her conclusion:

“In other words, any way you choose to look at it, no matter how carefully you slice and dice the data, there is simply no getting around the fact that homebirth increases the risk of perinatal death and brain damage.”

I guess the policy options might include include whether home births should be encouraged, more regulated, covered by public and/or private health insurance, banned, penalized or (further) stigmatized.

Home birth seems safer than letting children ride around unrestrained in the back of pickup trucks, which is legal in North Carolina – as long as they’re engaged in agricultural labor. On the other hand, we have helmet laws for kids on bicycles in many places. And if a child is injured in either situation, hopefully an ambulance would take them to the hospital even if the accident were preventable.

In other words, I don’t think policy questions can be resolved by a comparison of risks, however rigorous.

Earlier this month I read an essay that explained to me why I am not married. These reasons included:

  • I’m a bitch.
  • I’m shallow.
  • I’m a slut.
  • I’m a liar.
  • I’m selfish.
  • I don’t think I’m good enough.

I’m not kidding.

Coincidentally, the Pew Research Center released 2010 data showing that just 51% of all American adults were currently married. This is an all time low, down from 72% in 1960.

Comparing this data with the essay above is a nice illustration of the difference between “normative” and “normal.”  Normal is what is typical in a statistical sense; it is what actually holds.  Normative is what is believed to be good and right in an ideological sense; it is what it is believed does or should hold.

If you go by the essay, written by the thrice married and now single Tracy McMillan, marriage is an ideal state that we all should, or do, desire.  In her reality, if you aren’t married, it’s because you’re doing something wrong.  Marriage is normative.  In actual reality, though, the state of being married is not any more normal than the state of being unmarried.

Only if marriage is normative does the non-normality of marriage become something that needs explaining.  McMillan jumps in with hateful stereotypes, but social science has much better explanations.

  • Low-income women often do not take-for-granted (as many middle class people do) that they can sustain a marriage through tough times.  Accordingly, they wait much longer before marrying once they meet someone they like (as long as 10 years or more), so that they can be as sure as possible about the match.  In other words, they take marriage very seriously and are reticent to just jump right in.  They know they’re “good enough,” Tracy; in fact, they value themselves and their relationships enough to really put them to the test.  (Read Promises I Can Keep for more.)
  • Other women get divorced because men don’t do their fair share.  Unresolved conflicts over childcare and housework are one of the top reasons that couples dissolve.  Women struggle to keep up when they’re working a full time job and doing 2/3rds to 3/4ths of the childcare and housework.  They may not see the data, but they may intuit that single mothers do less housework than married ones (it’s true).  So they divorce their husbands.  They’re not “selfish,” they’re just trying to survive. (Read The Second Shift for more.)
  • Other people aren’t married because they’re in love with someone of the same sex.  They’re not “sluts,” they’re discriminated against.

And, just for the record:

  • I’m not married because I don’t want or need the state’s approval of my relationship and  I certainly don’t want it interfering if we decide to part.
  • I’m not married because the history of marriage is ugly and anti-woman; because I don’t like the common meanings of the words “wife” and “husband”; and because even today, and even among couples that call themselves feminist, gender inequality in relationships is known to increase when a couple moves from cohabitation to marriage (and I don’t think I’m so special that I’ll be the anomaly).
  • I’m not married because I’m opposed to the marriage industrial complex. It’s exploitative, stereotypical, and wasteful.
  • I’m not married because I value the fact that my partner and I decide to be together every day, even though we don’t have to jump through legal hoops to do otherwise.
  • I’m not married because I don’t want to support a discriminatory institution that has and continues to bless some relationships, but not others, out of bigotry.
  • I’m not married because I don’t believe in giving social and economic benefits to some kinds of relationships and not others.  I don’t believe that a state- or church-endorsed heterosexual union between two and only two people is superior to other kinds of relationships.

After reading some of the great comments, I’d like to add that I’m not married because of several points of privilege:

  • I’m not married because I live in a society that allows women to work, keep their paychecks, rent an apartment, and have a bank account.  (And, frankly, I think it’s kind of neat to be in the first generation of American women who can realistically choose not to marry. I like the idea of embracing that.)
  • I’m not married because both my partner and I are lucky enough to have  a stable, full-time job that offers benefits, so we don’t need to get married so that one of us can get the other health insurance or some other benefit.
  • I’m not married because we are both U.S. citizens and don’t have to marry in order to live together.

I could go on, but you get the idea.

The point is that when the normal and the normative don’t align it often leads to social conflict over the meaning of the gap.  Some people, like McMillan, may jump in to tongue-lash the deviants.  Others may revel in defending non-conformity.  In any case, it will be interesting to see how the conversation about marriage continues, especially if, as the trend suggests, married people become a minority in the near future.

Lisa Wade, PhD is an Associate Professor at Tulane University. She is the author of American Hookup, a book about college sexual culture; a textbook about gender; and a forthcoming introductory text: Terrible Magnificent Sociology. You can follow her on Twitter and Instagram.

Cross-posted at Family Inequality.

Let’s just stipulate that using a personal electronic device while driving increases the risk of an accident and should be avoided.

Let me just make sure I have the rest of the facts straight.

1.  The total number of traffic deaths is at its lowest level since 1949, even as the population, number of vehicles, and number of miles driven have all increased radically.

2.  The number of mobile phone subscribers has increased more than 1,000% since the early 1990s.

3.  “Distraction-affected” crashes accounted for less than 10% of traffic fatalities in 2010.

4.  Deaths attributed to drivers age 17 and younger have fallen by about half since 1990.

5.  The National Transportation Safety Board “is recommending that states prohibit all drivers from using cellphones, for talking or texting.”

Here’s a visual on some of the trends, in one figure:

Pay no attention to the man behind the curtain. Here are my previous posts on this.

————————

Sources: National Highway Traffic Safety Administration: 2009-2010 deathsdeaths trends;  Federal Communications Commission: phone trends; CTIA: 2009 phone subscriptions.


With the college football championship games coming up, Dmitriy T.M. thought it was a good time to highlight the NCAA’s database that provides detailed information on graduation rates of college athletes. For each school, you can select particular sports and years. I decided to look up graduation rates for 2010-2011 at the two schools I attended: University of Oklahoma (undergrad) and University of Wisconsin-Madison (grad school).

The database reports two numbers. The Federal Graduation Rate (FGR) reports numbers for individuals who were first-time college students when they enrolled at the institution (that is, no transfer students are included, and students who transfer count negatively in the rate for their initial school, the equivalent of a drop-out); the FGR indicates how many students graduated from their initial institution within 6 years. The Graduation Success Rate (GSR) takes into account transfer students; as long as they’re in good academic standing when they transfer, they aren’t counted against the initial school’s graduation rate.

So how are student athletes doing? According to the NCAA’s analysis, if we look at the  more restrictive FGR for students who began college in 2004, student athletes actually have higher graduation rates in general, especially for African Americans:

If we switch to looking at the GSR (which, again, drops transfers from the data for the initial school, rather than counting them as non-graduates), for students who began college in 2003 and 2004, overall graduation was pretty high (79 and 82 percent), but we see pretty wide disparities. White student athletes were significantly more likely to graduate than African Americans, and for both races, women were more likely to graduate than men:

Graduation rates also vary by sport. Here are the averages for male athletes who enrolled between 2000 and 2003; we see basketball and football at the lower end, while lacrosse graduated 88% of its players from that period (the two football #s refer to the different divisions):


Female athletes from the same cohorts; the only sport where they didn’t have (usually significantly) higher graduation rates than men playing the same sport is rifle:

Ten-year trends for men in Division I schools in the “big three” sports:

There’s lots more detailed info available if you click the “Trends in Graduation Success Rates and Federal Graduation Rates at NCAA Division I Institutions” link at the top of the website; you can also get reports for particular schools broken down by sport, race/ethnicity, sex, etc.