
The CDC recently issued a press release announcing that rates of reported cases for sexually transmitted diseases are setting record highs. The new report offers reports of rates going back to 1941 in a table, so I made a quick chart to see the pattern in context and compare the more common conditions over time (HIV wasn’t included in this particular report).
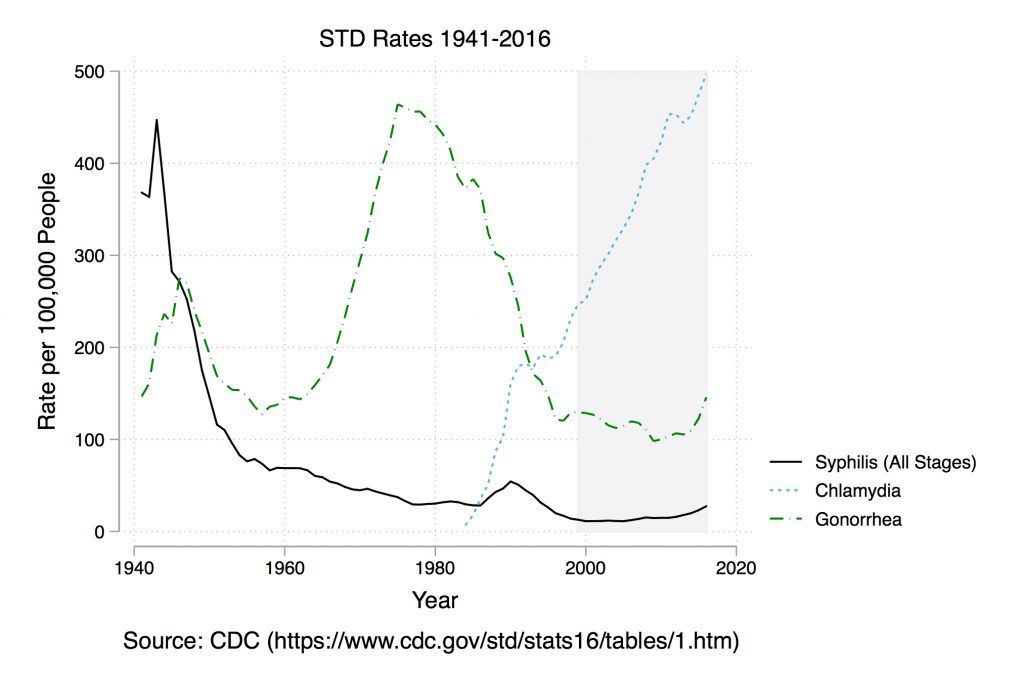
It is important to note that a big part of changes in disease rates is usually detection. Once you start looking for a condition, you’ll probably find more of it until enough diagnoses happen for treatment to bring the rates down. Up until 2000, the U.S. did pretty well in terms of declining rates for cases of gonorrhea and syphilis. Zoom in on the shaded area from 2000 to 2016, however, and you can see a pretty different story. These rates are up over the last 16 years, and chlamydia rates have been steadily increasing since the start of reporting in 1984.
STDs are fundamentally a social phenomenon, especially because they can spread through social networks. However, we have to be very careful not to jump to conclusions about the causes of these trends. It’s tempting to blame dating apps or hookup culture, for example, but early work at the state level only finds a mixed relationship between dating app use and STD rates and young people also have higher rates of sexual inactivity. Rate increases could even be due in part to detection now that more people have access to health coverage and care through the Affordable Care Act. Just don’t wait for peer review to finish before going to get tested!
Inspired by demographic facts you should know cold, “What’s Trending?” is a post series at Sociological Images featuring quick looks at what’s up, what’s down, and what sociologists have to say about it.
Evan Stewart is an assistant professor of sociology at University of Massachusetts Boston. You can follow his work at his website, or on BlueSky.
Comments 1
Stickman Boost — August 9, 2022
This is a good signal at that time, right?
I am from Stickman Boost where you play free online games.