Archive: 2012

In subarctic climates — ones in which the mean annual temperature is below 32° — the soil is frozen all year round.  It’s damn cold, but a nice base on which to build.  Until climate change starts melting the permafrost, of course.

These two now crooked buildings can be found in Dawson City, Canada.  Carleton University geographers have shown that the average temperatures have been increasing, melting the permafrost, and destabilizing the town.

This image reminds me that I am only barely beginning to understand climate change and its consequences.  How we will pay for climate change, and who will do so, is something I suspect I’ll learn much more about in the coming years.

Via Boing Boing.

Lisa Wade, PhD is an Associate Professor at Tulane University. She is the author of American Hookup, a book about college sexual culture; a textbook about gender; and a forthcoming introductory text: Terrible Magnificent Sociology. You can follow her on Twitter and Instagram.

Cross-posted at Family Inequality.

It is great to acknowledge and celebrate the increase in father involvement in parenting. But it is not helpful to exaggerate the trend and link it to the myth-making about looming female dominance. Yesterday’s feature in the Sunday New York Times does just that, and reminds me that I meant to offer a quick debunking of Hanna Rosin’s TED talk.

The story is headlined “Just Wait Till Your Mother Gets Home.” The picture shows a group of dads with their kids, as if representing what one calls “the new normal.” Careful inspection of the caption reveals it is a “daddy and me” music class, so we should not be surprised to see a lot of dads with their kids.

The article also makes use of a New Yorker cover, which captures a certain gestalt — it’s a funny exaggeration — but should not be confused with an empirical description of the gender distribution of parents and playgrounds:

Naturally, the story is in the Style section, so close reading of the empirical support is perhaps a fool’s errand. However, I could not help noticing that the only two statistics in the story were either misleading or simply inaccurate. In the category of misleading, was this:

In the last decade, though, the number of men who have left the work force entirely to raise children has more than doubled, to 176,000, according to recent United States census data. Expanding that to include men who maintain freelance or part-time jobs but serve as the primary caretaker of children under 15 while their wife works, the number is around 626,000, according to calculations the census bureau compiled for this article.

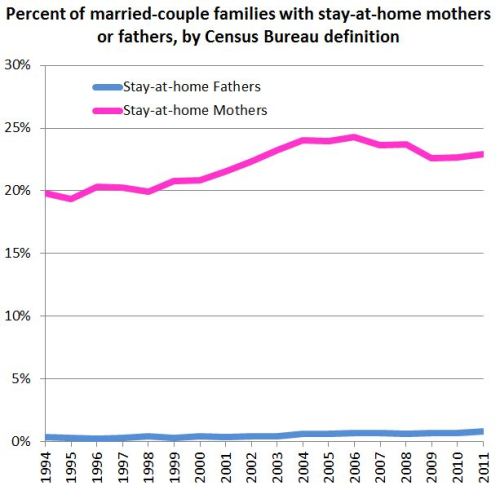
The Census Bureau has for years employed a very rigid definition of stay-at-home dads, which only counts those who are out of the labor force for an entire year for reasons of “taking care of home and family.” This may seem an overly strict definition and an undercount, but if you simply counted any man with no job but with children as a stay-at-home dad, you risk counting any father who lost a job as stay-at-home. (A former student of mine, Beth Latshaw, now at Appalachian State University, has explored this issue and published her results here in the journal Fathering.)

In any event, those look like big numbers, but one should always be wary of raw numbers in the news. In fact, when you look at the trend as published by the Census Bureau, you see that the proportion of married couple families in which the father meets the stay-at-home criteria has doubled: from 0.4% in 2000 to 0.8% today. The larger estimate which includes fathers working part-time comes out to 2.8% of married couple families with children under 15. The father who used the phrase “the new normal” in the story was presumably not speaking statistically.

(Source: My calculations from Census Bureau numbers [.xls file]. Includes only married-couple families with children under age 15.)


That’s the misleading number. The inaccurate number is here:

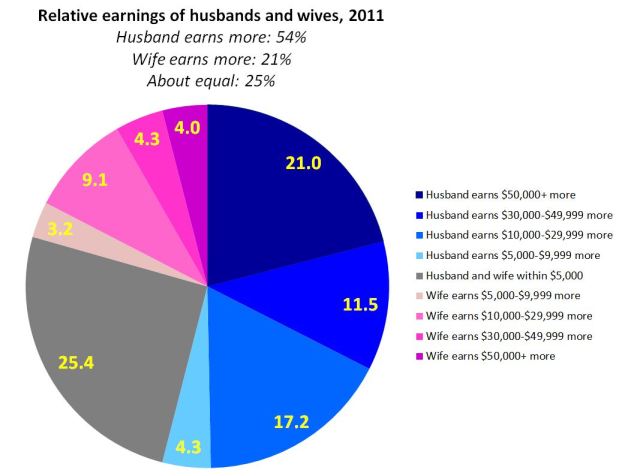
About 40 percent of women now make more than their husbands, the bureau’s statistics show, and that may be only the beginning of a seismic power shift, if new books like “The Richer Sex: How the New Majority of Female Breadwinners Is Transforming Sex, Love, And Family,” by Liza Mundy, and “The End of Men: And the Rise of Women,” by Hanna Rosin, are to be believed.

I guess in these troubled times for the newspaper business it might be acceptable to report X and Y statistic “if so-and-so is to be believed.” But it is a shame to do so when the public is paying the salary of people who have already debunked the numbers in question. Just the other day, I wrote about that very statistic: “Really? No. I don’t know why this keeps going around.” Using freely available tables (see the post), I calculated that a reasonable estimate of the higher-earning-wife share is 21%. In fact, on this point Liza Mundy and Hanna Rosin and are not to be believed.

(Source: My graph from Census Bureau numbers.)


TED: Misinformation Frequently Spread

There is a TED talk featuring Hanna Rosin from the end of 2010, and I finally got around to watching it. Without doing a formal calculation, I would say that “most” of the statistics she uses in this talk are either wrong or misinterpreted to exaggerate the looming approach of female dominance. For example, she says that the majority of “managers” are now women, but the image on the slide which flashes by briefly refers to “managers and professionals.” Professionals includes nurses and elementary school teachers. Among managers themselves, women do represent a growing share (although not a majority, and the growth has slowed considerably), but they remain heavily segregated as I have shown here.

Rosin further reports that “young women” are earning more than “young men.” This statistic, which has been going around for a few years now, in fact refers to single, child-free women under age 30 and living in metropolitan areas. That is an interesting statistic, but used in this way is simply a distortion. (See this post for a more thorough discussion, with links.)

Rosin also claims that “70% of fertility clinic patients” prefer to have a female birth. In her own article in the Atlantic, Rosin reports a similar number for one (expensive, rare) method of sex selection only (with no source offered) — but of course the vast majority of fertility clinic patients are not using sex selection techniques. In fact, in her own article she writes, “Polling data on American sex preference is sparse, and does not show a clear preference for girls.”

Finally, I don’t think I need to offer statistics to address such claims as women are “taking control of everything”and “starting to dominate” among “doctors, lawyers, bankers, accountants.” These are just made up. Congress is 17% female.

Philip N. Cohen is a professor of sociology at the University of Maryland, College Park, and writes the blog Family Inequality. You can follow him on Twitter or Facebook.

Cross-posted at Neuroskeptic.

“Personality differences” between people from different countries may just be a reflection of cultural differences in the use of “extreme” language to describe people.

That’s according to a very important paper just out from an international team led by Estonia’s René Mõttus.

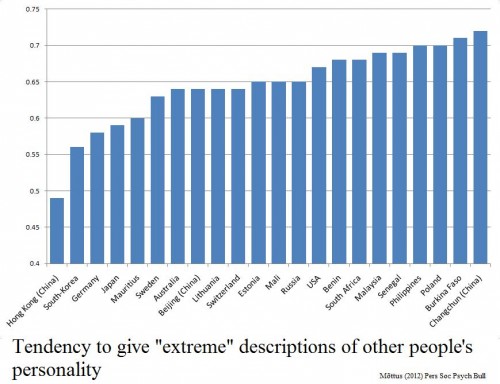
There’s a write up of the study here. In a nutshell, they took 3,000 people from 22 places and asked them to rate the personality of 30 fictional people based on brief descriptions (which were the same, but translated into the local language). Ratings were on a 1 to 5 scale.

It turned out that some populations handed out more of the extreme 1 or 5 responses. Hong Kong, South Korea and Germany tended to give middle of the road 2, 3 and 4 ratings, while Poland, Burkina Faso and people from Changchun in China were much more fond of 1s and 5s.

The characters they were rating were the same in all cases, remember.

Crucially, when the participants rated themselves on the same personality traits, they tended to follow the same pattern. Koreans rated themselves to have more moderate personality traits, compared to Burkinabés who described themselves in stronger tones.

Whether this is a cultural difference or a linguistic one is perhaps debatable; it might be a sign that it is not easy to translate English-language personality words into certain languages without changing how ‘strong’ they sound. However, either way, it’s a serious problem for psychologists interested in cross-cultural studies.

I’ve long suspected that something like this might lie behind the very large differences in reported rates of mental illness across countries. Studies have found that about 3 times as many people in the USA report symptoms of mental illness compared to people in Spain, yet the suicide rate is almost the same, which is odd because mental illness is strongly associated with suicide.

One explanation would be that some cultures are more likely to report ‘higher than normal’ levels of distress, anxiety — a bit like how some make more extreme judgements of personality.

So it would be very interesting to check this by comparing the results of this paper to the international mental illness studies. Unfortunately, the countries sampled don’t overlap enough to do this yet (as far as I can see).

Source: Mõttus R, et al (2012). The Effect of Response Style on Self-Reported Conscientiousness Across 20 Countries. Personality and Social Psychology Bulletin PMID: 22745332

————————

Neuroskeptic blogs anonymously here.  You can also follow him on Twitter.

Cross-posted at Reports from the Economic Front.

It’s election season and Republicans and Democrats are working hard to demonstrate that they support dramatically different policies for rejuvenating the economy.

While the Democratic Party’s call for more government spending makes far more sense than the Republican Party’s call for cuts in government spending (see below), the resulting back and forth hides the far more serious reality that our existing economic system no longer appears capable of supporting meaningful social progress for the great majority of Americans.

The chart below helps to highlight our economy’s worsening stagnation tendencies.  Each point shows the 10 year annual average rate of growth and the chart reveals a decade long growth trend that is moving sharply downward.

As David Leonhardt explains:

The economy’s recent struggles arguably began in late 2001, when a relatively mild recession ended and a new expansion began. The problem with this new recovery was that it wasn’t especially strong. From the fourth quarter of 2001 through the fourth quarter of 2007 (when the financial crisis began), the economy grew at an average annual rate of only 2.7 percent. By comparison, the average annual growth rate of both the 1990s and 1980s expansions exceeded 3.5 percent.

This mediocre expansion was followed by the severe recession and weak recovery brought on by the financial crisis. The combined result is that, in recent years, the economy has posted its slowest 10-year average growth rates since the Commerce Department began keeping statistics in 1947.

In fact, the economic growth figures for the period 1995 to 2007 were artificially propped up by a series of bubbles, first stock and then housing.  Once those bubbles popped, average growth rates began steadily falling.

The weakness (and unbalanced nature) of our current weak recovery is well captured in the following chart from Catherine Rampell, which compares the percent change in various indicators in the current recovery (which began in June 2009) with previous post-war recoveries.  The first point to stress is that the current recovery lags the average in all indicators but one: corporate profits.  The second is that government spending has actually been falling during the current recovery, no doubt one reason that the percent increase in so many indictors remains below the average in previous recoveries; the public sector is actually smaller today than it was three years ago.

The relative strength in the performance of corporate profits helps to explain why the two established political parties feel no real pressure to focus on our long term economic problems; corporations just don’t find the current situation problematic despite the economy’s weak overall economic performance.

Even more telling of the growing class divide is the explosion in income inequality over the last thirty years, which is illustrated in the following chart.

In other words, while corporations have succeeded in raising profits at the expense of wages, those in the top income brackets have been even more successful in raising their income at the expense of almost everyone else.  Notice, for example, that median household income in 2010 is roughly where it was in the late 1980s while the median income of the top households racked up impressive gains. Thus, the very wealthy have every reason to do what they are currently doing, which is using their wealth to ensure that candidates restrict their economic proposals to reforms that will do little to change the existing system.

The takeaway: without a mass movement demanding change, election debates are unlikely to seriously address our steady national economic decline.

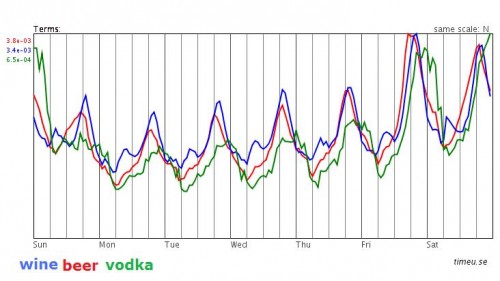
At the journal Epidemiology, John Cunningham published a proof-of-concept article aimed to show that Twitter is a useful and viable method of data collection.

His data captured the incidences of the words “wine,” “beer,” and “vodka” over the course of a week.  The figure shows that people are tweeting about these spirits more-or-less in unison, that they tend to do so increasingly towards the end of each day, and that wine and beer are weekday favorites, but vodka comes out ahead on the weekends, especially as the night wears on:

So, I thought that was kinda neat!  Now we know something about when and what people are (tweeting about) drinking and also that Twitter is good for something other than sending people messages that everyone else can see, but no one else can understand.

*Via Neuroskeptic, from whom I borrowed this great title.

Lisa Wade, PhD is an Associate Professor at Tulane University. She is the author of American Hookup, a book about college sexual culture; a textbook about gender; and a forthcoming introductory text: Terrible Magnificent Sociology. You can follow her on Twitter and Instagram.

Elizabeth sent in a link to a long and judicious New York Times article about biologically-male, gender-variant children, written by Ruth Padawer.  It’s well done, laying out the struggles even liberal-minded parents go through, including the mixed messages they get from “experts.”  It also briefly addresses the hormonal and genetic research, but acknowledges that the measures of femininity and masculinity used in these studies — and in daily life — are socially constructed.  That is, what is considered masculine or feminine is different across cultures and changes over time.

The picture of three boys at a camp for gender-variant children, waiting for their turn in a fashion show, was particularly interesting (photo by Lindsay Morris). I was struck by not just the emphasis on the dress/skirt, but the nail polish, jewelry, and high heels (on at least two of the children).  Their poses are also striking, for their portrayal of not just femininity, but sexualized femininity. It’s hard to say, but these boys look pretty young to me, and yet their (or their camp counselors?) idea of what it means to be a girl seems very specific to an adult hyperfemininity.  (After all, even most biological girls don’t dress/act this way most of the time and lots of girls explicitly reject femininity; Padawer comments that 77% of women in Generation X say they were tomboys as kids.)

In contrast, girls, when they enact a tomboy role — and now I’m off into speculation-land — don’t seem to go so far into the weeds.  We don’t see girls dressing up like lumberjacks or business men in suits and ties.  They don’t do tomman, they do tomboy.  There’s something more woman about how some of these boys perform femininity.

Some research on tomboys shows that girls who adopt it are sometimes, in part, trying to put off the sexual attention that comes with growing up.  So perhaps tomboyism is a way of rejecting one’s maturing body.  In contrast, perhaps femininity appeals to some boys because we adultify and sexualize young girls; it’s a form of grown up play as well as gender deviance?

Who knows.  The truth is — and the article does a good job of communicating this — we have no idea what’s going on here.

Lisa Wade, PhD is an Associate Professor at Tulane University. She is the author of American Hookup, a book about college sexual culture; a textbook about gender; and a forthcoming introductory text: Terrible Magnificent Sociology. You can follow her on Twitter and Instagram.
Cross-posted at Corporate Governance.

Sociologists Richard Zweigenhaft and G. William Domhoff began studying ascendance to the top corporate office 20 years ago and, while the population of CEOs is far from diverse, they report that they have been surprised to see as many women and minorities as they have.  Today there are 80 white women, African Americans, Latinos, and Asian Americans at the head of Fortune 500 companies.

In a discussion about their book, The New CEOs, at The Society Pages, they ask whether the rise of non-white/non-male CEOs is really a disruption in the distribution of power.  Despite protestations to the contrary — “all CEOs, it seems, worked their way up from the bottom,” they say with tongue in cheek — almost all come from wealthy backgrounds.  The rising diversity, in other words, doesn’t include class diversity.

With one exception: African Americans.  Most African American CEOs, they show, did not grow up in wealthy families.  “Many,” they write, “grew up with parents who were factory workers, postmen, custodians, day-care workers, or house cleaners.”  They refrain from speculating as to why they see this difference.

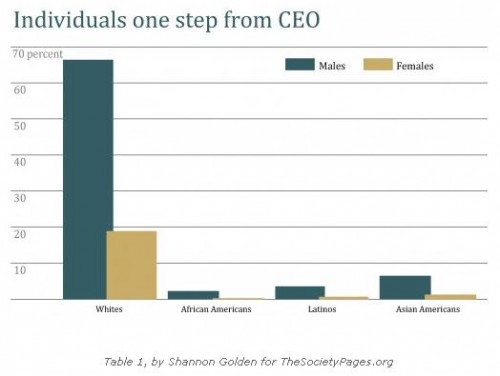
So, what’s next?  Zweigenhaft and Domhoff make some guesses as to the near future. The people positioned to be our next Fortune 500 CEOs will have graduated from college, got an MBA or law degree, will be currently earning more than $250,000 a year, and now hold a senior executive position.  Given these parameters, they conclude that:

…about two-thirds of those a step from the CEO office were white men, about 19% were white women, slightly fewer than 3% were African Americans, about 4% were Latinos, and about 8% were Asian Americans.

As the graph shows, compared to minority men, white women are far more likely to be rising into CEO positions in the near future.  Women of color, as they say, “almost disappear” in the data.  They explain that this likely has to do with their double minority status.  When hiring and promoting, people tend to look for ways of connecting with the potential employee.  A white man (usually doing the hiring) will see at least one thing in common with a white woman or a man of color.   As an example, they cite a study of executives with MBAs from Harvard:

…female Jewish executives all agreed that being female was more of an impediment to their careers than being a Jew, but many quickly emphasized that being Jewish, or different in any other way, was not irrelevant. As one put it, “It’s the whole package. I heard secondhand from someone as to how I would be perceived as a pushy, Jewish broad who went and got an MBA. Both elements, being Jewish and being a woman, together with having the MBA, were combined to create a stereotype I had to work against from the first day.” Another woman explained, “It’s part of the question of whether you fit the mold. Are you like me or not? If too much doesn’t fit, it impacts you negatively.”

These dynamics affect your entire career trajectory, of course, but Zweigenhaft and Domhoff believe they become even more intense as people approach the top office.  They conclude:

Culture (in the form of cultural capital), education, and class are all still in play. While gender and color remain the best predictors of who will make it into the upper echelons of the corporate world, beyond that, it’s intersectionality [of different identities together] wherever we look.

Lisa Wade, PhD is an Associate Professor at Tulane University. She is the author of American Hookup, a book about college sexual culture; a textbook about gender; and a forthcoming introductory text: Terrible Magnificent Sociology. You can follow her on Twitter and Instagram.
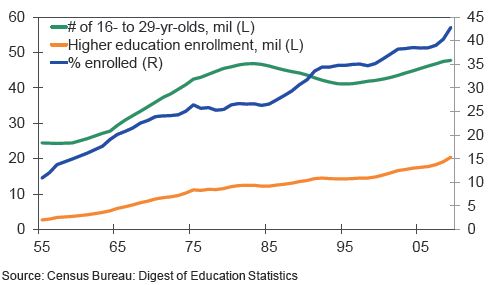
Earlier this summer, Lisa posted about total student loan debt in the U.S., which has increased overall as more people go to college. “Student Lending’s Failing Grade,” a report from Moody’s Analytics  provides more information about student loan debt. Demand for student loans continues to increase as the number of high school graduates who go on to college rises. Over 40% now attend (blue line; the right axis shows percents):

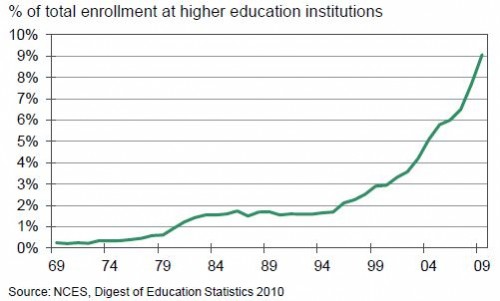
Enrollment at for-profit institutions such as University of Phoenix is still a small minority of all those going to college, but it’s growing rapidly:

This is significant for student loan debt because students at for-profit (or proprietary) institutions have much higher default rates than students at private or public colleges:

However, the report points out that default and delinquency rates on student loans are quite low compared to other forms of debt. This is partially due to the consequences of defaulting, but also because it’s easier to defer student loan repayment and thus avoid being labeled as “defaulting” than it is for most other loans.

Overall, the report argues that projections of future student loan debt are worrisome. Loans taken out more recently have higher default rates than in the past, and students may have unrealistic expectations of how much they will make after graduation, and so overestimate how much they’ll be able to pay in student loan debt each month. From my experience watching students, I would add that it’s not even that they overestimate how much they’ll be able to afford; many don’t have a clear sense of how much their monthly payment will be, especially since they take out loans on a semester-by-semester basis and may not really think about the cumulative debt they’re taking on. Many are then shocked to discover that their monthly bill isn’t the insignificant sum they’d assumed it would be.