
Henry H. sent in a link to an interactive map at the Guardian based on the recently leaked collection of over 92,000 records about the war in Afghanistan. The map shows the location of incidents in the reports broken down by category: accident, Afghan friendly fire, Coalition friendly fire, civilian casualties, demonstration/unrest, and other:
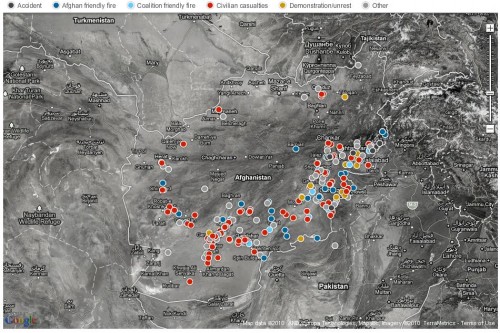
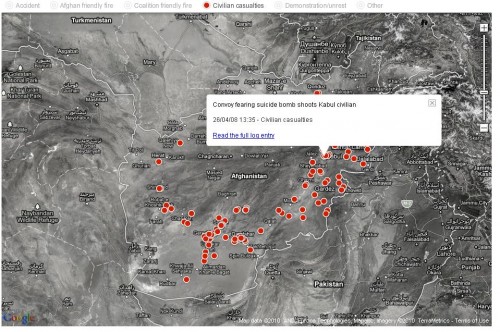
You can hide any of the categories you want to get a better picture of only some of them, and if you roll over a dot it will give you a brief summary with a link to the full report about it. Here’s the map with everything hidden except civilian casualties and the summary of one incident:
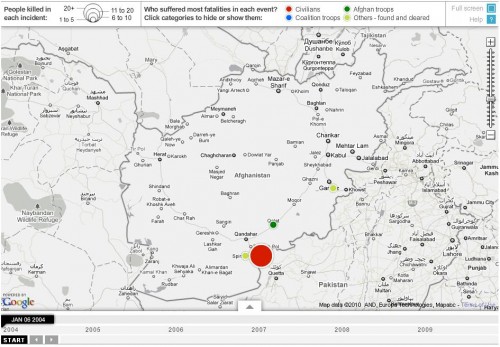
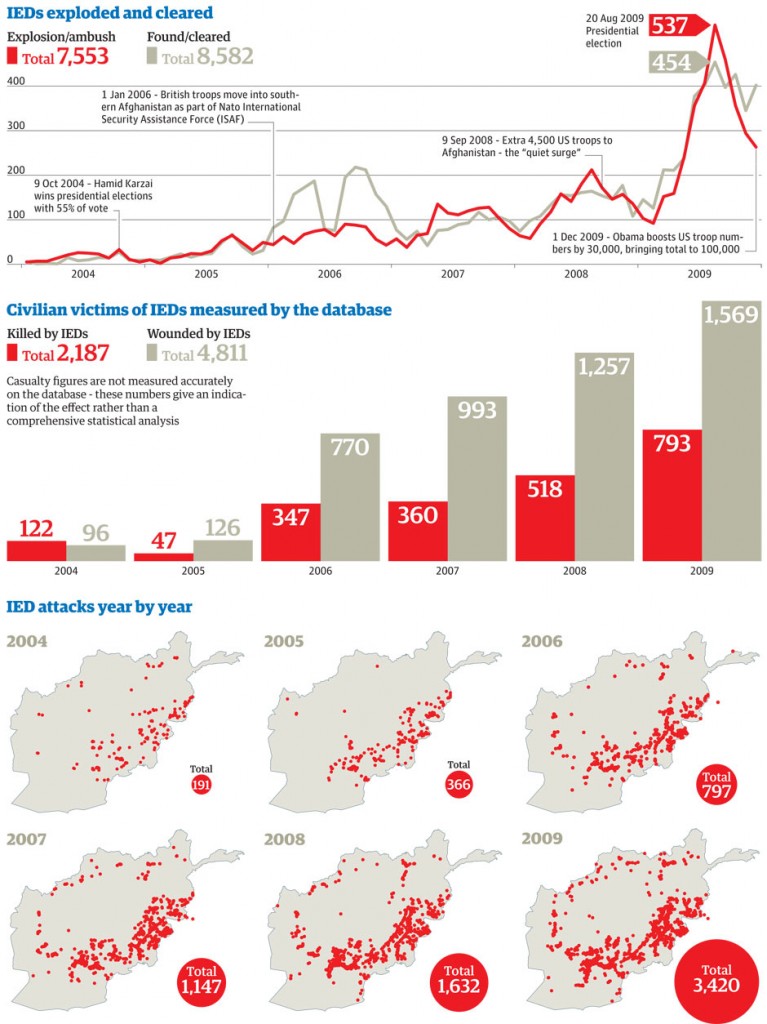
You can also see the locations of all IED attacks that occurred on any day between January 1st, 2004 and January 1st, 2010. The size indicates the number of people killed and the color tells you the category of most of the casualties (civilians, Afghan forces, etc.). Here’s the map from January 6th, 2004 (the light green indicates that an IED was planted but that it was found and defused without any casualties):
Compare to the map for August 24, 2009, which shows that the incidence of attempted IED attacks has gone up significantly, though most of them that day were discovered before they harmed anyone:
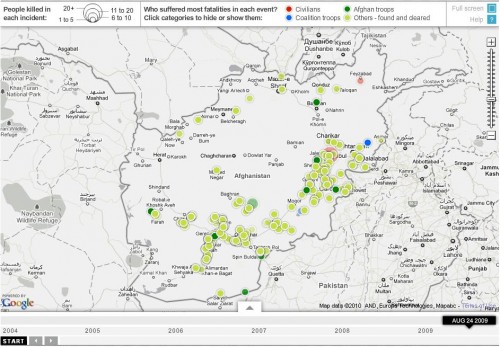
I can think of a possible explanation for the increase in the use of IEDs over time. One could be that their use diffused from other war zones, particularly Iraq, and were increasingly adopted as a technique in Afghanistan; perhaps Afghans opposed to the Coalition weren’t familiar with IEDs in the early years of the invasion and they were therefore relatively infrequent. The other, which doesn’t exclude the first, is that it indicates an increase in resistance to the Coalition forces and their Afghan allies over time.
The increase in the number of IEDs that are discovered and defused before they go off would seem to show how groups adapt to forms of warfare; presumably the Coalition forces have become more aware of the danger of IEDs and thus look out for them more and are more skilled at clearing them.
I might be totally wrong on both counts, so if you have other thoughts, please share them.
More data on IED attacks over time, including civilians wounded:
It’s a fascinating resource for information on the war. I think it’s really interesting as an illustration of the rationalization and bureaucratization of warfare by the U.S. military: that is, events are carefully categorized and described, and military leaders have an enormous amount of data them. While individual soldiers may very well experience war as chaotic or disorganized, those overseeing it have a wealth of information that methodically distills that chaos and disorganization into statistics associated with particular events whose location is clearly identified.
Comments 16
Mike — July 28, 2010
I think that the links offer an interesting peek into some situations in Afghanistan, but the post leaves me asking for the big "so?"
A — July 28, 2010
It's funny -- with Lisa or Gwen's analysis, people complain that the posts project the author's own beliefs and do not give readers the freedom to interpret on their own. Without much author commentary, people are "left asking for the big 'so?'"
Henry — July 29, 2010
Sorry I didn't quite finish. Re: Gwen's comments on the rise of IEDs - I think you are right on both counts, especially the rise in opposition to the coalition forces in the country generally. Again, this is something the NATO governments would prefer us not to spend too much time thinking about - and the views and opinions of the local population are again sidelined by the type of "war glory" reporting that I linked to above and by broad statements from the military about "Strategy", "Objectives" and "Winning".
Thibaut THOMAS — July 29, 2010
I just got interviewed about the Wikileaks case for a french newspaper: http://www.ecrans.fr/Un-simple-lien-vers-des-donnees,10510.html
You have a very valid point about the rationalization/bureaucratization of warfare. I argue that there is a misconception about "data", very common in "rational" science/computer science. They often forget that data is never raw, it's always produced in a complex way in a complexe situation.. It's not surprising that the geek/Web2.0/opendata advocates are so fascinated by these warlogs, and the "mapping" of them. As I put it "Simply put thumbtacks on a map does not tell us anything about the manufacture of pins".
This is also an interesting case of the weakness of the crowdsourcing ideology : even it's most stubborn advocate, Wikileaks, eventually turned to a team of highly trained journalists from the best newspapers in the world to consider these "data" as journalistic sources, treat them, put them into context, and deliver them to the public as mediators.
Henry — July 29, 2010
Thomas,
Excuse me if I've misread you, but is your final point there that Wikileaks turned to the journalists because they were unable to deliver the information effectively to the public themselves? - if so - was that because of a general mistrust of this type of information gathering exercise?
Diana Wueger — July 29, 2010
I've been following the Wikileaks story as it has developed through the national security blogs, and a couple things have stood out to me:
1. The 300 "most interesting" incidents: It's not clear how they were selected, or whether they were independently verified, so I'm not sure what we're supposed to learn from just this sample. One of the problems with the Wikileaks is that these are just initial incident reports that might not be, and in fact probably aren't, the full picture. Noah Shachtman over at Wired did a really interesting piece on how his experience in a firefight in Helmand matches up with the logs at http://www.wired.com/dangerroom/2010/07/my-war-wikileaked-why-the-public-and-the-military-cant-count-on-those-battle-logs/
2. To Gwen's point about what information soldiers have vs. leaders, one of the strengths of the U.S. military is the trust placed in soldiers very early on in their careers. This data was obtained from a junior military intel guy, and, if I understand correctly, was available to anybody with access to SIPRNet (which is to say, everybody with Secret-level clearance). Bob Gates has specifically stated that this will not change the military's policy of allowing broader access. Now, whether the individual soldier has the time or interest to read through these reports is questionable (apparently they get really boring really fast), but even the leadership doesn't read all of it - they rely on intel analysts to make sense of it and distill the key points for them.
3. To Henry's point #2 about why this was withheld: There's debate over classification and whether much of this should have been declassified earlier. One of the arguments for maintaining secrecy is, as mentioned above, these are incomplete and hard to analyze without training, and, yes, could be spun in any number of directions to whip up public sentiment. Additionally, while any one incident report may not tell much, in aggregate the enemy could gain a deeper understanding of coalition tactics and strategies. While they might be able to piece the same knowledge together from their own experiences, there's no point in making it easier for them.
Happy to point people to additional resources if they're interested in the debate. Joshua Foust has been writing prolifically on the topic, and he's made some excellent points.
J — July 29, 2010
Hmm... the whole 'civilian casualties' thing is interesting. Who determines to which category the deaths belong? I'm sure that a lot of the time, innocent and peaceable people are killed (whether by accident or purposely), but there is a remarkable tendency for the media to classify as a civilian what should really be called a member of a militia. When someone picks up an object with the intent to use it as a weapon to harm someone else as an act of war, and said person dies... I'm sorry, but that person is not a civilian casualty. This viewpoint is per American history, as well, so there's a precedent; look at the colonial militia at the start of the Revolutionary War. So, I'm just curious as to whether this is a case of inflated numbers for the furthering of a socio-political agenda, or if those numbers truly represent -civilian- casualties.