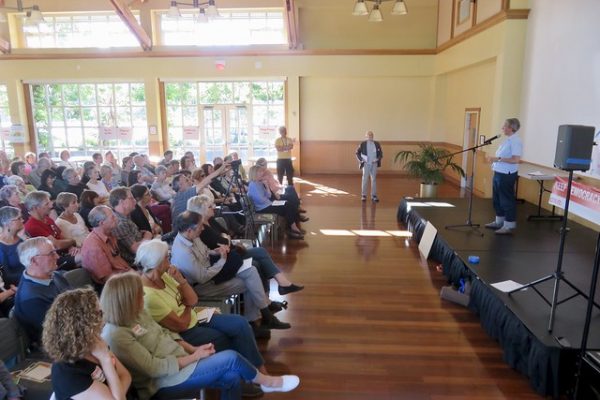
In general, Americans are positive about the idea of “diversity.” Yet, they may also have mixed, ambivalent feelings about living in a diverse area. In a recent article, Erin Hoekstra and Joseph Gerteis show that people express their mixed feelings through discussions of social order and civic engagement. This “civic talk” allows people to speak positively about the idea of diversity while also expressing misgivings about their changing neighborhoods and the presence of new, different groups.
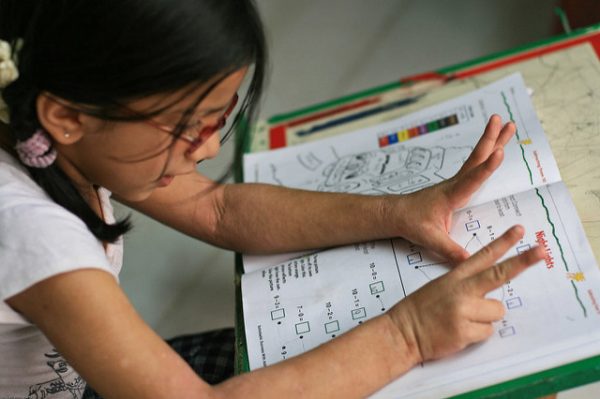
The authors conducted fieldwork and interviews in neighborhoods in Atlanta, Los Angeles, and Minneapolis in the summer of 2003. Each neighborhood was fairly racially homogenous. In Los Angeles and Minneapolis, the neighborhoods were over 75% white, while the neighborhood in Atlanta was over 75% Black. The authors coded their field-notes and interviews to illustrate how people discussed diversity as an ideal in tension with their accounts of personal experiences.
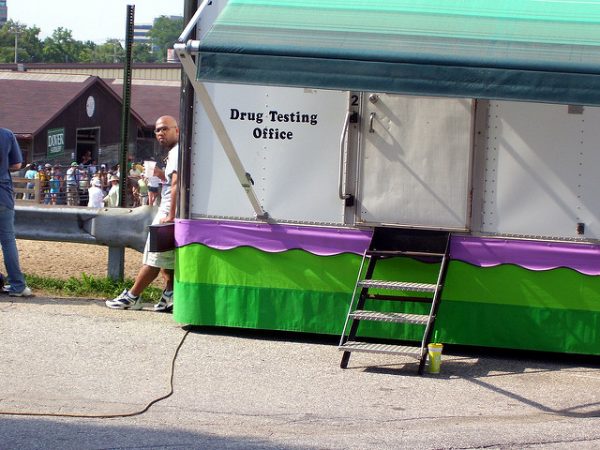
Participants frequently said that diversity was a positive, harmonious characteristic of their neighborhood. However, several people also discussed discomfort with others in their neighborhood and challenges associated with diversity. In identifying misgivings, participants used two aspects of civic life to voice their concerns. First, residents brought up the concept of “social order” to identify groups or newcomers who they associated with causing trouble or violating neighborhood rules. Second, residents would discuss a groups’ lack of “civic engagement,” such as not participating in the neighborhood association. By using “civic talk,” residents maintained a positive orientation toward diversity in the United States, while simultaneously voicing their misgivings or apprehension about living in a more diverse area.


.jpg)