 American families are diversifying in ways that are more complicated than ever, creating distinct patterns in different parts of the country and subgroups of the population. That’s why policy-makers and community leaders need detailed, locally-specific census data about family formation, marriage trends, divorce, and widowhood. This information is essential in order to accurately assess everything from population growth patterns to the special educational and social needs of different neighborhoods. Yet the Census Bureau has announced plans to cut from the American Community Survey several questions that provide such crucial information to researchers, planners, journalists, and the general public.
The questions to be cut include:
In the past 12 months did this person get—Married?
In the past 12 months did this person get—Widowed
In the past 12 months did this person get—Divorced?
Times Married—How many times has this person been married?
In what year did this person last get married?
What is the American Community Survey?
The American Community Survey (ACS) is the large Census Bureau survey that replaced the “long form” of the decennial census in the 2000s. It uses a sophisticated rotating geographic sampling design to gather information for households at all levels of geographic detail – even down to small neighborhoods. Administering the survey is expensive, but cutting these questions to save money in the short run will cost America dearly in the long run.
Why we need the ACS to keep these questions:
1. Believe it or not, there is no national count of marriages and divorces. In 1996, the government stopped collecting detailed national data on legal marriages and divorces. Now the government produces simple counts of marriages and divorces, but without any accompanying information about age of marriage, marriage duration, or number of remarriages. Furthermore, the figures they produce exclude six states (California, Georgia, Hawaii, Minnesota, Louisiana, and Indiana) that together account for 20 percent of divorces.
The ACS is the only reliable source of national, state, and city data on the frequency of marriage, divorce, widowhood, and remarriage. It provides data that is vital for estimating the impact of socioeconomic trends and social policies on marriage rates and on married and unmarried households.
2. The ACS is the only source of data that can measure marriage and divorce patterns in smaller sections of the population, such as particular states and cities, minority groups, and gay and lesbian couples. Asian Americans, for instance, are now a relatively small section of the population, but they are the fastest growing racial-ethnic group. Don’t we need to know what kind of family trends are occurring in this group?
Some things we can learn with the ACS data – and only with ACS data:
How divorce rates for “millennials” vary in the top 25 metropolitan areas: Surely it’s worth knowing that divorce rates range from 3.9 per 100 married people in Portland to just 1.4 in New York City. Other ACS data can help us understand what factors may account for this.
How divorce rates differ for 15 different Asian national-origin groups: Generalizations about “the” Asian population obscure the fact that Thais and Cambodians have much higher divorce rates than Indians and Pakistanis.
How the recession affected divorce rates: The recession appeared to have slowed some divorces in its initial years. This was followed by an uptick in divorces in 2012. But the 2013 divorce rate (just made available) shows a sharp drop in 2013. This drop has yet to be explained, which is why we need continuing detailed data from the ACS about the socioeconomic and cultural factors and local variations that may be involved.
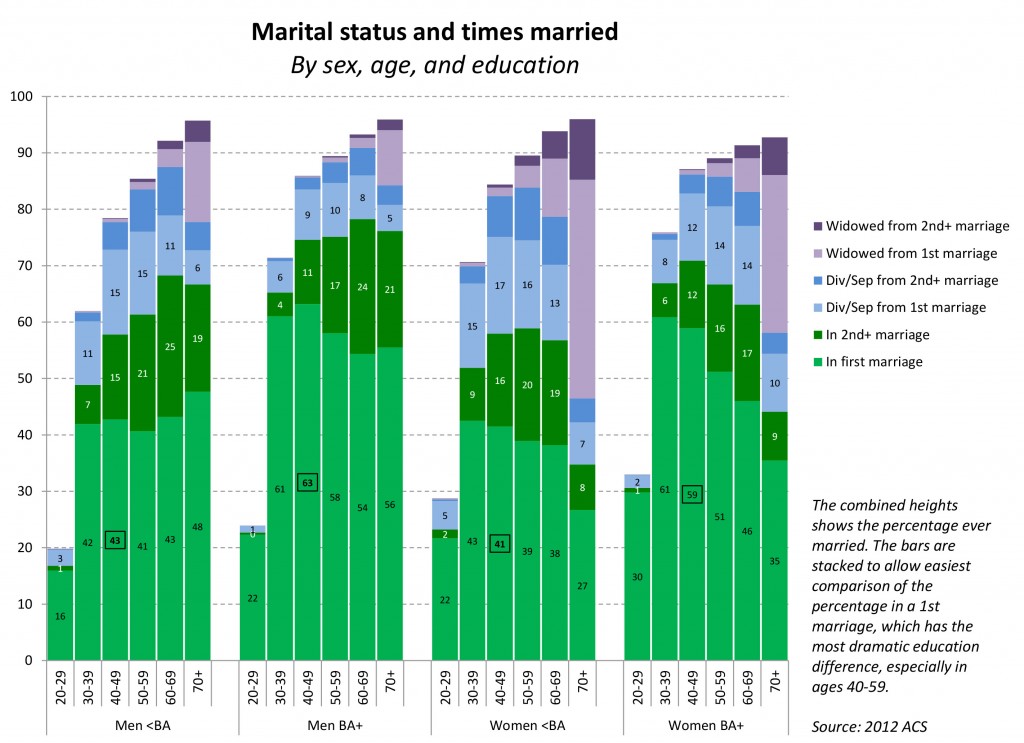
How marriage histories for men and women differ by education level: Married college graduates are much more likely than those with less education to be in their first marriages.
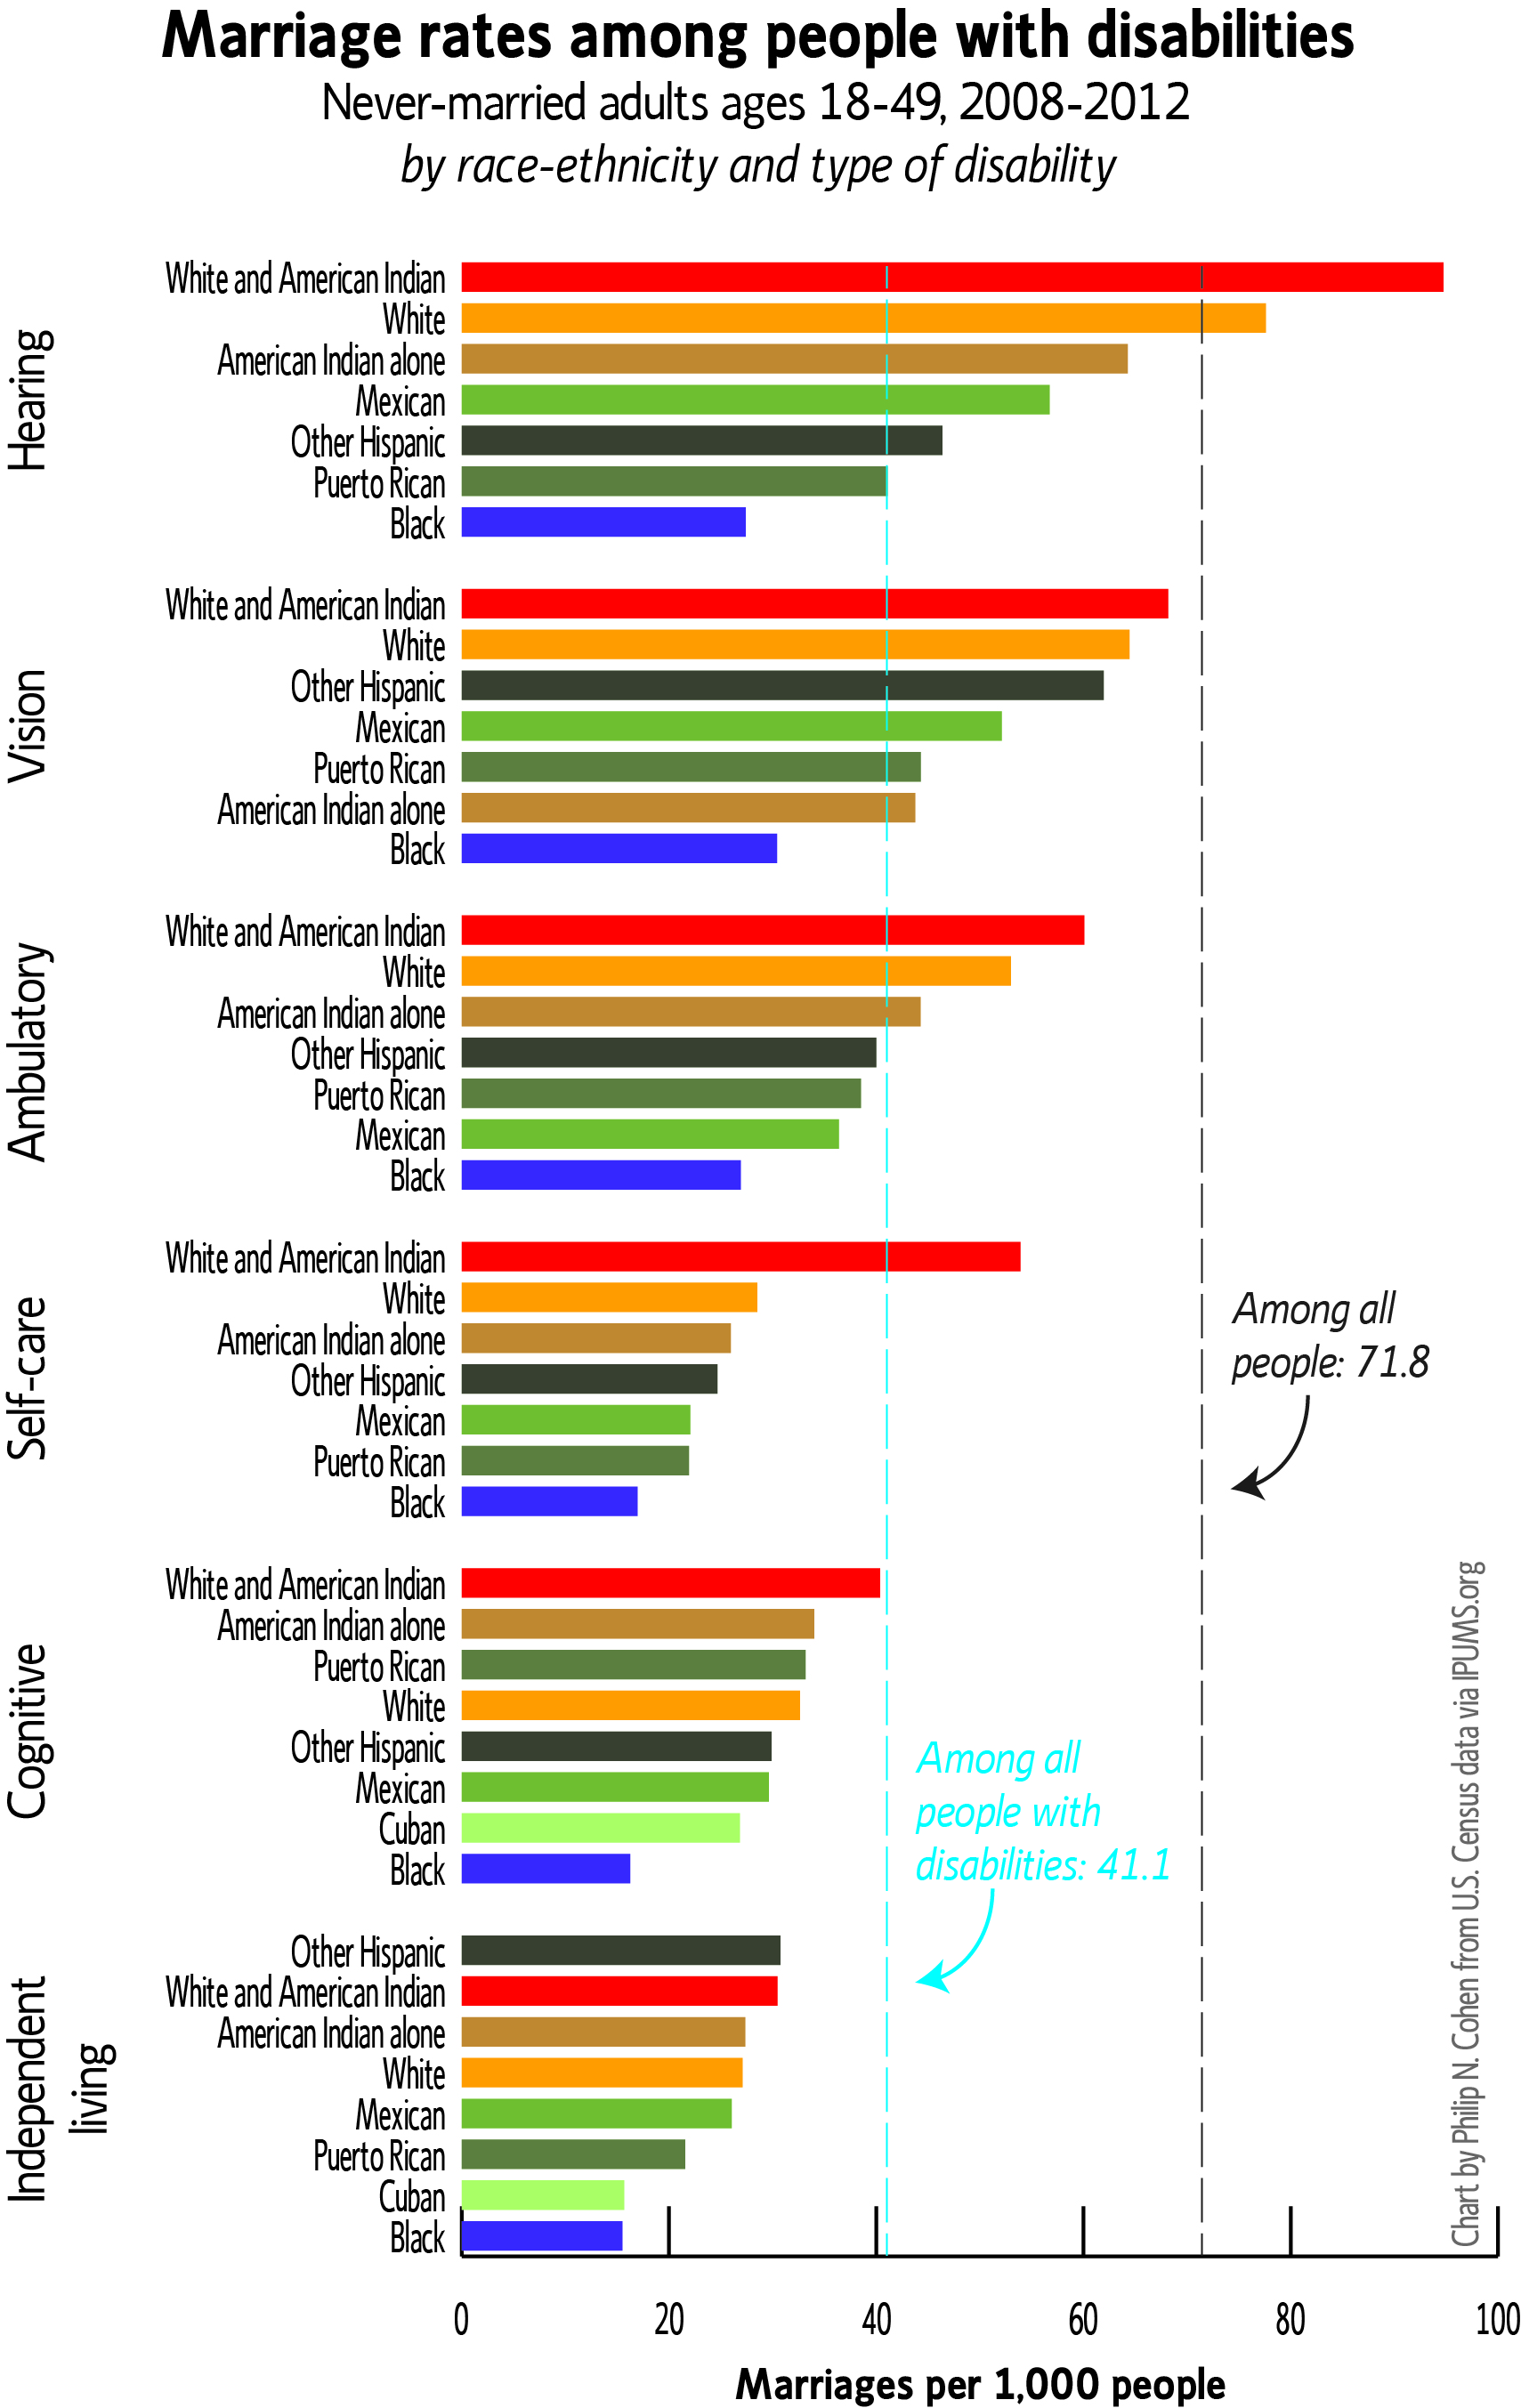
Marriage rates for people with different disabilities (by race/ethnicity): Having a disability reduces the chance that a person will marry. The overall first-marriage rate for people aged 18-49 is 71.8 per 1,000. For people with disabilities, it’s 41.1. But marriage rates vary by the type of disability, and also by race, regardless of disability type.
Detroit’s catastrophic demographic situation: Without the ACS we would not fully grasp the especially high divorce and early widowhood rates, falling population, educational failure, and unemployment that comprise the urban crisis there.
If we lose this kind of data, our ability to forecast future trends, anticipate potential problems, and understand our own families and local communities will be severely compromised. And that’s what might happen unless researchers and concerned citizens tell the government we need this kind of information to continue being collected. The government has given the public until the end of December to make its views known.
Information about the planned cuts to the American Community Survey is here: https://www.federalregister.gov/articles/2014/10/31/2014-25912/proposed-information-collection-comment-request-the-american-community-survey-content-review-results.
This briefing paper was prepared for the Council on Contemporary Families by Philip Cohen, Professor of Sociology, University of Maryland.

