nation: Senegal

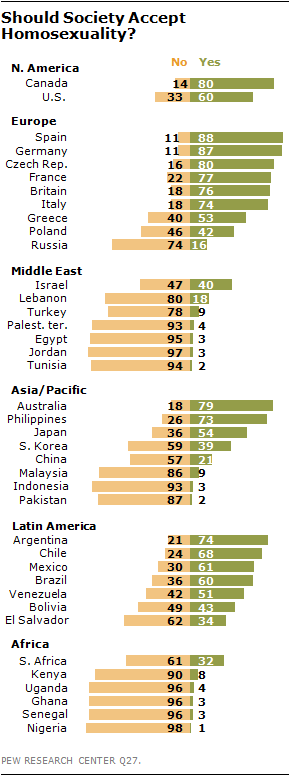
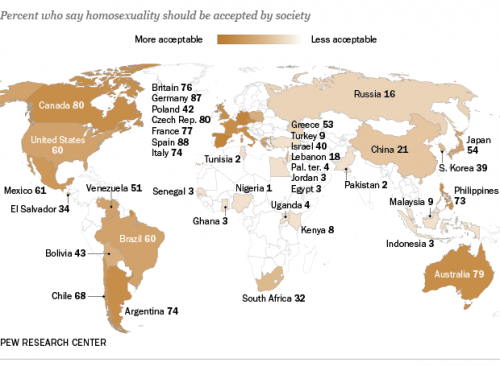
The Pew Research Global Attitudes Project recently released data on attitudes about homosexuality in 39 countries. Generally, those living in the Middle East and Africa were the least accepting, while those in the Americas, Europe, and parts of Asia (the Philippines, Australia, and to a lesser extent Japan) were most accepting:

PG_13.06.04_HomosexualityAccept_620

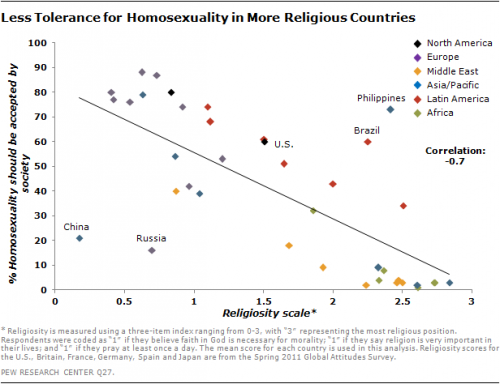
Generally, the more religious a country, the less accepting its citizens are of homosexuality:

2013-Homosexuality-03

The proportion of people who support social acceptance of gays and lesbians ranged from a high of 88% in Spain to a low of 1% in Nigeria:

2013-Homosexuality-05

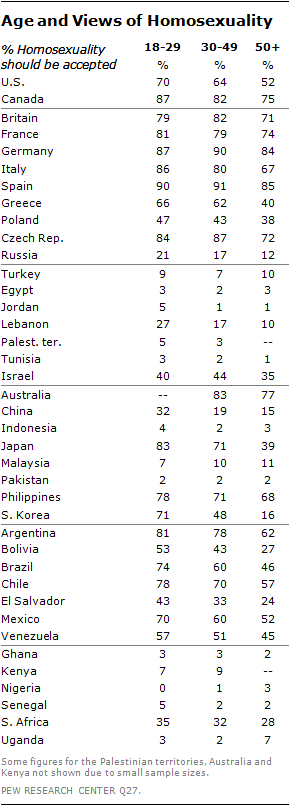
Attitudes about homosexuality vary widely by age. There is a pretty consistent global pattern of more positive attitudes among younger people, with a few exceptions:

2013-Homosexuality-01

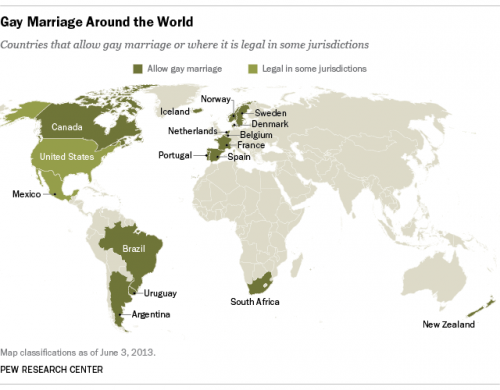
Thus far, legalization of same-sex marriage has been largely confined to the Americas and Europe; New Zealand and South Africa are the two outliers:

FT_13.05.31_gayMarriageMap

The Pew Center points out that of the 15 nations that have fully extended marriage rights to same-sex couples, 8 have done so just since 2010. In the U.S., we’re currently awaiting a Supreme Court’s decision, which should arrive shortly, to know if we’ll be joining the list sooner rather than later.

Thanks to Peter Nardi at Pitzer College for the link!

Gwen Sharp is an associate professor of sociology at Nevada State College. You can follow her on Twitter at @gwensharpnv.

Cross-posted at Neuroskeptic.

“Personality differences” between people from different countries may just be a reflection of cultural differences in the use of “extreme” language to describe people.

That’s according to a very important paper just out from an international team led by Estonia’s René Mõttus.

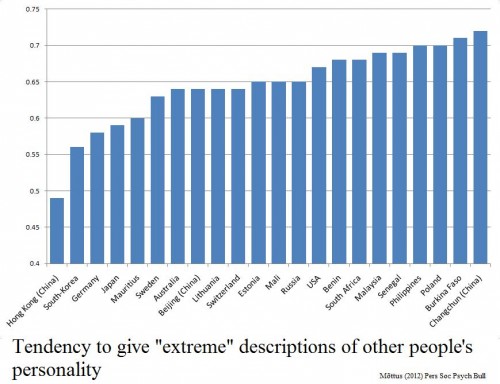
There’s a write up of the study here. In a nutshell, they took 3,000 people from 22 places and asked them to rate the personality of 30 fictional people based on brief descriptions (which were the same, but translated into the local language). Ratings were on a 1 to 5 scale.

It turned out that some populations handed out more of the extreme 1 or 5 responses. Hong Kong, South Korea and Germany tended to give middle of the road 2, 3 and 4 ratings, while Poland, Burkina Faso and people from Changchun in China were much more fond of 1s and 5s.

The characters they were rating were the same in all cases, remember.

Crucially, when the participants rated themselves on the same personality traits, they tended to follow the same pattern. Koreans rated themselves to have more moderate personality traits, compared to Burkinabés who described themselves in stronger tones.

Whether this is a cultural difference or a linguistic one is perhaps debatable; it might be a sign that it is not easy to translate English-language personality words into certain languages without changing how ‘strong’ they sound. However, either way, it’s a serious problem for psychologists interested in cross-cultural studies.

I’ve long suspected that something like this might lie behind the very large differences in reported rates of mental illness across countries. Studies have found that about 3 times as many people in the USA report symptoms of mental illness compared to people in Spain, yet the suicide rate is almost the same, which is odd because mental illness is strongly associated with suicide.

One explanation would be that some cultures are more likely to report ‘higher than normal’ levels of distress, anxiety — a bit like how some make more extreme judgements of personality.

So it would be very interesting to check this by comparing the results of this paper to the international mental illness studies. Unfortunately, the countries sampled don’t overlap enough to do this yet (as far as I can see).

Source: Mõttus R, et al (2012). The Effect of Response Style on Self-Reported Conscientiousness Across 20 Countries. Personality and Social Psychology Bulletin PMID: 22745332

————————

Neuroskeptic blogs anonymously here.  You can also follow him on Twitter.

For the last week of December, we’re re-posting some of our favorite posts from 2011.

————————

It seems obvious that basic cognitive perceptions shouldn’t vary by society.  That is, that our eyes should see, and our brains should process, essentially the same no matter what we call ourselves, what language we speak, or what holidays we observe.  It turns out, however, that even basic cognitions vary across the world.

Most Americans, for example, perceive the two lines in this optical illusion to be of different lengths, with line a shorter than line b.  In fact, they are the same length.

But, as argued by Joseph Henrich and colleagues in the Journal of Behavioral and Brain Sciences, our susceptibility to this illusion varies by culture.  On average, line a needs to be another fifth longer than line b before the average American undergraduate evaluates the lines to be equal in length.  Most other societies that have been tested on this illusion, however, require substantially less manipulation.  The figure below compares how individuals in different societies perform on this test.  The measures are tricky, and you can read more about them here; what you need to know for now is that the societies on the right are more susceptible to the illusion and the societies on the left less.

Observing that individuals in more developed societies (e.g., Evanston, Illinois) tend to be more vulnerable to the illusion — indeed, that in some societies, such as the San foragers of the Kalahari, it doesn’t qualify as an illusion at all — Henrich and his co-authors argue that exposure to “modern environments” may be the culprit:

…visual exposure during ontogeny to factors such as the “carpentered corners” of modern environments may favor certain optical calibrations and visual habits that create and perpetuate this illusion.  That is, the visual system ontogenetically adapts to the presence of recurrent features in the local visual environment.

Even basic cognition, that is, varies across cultures.

As Henrich et al. argue, this calls into question all of the truisms of psychology based, primarily, on experimental research with Western subjects.

Lisa Wade, PhD is an Associate Professor at Tulane University. She is the author of American Hookup, a book about college sexual culture; a textbook about gender; and a forthcoming introductory text: Terrible Magnificent Sociology. You can follow her on Twitter and Instagram.

As a member of a cattle-raising family, I hear a pretty steady stream of complaints about people eating less beef, which is variously attributed to a conspiracy against the American rancher (possibly by terrorists), the result of stupid city people who get all terrified over every little health concern (Mad Cow Disease is a myth! Unless it’s a terrorist plot to ruin ranching), environmentalists, animal rights activists, and me (I’ve been a vegetarian since 1996 and thus single-handedly nearly destroyed the beef industry).

The National Cattlemen’s Beef Association is similarly concerned about reduced beef consumption. And given that we frequently hear about the connections between red meat consumption and health concerns such as heart disease, and are advised to substitute white meat for red meat (to the point that the pork industry began branding pork as “the other white meat”), you’d probably expect to see a dramatic decline in consumption of beef.

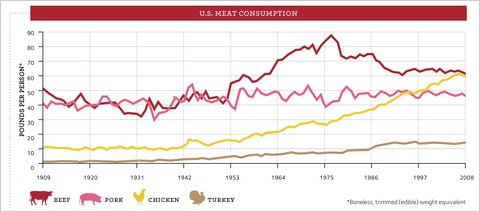
And we do see a decline, but not as much as you might expect, as this graph from the Freakonomics blog, sent in by Dmitriy T.M. and Bryce M. (a student at Rensselaer Polytechnic Institute), illustrates:

Clearly beef consumption has declined since its peak in the late 1970s, when people in the U.S. ate nearly 90 pounds of beef each per year, to closer to 60 lbs. each today. On the other hand, all those health warnings, disease scares, and environmentalist-vegetarian terrorist plots haven’t yet knocked beef out of its position as the most-eaten meat in the U.S. Clearly, chicken seems poised to take over that position, but beef doesn’t exactly appear to be falling off the charts.

So how do we compare to other countries in terms of overall meat consumption? In a 2003 article in the Journal of Nutrition, Andrew Speedy provided data on global meat consumption (defined as “beef and buffalo, sheep and goat, pig meat and poultry”) — note it’s in kilograms, not pounds, and the legend should be read across, not down (so the first bar is for the U.S., the second is for France, and so on):

So insofar as there has been a decrease in beef consumption in the U.S., and more dramatic increase in chicken consumption: what’s going on? The Freakonomics article presents an explanation:

A study by the agricultural economists James Mintert, Glynn Tonsor, and Ted Schroeder found that for every 1 percent increase in female employment, beef consumption sank by .6 percent while chicken consumption rose by .6 percent. Why? Probably because beef takes longer than chicken to prepare, and because poultry producers did a good job marketing cheap and ready-to-cook chicken products. Furthermore, all those working women meant more household income, which meant more families eating in restaurants — where meals are less likely to contain beef than meals at home.

Health concerns do play a part; the authors found that negative media coverage of beef (either recalls due to contamination or general links to heart disease, etc.) reduced consumption, while positive coverage that linked eating meat to getting iron, zinc, and other minerals increased it. But they found that health effects were small compared to the effects of changing family dynamics — that is, women working outside the home and families eating fewer meals at home.

It’s a nice example of how the factors driving social changes are often much more complex than we’d expect. Common sense explanations of changes in beef consumption would, I think, a) overestimate how much less beef Americans eat than in the past and b) assume the major driving factors to be health-related concerns, whether about chronic disease or recalls. Yet it turns out a major aspect of the story is a structural change that doesn’t seem clearly connected at all.

I guess if I were a health advocate hoping people in the U.S. were starting to listen to messages about healthy eating, that might depress me. But I guess I can tell my grandma that the terrorists’ evil plans to infect U.S. cattle herds with Mad Cow or some other disease might not be as catastrophic as they might imagine.

UPDATE: As a couple of readers point out, the increase in chicken consumption can’t be explained just as a result of people eating chicken when they otherwise would have eaten beef; the drop in beef consumption is way overshadowed by the increase in how much chicken people eat. The total amount of all meat eaten each year has increased dramatically.

I don’t know what is driving all of that change, but I suspect a lot of it is marketing campaigns — not just directly to consumers, but efforts by industry groups and the USDA to get more meat into a wide variety of items at grocery stores and on restaurant menus, as they have done with cheese.

This 23-minute documentary, The Colony, explores Chinese immigration to Senegal. The immigrants are drawn to Africa by the promise of lucrative entrepreneurship and they are changing the economic landscape, to the pleasure and displeasure of locals.

At Al Jazeera.

Lisa Wade, PhD is an Associate Professor at Tulane University. She is the author of American Hookup, a book about college sexual culture; a textbook about gender; and a forthcoming introductory text: Terrible Magnificent Sociology. You can follow her on Twitter and Instagram.