
Excess under age-60 female mortality in less developed countries is estimated to add up to 3.9 million missing women worldwide (World Bank, 2011). A large proportion of this is due to sex-selective abortion practices. The practice occurs most commonly among poorer families in societies where boy children are given greater economic and social status than girl children. In such a context, the transition to smaller families can lead parents to choose boys over girls. Notably, female fetuses are most likely to be aborted when the first child born is a girl.
The table below shows the countries with the most skewed ratios at birth in the world. While there is naturally a slightly higher sex ratio of boys to girls — between 1.04-1.06 — ratios above that are considered to be altered by technology due to gender preferences for boy children.
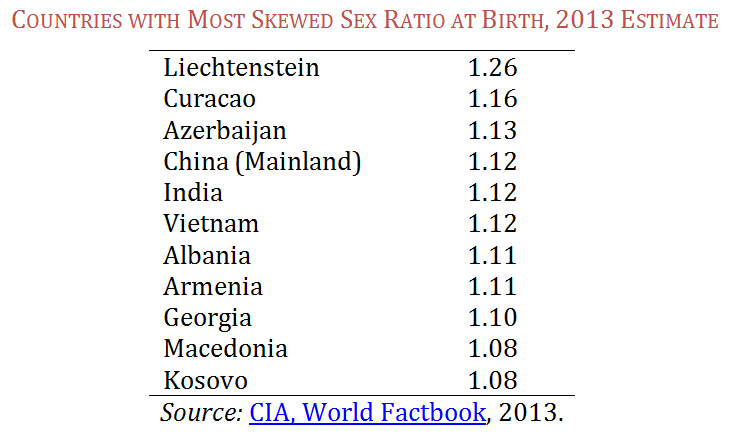
The reason we find this newest 2013 data of particular interest is that, despite the popular Western focus on Asia, the practice occurs in more European countries. Perhaps most striking is the central European country that ranks at the top of the list—Liechtenstein. This strikes us as odd, given that Liechtenstein has never made this list in the past. Perhaps this is a data collection error (in very small populations, as also in Curacao, the results can be skewed). But we are surprised that no journalists have picked up on the fact that the worst offending son-preference country in the world is now, allegedly, a European country. We contacted the CIA to ask them about this possible data anomaly but have not yet heard back.*
On the other hand, if the Liechtenstein data is accurate, this would be a very interesting story indeed, especially since Liechtenstein has the most restrictive laws against abortion in Europe. A quick scan of gender equity policies in Liechtenstein shows that women there were not legalized to vote until 1984, indicating that it is not the most gender egalitarian of European countries.
In any case, whether Liechtenstein’s inclusion in this disreputable list is a data error or not, the other European countries on the list are legitimate. They have been high for many years, and a recent report on Armenia, for example, documents longstanding norms in gender preference. The disproportionate focus on birth sex ratios in China and India no doubt reflects their status as the #1 and #2 most populous countries, which means a much greater overall impact in sheer numbers. Nevertheless, our point stands. Why has the disproportionate inclusion of non-Asian countries on the above-list gone virtually unmentioned by journalists?
Do Developed Western Countries Prefer Boys?
Americans often think of parental sex preference as a thing of the past, or a problem in developing countries. After all, the U.S. sex ratio at birth falls in the normal range, at 1.05. This is in spite of the curious American cottage industry in sex-identification home use kits, such as the Intelligender, the GenderMaker and the Gender Mentor.

In surveys, American parents report an ideal of two children and equal preference for boys and girls. However, American gender preferences manifest themselves in more sneaky ways. A 2011 Gallup poll showed that, if they were only able to have one child, the highest preference was for a boy. These results are little changed from the same Gallup question asked of Americans in 1941.
To return to a point made in an earlier post on skewed sex ratios, Americans may not be so different, after all, in their gender preferences from the countries in the above table. The crucial difference, she noted, is that some Asian countries are more enabled to act on their boy preference than others. It appears we should now be including some European countries in that “enabled” group as well.
* Neither the United Nations, Population Reference Bureau, nor the World Bank have published 2013 statistics yet for comparison to the CIA data.
Jennifer Lundquist is an associate professor of sociology at the University of Massachusetts, Amherst who specializes in stratification and social demography.
Eiko Strader is a PhD student in sociology at the University of Massachusetts, Amherst who studies inequality in labor markets and the welfare state.


